Configuring Advanced Threat Prevention Settings
This chapter describes settings that you can configure in the tab > pane. These settings apply globally for all gateways enabled with Threat Prevention Software Blades.
Engine Settings
On the > pane, configure settings related to Threat Prevention inspection engines, the Check Point Online Web Service (ThreatCloud repository), and advanced Anti-Bot and Threat Emulation settings.
Fail Mode
Select the behavior of the ThreatSpect engine if it is overloaded or fails during inspection. For example, if the Anti-Bot inspection is terminated in the middle because of an internal failure. By default, in such a situation all traffic is allowed.
- - All connections are allowed in a situation of engine overload or failure (default).
- - All connections are blocked in a situation of engine overload or failure.
Check Point Online Web Service
The Check Point Online Web Service is used by the ThreatSpect engine for updated resource categorization. The responses the Security Gateway gets are cached locally to optimize performance.
- When selected, connections are blocked when there is no connectivity to the Check Point Online Web Service.
- When cleared, connections are allowed when there is no connectivity (default).
- - You can select the mode that is used for resource categorization:
- - When a connection cannot be categorized with a cached response, an uncategorized response is received. The connection is allowed. In the background, the Check Point Online Web Service continues the categorization procedure. The response is cached locally for future requests (default).
This option reduces latency in the categorization process. - - When a connection cannot be categorized with the cached responses, it remains blocked until the Check Point Online Web Service completes categorization.
- - Lets you set different modes for Anti-Bot and Anti-Virus. For example, click to set Anti-Bot to Hold mode and Anti-Virus to Background mode.
Anti-Bot Settings
Emails that are sent to external networks are scanned by the Suspicious Mail engine. Internal emails are not scanned. You can create a list of email addresses or domains that are not inspected by Anti-Bot.
- - Lets you add an email or domain entry.
- - Lets you edit an entry in the list.
- - Lets you delete an entry in the list.
Selecting Emulation File Types
You can select the file types that are sent for emulation for all the Threat Prevention profiles. Each profile defines an or action for the file types.
To configure the file type actions, go to > > Double-click a profile > > for .
To select Threat Emulation file types for the profiles:
- From the section, click .
The window opens.
- Select the file types that are sent for emulation.
The shows the emulation environments that support the file type.
- Click .
Connection Unification
Gateway traffic generates a large amount of activity. To make sure that the amount of logs is manageable, by default, logs are consolidated by session. A session is a period that starts when a user first accesses an application or site. During a session, the gateway records one log for each application or site that a user accesses. All activity that the user does within the session is included in the log.
To adjust the length of a session:
- For connections that are allowed or blocked in the Anti-Bot, Threat Emulation, and Anti-Virus Rule Base, the default session is 10 hours (600 minutes). To change this, click and enter a different value.
- Click .
Configuring Whitelist Files
Whitelist is a list of files that are trusted. Check Point Threat Prevention engine does not inspect trusted files for malware, viruses, and bots, which helps decrease resource utilization on the gateway.
To add a file to the Whitelist:
- Select .
The page opens.
- Click .
The window opens.
- Enter parameters for the new file exception:
- (optional)
- signature
- Select a color (optional) - the default is black
- Click .
To edit attribute of a file from the Whitelist:
- Select .
The page opens.
- Select a file.
- Click .
- In the file properties window that opens, make necessary changes.
- Click .
To remove a file from the Whitelist:
- Select .
The page opens.
- Select a file or multiple files.
- Click .
- Click to confirm.
Threat Indicators Settings
This feature is supported in R77.20 and higher.
Threat Indicators lets you upload Indicator files that contain sets of observables. These observables are added to the Threat Prevention policy.
To activate:
- Install the R77.20 Add-on. See sk101217.
- If the R77.20 Security Gateway was upgraded from a version earlier than R77, edit these configuration files to add the statement.
- :
$include ../amw/ioc/cur/rep/urlrep_ioc.eng - :
$include ../amw/ioc/cur/md5/av_hash_ioc.eng - :
$include ../amw/ioc/cur/sigs/malware_ioc.eng
- In a Multi-Domain Security Management environment, you must activate this feature on each domain, after you activate it on the Multi-Domain Server.
To use Threat Indicators:
Indicator files must be in CSV or STIX XML format, and contain records of equal size. If an Indicator file has records which do not have the same number of fields, it will not load.
Each record in the Indicator file has these fields:
|
|
|
|
|
|
|
Field
|
Description
|
Valid Values
|
Value Criteria
|
Optional
|
UNIQ-NAME
|
Name of the observable
|
Free text
|
Must be unique
|
No
|
VALUE
|
A value that is valid for the type of the observable
|
See the table below
|
See the table below
|
No
|
TYPE
|
Type of the observable
|
URLDomainIPIP RangeMD5Mail-subjectMail-fromMail-toMail-ccMail-reply-to
|
Not case sensitive
|
No
|
SEVERITY
|
Degree of threat the observable presents
|
|
Default - high
|
Yes
|
PRODUCT
|
Check Point Software Blade that processes the observable
|
|
AV - Check Point Anti-Virus Software Blade (default)
AB - Check Point Anti-Bot Software Blade
Note - only the Anti-Virus Software Blade can process MD5 observables.
|
Yes
|
COMMENT
|
|
Free text
|
|
Yes
|

|
Notes -
- If an optional field is empty, the default value is used.
- If a mandatory field is empty, the Indicator file will not load.
|
These are the values that are valid for each observable type:
Observable Type
|
Validation Criteria
|
URL
|
Any valid URL
|
Domain
|
Any URL domain
|
IP
|
Standard IPv4 address
|
IP Range
|
A range of valid IPv4 addresses, separated by a hyphen: <IP>-<IP>
|
MD5
|
Any valid MD5
|
Mail-subject
|
Any non-empty text string
|
Mail-to
Mail-from
Mail-cc
Mail-reply-to
|
Can be one of these:
- A single email address (Example:
abc@domain.com) - An email domain (Examples:
@domain.com or domain.com)
|
Requirements for validation of CSV Indicator files:
- Use commas to separate the fields in a record
- Enter one record per line, or use '\n' to separate the records
- If free text contains quotation marks, commas, or line breaks, it must be enclosed in quotation marks
- To enclose part of free text in quotations, use double quotation marks: ""
<text>""
Example of a CSV Indicator File
#! DESCRIPTION = indi file boaz,,,,,,
"#! REFERENCE = Indicator Bulletin; Feb 20, 2014",,,,,,
# FILE FORMAT:,,,,,,
"# All lines beginning ""#"" are comments",,,,,,
"# All lines beginning ""#!"" are metadata read by the SW",,,,,,
"# UNIQ-NAME,VALUE,TYPE,CONFIDENCE,SEVERITY,PRODUCT,COMMENT",,,,,,
observ1,8d9b6b8912a2ed175b77acd40cbe9a73,MD5,medium,medium,AV,FILENAME:WUC
 Invitation Letter Guests.doc
observ2,76700f862a0c241b8f4b754f76957bda,MD5,high,high,AV,FILENAME:essais~.swf|
NOTE:FWS type Flash file
observ7,http://somemaliciousdomain.com/uploadfiles/upload/exp.swf?info=
789c333432d333b4d4b330d133b7b230b03000001b39033b&infosize=00840000
,URL,high,high,AV,IPV4ADDR:196.168.25.25
observ8,svr01.passport.ServeUser.com,Domain,low,high,AB,TCP:80|
IPV4ADDR:172.18.18.25|NOTE:Embedded EXE Remote C&C and Encoded Data
observ9,somemaliciousdomain2.com,Domain,,low,AV,TCP:8080|IPV4ADDR:172.22.14.10
observ10,http://www.bogusdomain.com/search?q=%24%2B%25&form=MOZSBR&pc=
MOZI,URL,low,low,AB,IPV4ADDR:172.25.1.5
observ11,http://somebogussolution.com/register/card/log.asp?isnew=-1&LocalInfo=
Microsoft%20Windows%20XP%20Service%20Pack%202&szHostName=
ADAM-E512679EFD&tmp3=tmp3,URL,medium,,AB,
observ14,172.16.47.44,IP,high,medium,AB,TCP:8080
observ15,172.16.73.69,IP,medium,medium,AV,TCP:443|NOTE:Related to Flash
exploitation
observ16,abc@def.com,mail-to,,high,AV,"NOTE:truncated; samples have appended to
the subject the string ""PH000000NNNNNNN"" where NNNNNNN is a varying number"
observ34,stamdomain.com,domain,,,AB,
observ35,stamdomain.com,mail-from,high,medium,AV,
observ37,xyz.com,mail-from,medium,medium,AB,
observ38,@xyz.com,mail-from,medium,medium,AB,
observ39,a@xyz.com,mail-from,medium,medium,AB,
|
Configuring Indicators in SmartDashboard
Define network objects to hold the Indicator files.
To load Indicators:
- Select .
The page opens.
- Click .
The configuration window opens.
- Enter a .
Each Indicator must have a unique name.
- Browse to the Indicator file.
The content of each file must be unique. You cannot load duplicate files.
- Select an action for this Indicator:
- - Threat Prevention Software Blade asks what to do with the detected observable
- - Threat Prevention Software Blade blocks the detected observable
- - Threat Prevention Software Blade creates a log entry, and lets the detected observable go through
- - Threat Prevention Software Blade does nothing
- Select a .
- Enter a (optional).
- Click .
If you leave an optional field empty, a warning notifies you that the default values will be used in the empty fields. Click . The Indicator file will load.
To delete Indicators:
- Select an Indicator.
- Click .
- In the window that opens, click to confirm.
You can edit properties of an Indicator object, except for the file it uses. If you want an Indicator to use a different file, you must delete it and create a new one.
Indicator CLI Commands
You can run these commands on the Security Management Server to manually add indicators to the Threat Prevention policy, or to remove them from the Threat Prevention policy.
load_indicators --add
Description: Add indicators to the Threat Prevention policy.
Syntax: load_indicators --add -i <input files> -a <action> [-n <name-prefix>] [-t <comment>] [-r <color>] [-o <output file>] [-p <product>] [-po <product-override>]
Parameter
|
Description
|
input files
|
Adds indicators from one of these:
- An Indicator file
- A list of Indicator files, separated by spaces
- A directory with Indicator files
- A .zip archive with Indicator files
Notes -
- Use full pathnames or directory names
- Do not nest directories or archives
- You can load two files with the same name, but with different contents
|
action
|
Assigns one of these actions for detected observables:
prevent - blocks the detected observablesdetect - lets the detected observables go through and creates log entriesask - asks what to do with the detected observablesinactive - does nothing
|
name-prefix
|
Adds a prefix to the name of the indicator. By default, the name of the indicator is the filename of the input file. If you specify a prefix, the name of the indicator changes to <prefix>_<indicator name>.
|
comment
|
|
color
|
Changes the color coding of the indicator in SmartDashboard. The default is black.
Note - if you specify an invalid color, the default color is used.
|
output file
|
Specifies the pathname of an output file with the names of successfully added indicators. If you do not specify this value, load_indicators.out is created in the current directory.
|
product
|
Specifies the Check Point Software Blade that processes the observables that do not have the product specified in the input file. Select one of these:
AV - Anti-Virus (default)AB - Anti-Bot
Notes -
- If you do not specify the
product value, the default value is used - For MD5 observables, the product is always
AV, regardless of what you specify
|
product-override
|
Overrides the product for all the observables in the input file, except for MD5.
|
Examples:
load_indicators --add -i CIB-20120508-01.csv -a prevent
The CIB-20120508-01.csv Indicator file is loaded. All specified in it observables will be blocked.
load_indicators --add -i CIB-20120508-01.csv CIB-20120508-02.csv CIB-20120508-03.csv -a prevent -n prefix -o my_output.txt
These three indicator files are loaded: CIB-20120508-01.csv, CIB-20120508-02.csv, and CIB-20120508-03.csv. All observables specified in these files will be blocked, the name of the indicator will be prefixed with prefix_, and the my_output.txt output file will be created in the current directory.
load_indicators --add -i my_indicators_dir -a ask -n prefix123
All Indicator files in the my_indicators_dir directory are loaded. The observables specified in these files are detected, but as each one arrives, the user will have to decide - to block it or to let it go through.
load_indicators --delete
Description: Delete indicators from the Threat Prevention policy.
Syntax: load_indicators --delete {--indc-files -i <indicator file-names> | --indc-names -i <indicator names> | --list-file -i <file-name> | -all} [-f]
Parameter
|
Description
|
--indc-files -i <indicator file-names>
|
Deletes indicators based on the provided indicator file-names:
- An Indicator file
- A list of Indicator files, separated by spaces
Note - Do not provide filenames with full paths
|
--indc-names -i <indicator names>
|
- Deletes indicators based on the
indicator-names: - An Indicator name
- A list of Indicator names, separated by spaces
|
--list-file -i <file-name>
|
Deletes all loaded indicators listed in the specified output file. See load_indicators --add for information on output files.
|
-all
|
Deletes all the indicators in the database.
|
-f
|
Deletes without verification.
|
Examples:
load_indicators --delete --list-file -i load_indicators.out
All indicators listed in the load_indicators.out file are deleted from the database.
load_indicators --delete --indc-files -i CIB-20120508-01.csv
All indicators from the CIB-20120508-01.csv Indicator file are deleted from the database.
load_indicators --delete --indc-names -i prefix_CIB-20120508-01 prefix_CIB-20120508-02
Indicators prefix_CIB-20120508-01 and prefix_CIB-20120508-02 are deleted from the database.
load_indicators --delete --all
All indicators are deleted from the database.
Threat Emulation Settings
Updating Threat Emulation
Threat Emulation connects to the ThreatCloud to update the engine and the operating system images. The default setting for the Threat Emulation appliance is to automatically update the engine and images.
To enable or disable Automatic Updates for Threat Emulation:
- Select > > .
The page opens.
- Select or clear these settings:
- Install the Threat Prevention policy on the applicable Threat Emulation appliances.
Threat Emulation Engine
Update packages for the Threat Emulation engine are usually around 10 - 40MB. The default setting is to download the package once a day. We recommend that you configure Threat Emulation to download the package when there is low network activity.
To change the automatic update settings for the Threat Emulation engine:
- Select > > .
The page opens.
- Make sure that is selected.
- Next to the option, click .
The window for the Threat Emulation engine opens.
- Configure the automatic update settings to update the database:
- To update once a day, select and enter the time of day
- To update multiple times a day, select and set the time interval
- To update once or more for each week or month:
- Select and enter the time of day.
- Click .
- Click or .
- Select the applicable days.
- Click and then install the Threat Prevention policy.
Threat Emulation Images
Update packages for the Threat Emulation operating system images are usually more than 2GB. The actual size of the update package is related to your configuration.
The default setting is to download the package once a week on Sunday. If Sunday is a work day, we recommend that you change the update setting to a non-work day.
To change the automatic update settings for Threat Emulation images:
- Select > > .
The page opens.
- Make sure that is selected.
- Next to the option, click .
The window for the Threat Emulation images opens.
- Configure the automatic update settings to update the database:
- To update once a day, select and enter the time of day
- To update multiple times a day, select and set the time interval
- To update once or more for each week or month:
- Select and enter the time of day.
- Click .
- Click or .
- Select the applicable days.
- Click and then install the Threat Prevention policy.
Configuring Advanced Profile Settings
To configure the advanced settings for a Threat Emulation profile:
- In the tab, select .
- Double-click the profile.
- Configure the Threat Emulation settings for the profile.
- Click .
- Install the Threat Prevention policy.
File Type Settings
You can configure the Threat Emulation and for each file type in the Threat Prevention profile.
It is possible to specify "safe" file types that Threat Emulation does not do emulation. File types can be considered safe because they do not normally contain malware threats.
To configure the file type settings for a profile:
- Double-click the Threat Prevention profile.
- From the navigation tree, select .
- From the section, select .
- Click .
The window opens.
- To change the emulation action for a file type, click and select one of these options:
- - Threat Emulation opens these files.
- - Files of this type are considered safe and the Software Blade does not do emulation for them.
- To change the emulation location for a file type, click and select one of these options:
- - The settings that are defined in the window are used for these files
- - Emulation for these file types is done on the Emulation appliance
- - These file types are sent to the ThreatCloud for emulation
Handling Connections During Emulation
lets you configure Threat Emulation to allow or block a connection while it finishes the analysis of a file. You can also specify a different mode for SMTP and HTTP services.
- - The connection is allowed and the file goes to the destination even if the emulation is not finished.
- - A connection that must have emulation is blocked and Threat Emulation holds the file until the emulation is complete. This option can create a time-delay for users to receive emails and files.
- For configurations that use Hold mode for SMTP traffic, we recommend that you use an MTA deployment.
If you are using the action, a file that Threat Emulation already identified as malware is blocked. Users cannot get the file even in mode.
To configure the Threat Emulation :
- Double-click the Threat Prevention profile.
- From the navigation tree, select > .
- From the section, select an option:
- - Files are sent to destination even if the Threat Emulation analysis is not finished
- - Connections that must have emulation are blocked until the Threat Emulation analysis is finished
- - Select this option and click to configure or modes for SMTP and HTTP services
Static Analysis
optimizes the file analysis and does an initial analysis on files. If the analysis finds that the file is simple and cannot contain malicious code, the file is sent to the destination without additional emulation. Static analysis significantly reduces the number of files that are sent for emulation. If you disable it, you increase the percentage of files that are sent for full emulation. We recommend that you disable static analysis only if there is an I/O bottleneck with the ThreatCloud. If you are using an Emulation appliance, and you want to disable static analysis, contact Check Point Technical Support.
To disable static analysis for the Threat Prevention profile:
- Double-click the Threat Prevention profile.
- From the navigation tree, select > .
- From the section, select .
- To enable static analysis, clear .
Threat Emulation Logs
To only generate Threat Emulation logs every file that has malware:
- Double-click the Threat Prevention profile.
- From the navigation tree, select > .
- From the section, clear .
- To generate logs for each file after emulation is complete, select .
Configuring MTA Advanced Settings
The MTA Advanced Settings window lets you configure which interfaces on the Security Gateway are listening for SMTP traffic that is sent to Threat Emulation.
Use the section to define these settings:
- Maximum time that emails are kept in the MTA queue
- Maximum amount of free hard drive space that the MTA can use
- Use the section to generate a log or send an alert if emails are delayed in the MTA
Emails that are in the MTA longer than the are blocked or allowed without emulation as configured in the  Fail Mode settings. The Troubleshooting setting lets you receive a log or alert to change the Threat Emulation settings for the profile and reduce the delay time. Fail Mode settings. The Troubleshooting setting lets you receive a log or alert to change the Threat Emulation settings for the profile and reduce the delay time.
Select the behavior of the ThreatSpect engine if it is overloaded or fails during inspection. For example, if the Anti-Bot inspection is terminated in the middle because of an internal failure. By default, in such a situation all traffic is allowed. - - All connections are allowed in a situation of engine overload or failure (default).
- - All connections are blocked in a situation of engine overload or failure.
To configure the MTA advanced settings:
- Double-click the Security Gateway and from the navigation tree select .
The page opens.
- In the section, click .
The window opens.
- To configure the interfaces for SMTP traffic, select one of these options:
- - SMTP traffic from all the interfaces are sent for emulation
- - SMTP traffic from the external interfaces are sent for emulation
- - SMTP traffic from the list of specified interfaces are sent for emulation. To add an interface to the list, click the plus sign ( + ). To remove a selected interface from the list, click the minus sign ( - ).
- To change the maximum number of minutes that the MTA keeps emails, configure .
- To change the amount of free hard drive space that the MTA can use, configure these settings:
- -Percentage of free hard disk space that the MTA can use
- - Total MB of free hard disk space that the MTA can use
- To change the action and tracking settings when the specified Mail Settings are exceeded, configure these settings:
- - SMTP traffic is allowed
- - SMTP traffic is blocked
- - No logs are generated
- - A log is generated in SmartView Tracker
- - Logs the event and sends the configured alert
- To change the MTA settings, configure these settings:
- - Set the maximum number of minutes that email is delayed in the MTA before the track option is done
- - Select (no logs are generated), (logs generated in SmartView Tracker), (logs the event and sends the configured alert).
- Click .
- Install the policy.
Disabling the MTA
To disable the MTA:
- Configure the network to disable the MTA.
- Disable MTA on the Security Gateway.
Configuring the Network to Disable the MTA
The MTA address can be saved in the cache. If the MTA queue is not empty, or you disable the MTA first, it is possible to lose emails that are sent to the network.
To disable MTA for email that is sent to the internal mail server:
- Connect to the DNS settings for the network.
- Change the MX records, and define the mail server as the next hop.
- Wait for 24 hours.
- Disable the MTA on the Security Gateway.
To disable MTA for email that is sent to a different MTA:
- Connect to the SMTP settings on the MTA that sends SMTP traffic to the internal mail server.
- Change the SMTP settings and define the mail server as the next hop.
- Make sure that the MTA queue is empty.
- Disable the MTA on the Security Gateway.
Disabling MTA on the Security Gateway
To disable the Security Gateway as an MTA:
- Double-click the Security Gateway and from the navigation tree select .
The page opens.
- Clear .
- Click and then install the policy.
Fine-Tuning the Emulation Appliance
You can change these advanced settings on the Emulation appliance to fine-tune Threat Emulation for your deployment.
Setting the Activation Mode
You can change the Threat Emulation protection of the Security Gateway or Emulation appliance. The emulation can use the Prevent action that is defined in the Threat Prevention policy or only Detect and log malware.
To configure the activation mode:
- Double-click the .
The window opens.
- From the navigation tree, select .
The page opens.
- From the section, select one of these options:
- Click and then install the policy.
Changing the Analysis Location
When you run the Threat Emulation First Time Configuration Wizard you select the location where the emulation analysis is done. You can use the window in to change the location.
|
Note - The Threat Prevention policy defines the analysis location that is used for emulation.
|
You can send files that are not supported on the local Emulation appliance to the ThreatCloud for emulation. It is necessary to have a ThreatCloud license to send files for emulation.
To change the location of the emulation analysis:
- Double-click the .
The window opens.
- From the navigation tree, select .
The page opens.
- From the section, select the emulation location:
- - Files are sent to the Check Point ThreatCloud for emulation
- - Select the Security Gateway that does the emulation and of the files
- Optional: Select .
If files are not supported on the Emulation appliance and they are supported in the ThreatCloud, they are sent to the ThreatCloud for emulation. No additional license is necessary for these files.
- Click .
- Install the policy on the Emulation appliance.
Configuring the Emulation Limits
To prevent too many files that are waiting for emulation, configure these emulation limits settings:
- Maximum file size (up to 100,000 KB)
- Maximum time that the Software Blade does emulation
- Maximum time that a file waits for emulation in the queue (for Emulation appliance only)
If emulation is not done on a file for one of these reasons, the settings for Threat Prevention define if a file is allowed or blocked.
Select the behavior of the ThreatSpect engine if it is overloaded or fails during inspection. For example, if the Anti-Bot inspection is terminated in the middle because of an internal failure. By default, in such a situation all traffic is allowed. - - All connections are allowed in a situation of engine overload or failure (default).
- - All connections are blocked in a situation of engine overload or failure.
You can configure the maximum amount of time that a file waits for the Threat Emulation Software Blade to do emulation of a file. There is a different setting that configures the maximum amount of time that emails are held in the MTA.
If the file is waiting for emulation more than the maximum time:
- Threat Emulation Software Blade - The Threat Prevention profile settings define if a file is allowed or blocked
- MTA - The MTA settings define if a file is allowed or blocked
To configure the emulation limits:
- In the tab, select > .
The pane opens.
- From the section, click .
The window opens.
- Configure the settings for the emulation limits.
- From , select the action if a file is not sent for emulation:
- - No action is done
- - The action is logged
- - An alert is sent to SmartView Monitor
- Click and then install the policy.
Changing the Local Cache
When a Threat Emulation analysis finds that a file is clean, the file hash is saved in a cache. Before Threat Emulation sends a new file to emulation, it compares the new file to the cache. If there is a match, it is not necessary to send it for additional emulation. Threat Emulation uses the cache to help optimize network performance. We recommend that you do not change this setting.
To change the size of the local cache:
- In the tab, select > .
The pane opens.
- From the section, click .
The window opens.
- From , configure the number of file hashes that are stored in the cache.
- Click and then install the policy.
Optimizing System Resources
The settings are only for deployments that use an Emulation appliance. Threat Emulation uses system resources for emulation to identify malware and suspicious behavior. You can use the settings to configure how much of the Emulation appliance resources are used for emulation. When you change these settings, there can be an effect on network and emulation performance. You can configure the settings for these system resources:
To optimize the system resources for the Emulation appliance:
- Double-click the .
The window opens.
- From the navigation tree, select > .
The page opens.
- From , configure the minimum percentage of hard disk space that must be available to do emulation.
The default value is .
- To configure the maximum amount of RAM that is available for emulation, select .
The default value is of the total RAM on the appliance.
- Optional: To change the amount of available RAM:
- Click .
The window opens.
- Enter the value for the memory limit:
- - Percentage of the total RAM that Threat Emulation can use. Valid values are between 20 - 90%.
- - Total MB of RAM that Threat Emulation can use. Valid values are between 512MB - 1000GB.
- Click .
- From , select the action if a file is not sent for emulation:
- - No action is done
- - The action is logged
- - An alert is sent to SmartView Monitor
- Click and then install the policy.
Managing Images for Emulation
You can define the operating system images that Threat Emulation uses for each appliance (Security Gateway or Emulation appliance), and for each Threat Emulation profile. If different images are defined for them, Threat Emulation uses images that are selected in the two places. An image that is selected only for the appliance or for the profile is not used for emulation.
We recommend that you change these settings only if one appliance uses an image and another one does not use it.
To manage the images that the appliance uses for emulation:
- Double-click the .
The window opens.
- From the navigation tree, select > .
The page opens.
- From the section, select the applicable option for your network:
- - The images that are configured in the window are used for emulation.
- - Select one of more images that the Security Gateway can use for emulation.
- Click and then install the policy.
Threat Emulation Virtual Interface
The Emulation appliance must have a virtual IP address and netmask to do file emulation. This setting is not used for emulation in the ThreatCloud.

|
Important - Only change this virtual IP address if it is already used in your network.
|
To change the IP address of the virtual interface:
- In the tab, select > .
The pane opens.
- From the section, click .
The window opens.
- Enter the and for the IP address for the virtual interface.
- Click and then install the policy.
Using Anti-Bot and Anti-Virus with VSX
When you configure Virtual Systems to use the Anti-Bot and Anti-Virus Software Blades, make sure the Software Blade:
- Is enabled and configured on the relevant Virtual Systems and enabled and configured on the VSX Gateway (VS0)
VSO handles contract validation for all Virtual Systems.
- Can connect to the internet
A Virtual System will try to get updates through the VSX Gateway (VS0). If the VSX Gateway fails, each Virtual System gets the update by connecting to the internet using its proxy settings.
Note - Where applicable, make sure the routing, DNS, and proxy settings for the VSX Gateway (VSO) are configured correctly.
To enable Anti-Bot and Anti-Virus on Virtual Systems:
- If applicable, configure proxy settings for the VSX Gateway (VSO) and/or the Virtual Systems:
- From the tree, double-click the VSX Gateway (VSO).
- From the navigation tree, select .
- Configure the proxy settings, and click .
- Enable and on the VSX Gateway (VSO):
- From the tree, double-click the Virtual System.
- In the section, select and .
- Click .
- Repeat steps 1-2 for all Virtual Systems that use and .
- Select the Threat Prevention and configure the policies.
- Install the Threat Prevention policy (and access policy if needed) on the VSX Gateway (VSO) and the relevant Virtual Systems.
For more about Anti-Bot and Anti-Virus, see the R77 Threat Prevention Administration Guide.
Threat Prevention CLI Commands
You can run commands from the CLI (Command Line Interface) to install Threat Prevention policy and for advanced Threat Emulation management.
fwm load -p threatprevention
Description: Run this command on the Security Management Server to manually install the Threat Prevention policy on the specified Security Gateways.
Syntax: fwm load -p threatprevention <rulebase> <targets>
Parameter
|
Description
|
rulebase
|
Name of the Rule Base
|
targets
|
Install the Threat Prevention policy on one or more of these Security Gateways
|
Example: fwm load -p threatprevention Standard gw1 gw2
te_add_file
Description: Use this command to manually send files for threat emulation. The command has to be run from expert mode. For a complete explanation of all the available parameters, run te_add_file.
Syntax: te_add_file -f= <file path> -d= <directory path>
Parameter
|
Description
|
-f=
|
Specifies the path to the file. You must include the file name at the end of the path.
|
-d=
|
Specifies the path to a directory. The command takes all the files in the directory and sends them for emulation.
|
Example: te_add_file -f=/home/admin/test.pdf
[Expert@gaia]# te_add_file -f=/home/admin/test.pdf
# Sending files... Wait for response: True
# Trying to connect to ted...
# Connected to ted...Ready to send...
# File path: /home/admin/test.pdf
# File type: pdf
# Got response from ted...
(
:event_id ("{000000A5-006D-0045-9D15-D6896862D148}")
:action (drop)
:confidence (high)
:done (0)
:file_path ("/home/admin/test.pdf")
:md5_string (61baabd6fc12e01ff73ceacc07c84f9a)
)
# Got response from ted...
(
:event_id ("{000000A5-006D-0045-9D15-D6896862D148}")
:action (drop)
:confidence (high)
:done (1)
:file_path ("/home/admin/test.pdf")
:md5_string (61baabd6fc12e01ff73ceacc07c84f9a)
)
/home/admin/test.pdf
Verdict: drop Time: 1 *
Total Files: 1
Verdicts distribution:
drop: 1
# Done 1 files in 1 seconds...Bye Bye...
|
Comments: ted is the Threat Emulation daemon.
tecli
Use the tecli commands to:
- Control local cache
- Show information about the Threat Emulation system
- Run advanced options
- Show status of emulation downloads, statistics and processes
- Configure affinity for TED (Threat Emulation Daemon)
tecli advanced clear
Description: Resets the emulation statistics for the Security Gateway or appliance.
Syntax: tecli advanced clear
tecli cache clean
Description: Deletes all the records in the local cache.
Syntax: tecli cache clean
tecli control sizing
Description: Controls the sizing mode tool that lets you estimate the resources that Threat Emulation will use in your network.
Syntax: tecli control sizing {enable|disable|status}
Note: For more about using sizing mode, go to sk93598.
tecli debug
Description: Enable and disable debug mode for Threat Emulation.
Syntax: tecli debug {on|off|scan local {enable|disable}}
Parameter
|
Description
|
on
|
Enables debug mode
|
off
|
Disables debug mode
|
scan local enable
|
Enables the appliance or Security Gateway to scan local connection
|
scan local disable
|
Disables the appliance or Security Gateway to scan local connection
|
Example:
tecli d o or tecli debug on
tecli d s l e or tecli debug scan local enable
tecli show
tecli show commands show data and statistics about the Threat Emulation Software Blade. You can also use abbreviated parameters to run tecli show commands. These are some useful command combinations:
Command
|
Description
|
tecli s s
|
Shows emulation statistics
|
tecli s c i
|
Shows information about ThreatCloud emulation
|
tecli s c q
|
Shows the quota for ThreatCloud emulation
|
tecli s e e
|
Shows the current status of the emulation queue
|
tecli s u a
|
Shows all the parts of file emulation
|
tecli show cloud
Description: Shows data and statistics about your ThreatCloud account.
Syntax: tecli show cloud {identity|info|quota}
Parameter
|
Description
|
identity
|
Shows data about how the Security Gateway or Emulation appliance connects to the ThreatCloud
|
info
|
Shows data about your file emulation in the ThreatCloud
|
quota
|
Shows data about your ThreatCloud monthly emulation quota
|
Example:
tecli s c id or tecli show cloud identity
tecli s c in or tecli show cloud info
tecli show emulator
Description: Shows data about Threat Emulation queue and VMs ().
Syntax: tecli show emulator {emulations|vm {synopsis|detailed|id <ID>}}
Parameter
|
Description
|
emulations
|
Shows the current status of the emulation queue
|
synopsis
|
Shows a summary of the VMs
|
detailed
|
Shows data and details of the VMs
|
id <ID>
|
Shows data for the VM with this ID
|
Example:
tecli s e e or tecli show emulator emulations
tecli s e v s or tecli show emulator vm synopsis
tecli show downloads
Description: Shows data and statistics about files and rules that Threat Emulation is downloading.
Syntax: tecli show downloads {all|images|dr|sa|raw|types}
Parameter
|
Description
|
all
|
Shows the status of all downloads
|
images
|
Shows download status of operating system images
|
dr
|
Shows download status of malware detection rules
|
sa
|
Shows download status of static analysis rules
|
raw
|
Shows download status of general Threat Emulation files
|
types
|
Shows the file extensions that are being sent for emulation
|
Example:
tecli s d a or tecli show downloads all
tecli s d i or tecli show downloads images
tecli show remote
Description Shows data and statistics about the Emulation appliance
Syntax tecli s r i or tecli show remote information
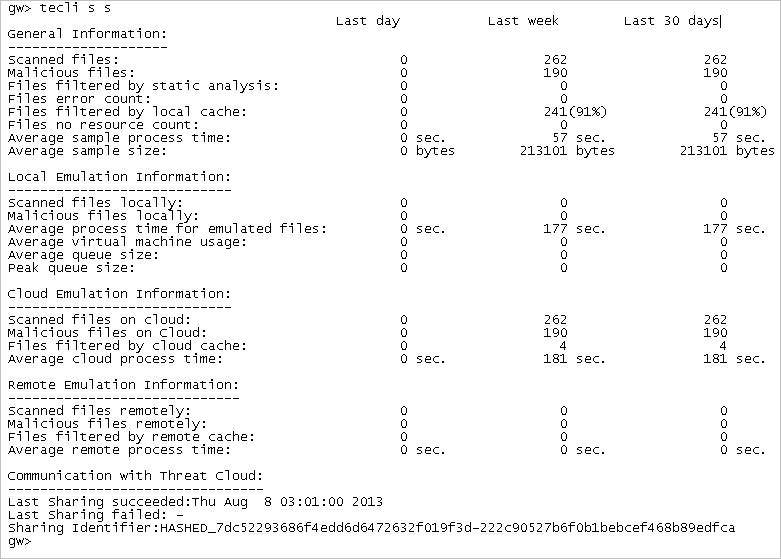
tecli show statistics
Description: Shows statistics to the Emulation appliance or Security Gateway.
Syntax: tecli s s or tecli show statistics
Results:
tecli show throughput
Description: Shows data about file emulation for each time interval.
Syntax: tecli show throughput {minute|hour|day|month}
Parameter
|
Description
|
minute
|
Shows how many files completed emulation for each minute
|
hour
|
Shows how many files completed emulation for each hour
|
day
|
Shows how many files completed emulation for each day
|
month
|
Shows how many files completed emulation for each month
|
Example:
tecli s t mi or tecli show throughput minute
tecli s t mo or tecli show throughput month
tecli show unit
Description: Shows all the parts of file emulation:
- Prepare
- Processing
- Finalizing
The output shows the number of files for each task in the emulation part.
Syntax: tecli u a or tecli show unit all
Results:
# tecli s u a
[prepare]
- system state (15)
- policy (15)
- file (1)
- contract (1)
- cache inquirer (1)
[processing]
- duplicate (1)
- static analysis (1)
- emulator (1)
- cloud emulation (1)
- remote emulation (1)
[finalizing]
- forensics (15)
- cache updater (15)
- threat cloud sharing (15)
- threat cloud statistics (15)
- file saver (15)
- logger (15)
- local filter counter (15)
|
Troubleshooting Threat Emulation
Using MTA with ClusterXL
When you enable MTA with a ClusterXL deployment, make sure that the standby cluster member is also able to connect to one or more of the next hops. If not, it is possible that when there is a failover to the standby member, emails in the MTA do not go to their destination.
Configuring Postfix for MTA
The Check Point MTA uses Postfix, and you can add custom user-defined Postfix options (http://www.postfix.org/postconf.5.html).
To add Postfix options:
- From the Security Gateway CLI, create the file
$FWDIR/conf/mta_postfix_options.cf - Edit the file and add the definitions.
- Save the file.
- Install the Threat Prevention policy.
Problems with Email Emulation
If you are blocking SMTP traffic with the Prevent action, we recommend that you enable MTA on the Security Gateway. If you do not enable the MTA, it is possible that emails are dropped and do not reach the mail server.
|
|

