Devices
The Devices page shows information about the device assets in your account and the details of related users, incidents and Identity Provider (IdP) groups.
To view the Devices page, access the XDR![]() Extended Detection & Response Administrator Portal and click Assets > Devices. By default, it shows details of devices whose Last activity date is within the past seven days.
Extended Detection & Response Administrator Portal and click Assets > Devices. By default, it shows details of devices whose Last activity date is within the past seven days.

Devices by Priority
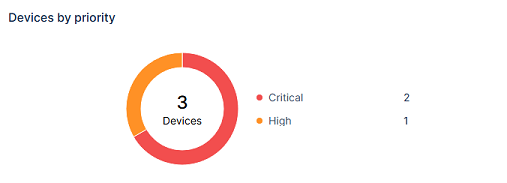
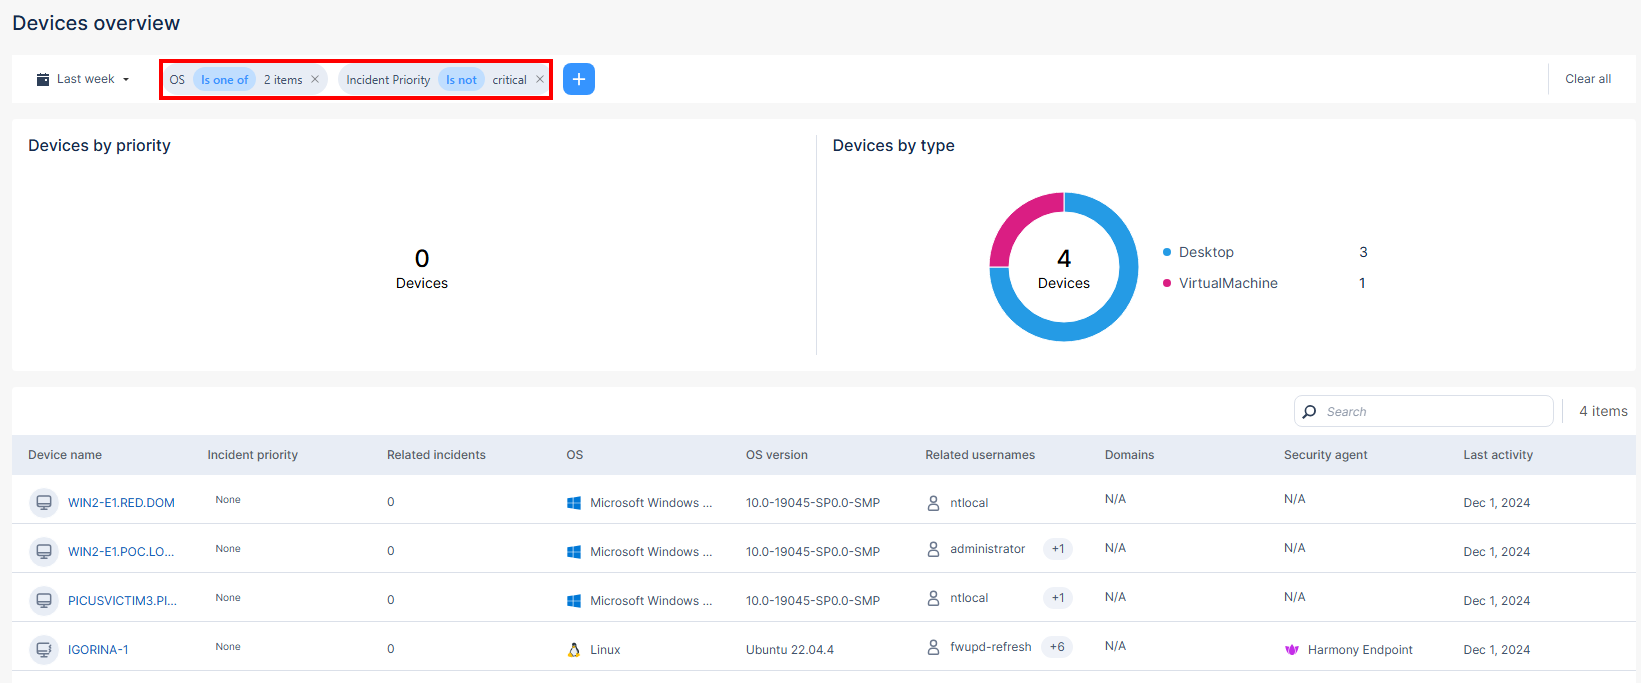
The Devices by priority widget shows the number of devices based on the priority level of the incidents they are involved in, within the selected time period.
To filter the Devices overview page according to a specific priority level, click the relevant section on the pie chart. The system filters the page based on your selection and adds this filter to the Filter list.

Devices by Type

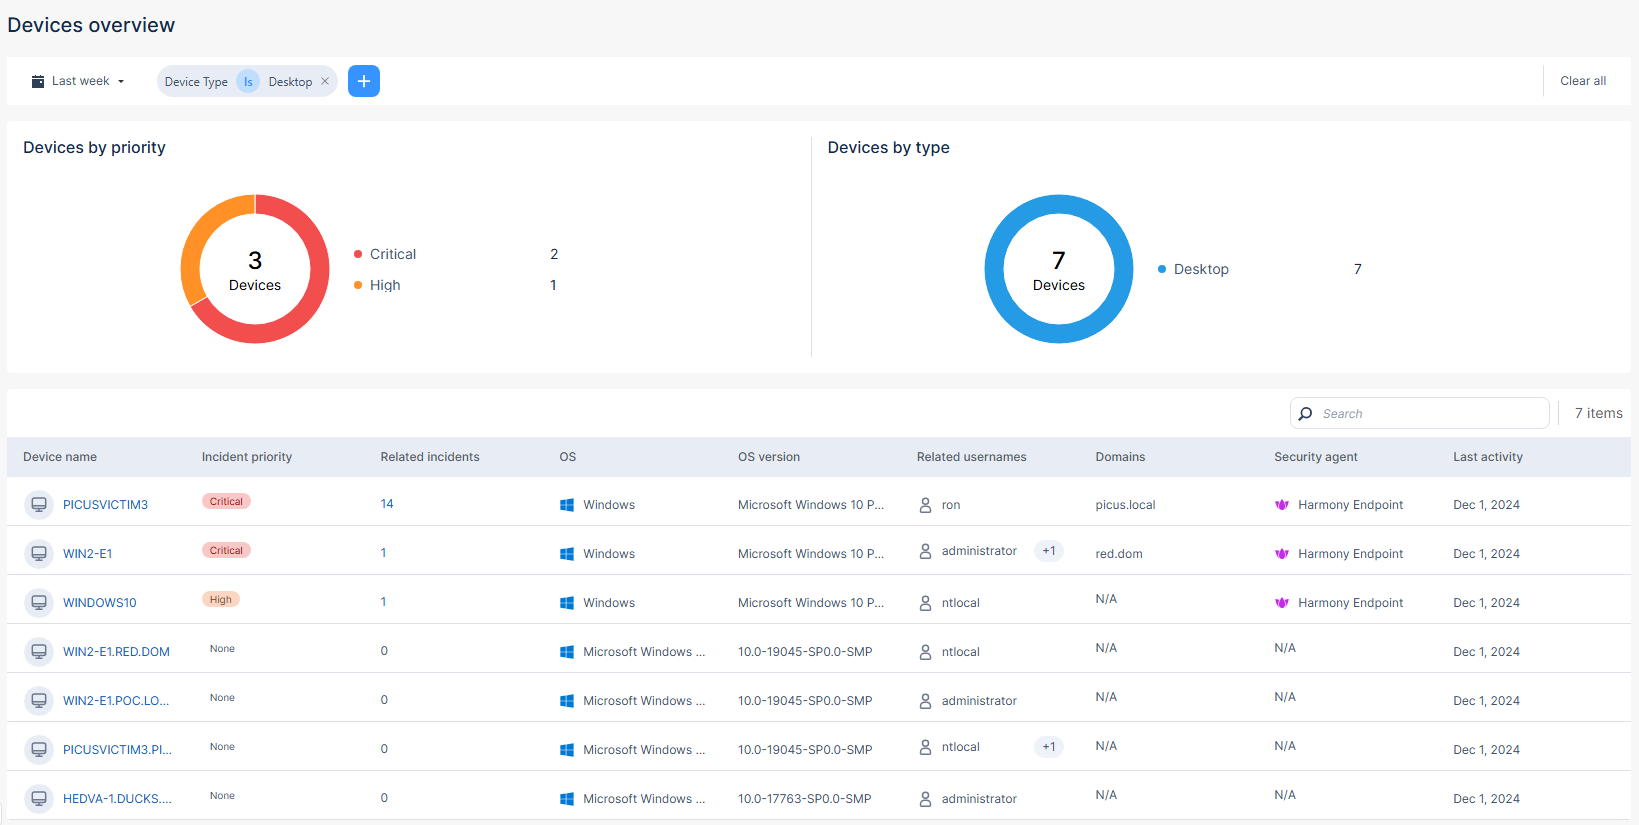
The Devices by type widget shows the total number of devices and the statistics of device types, within the selected time period.
To view the information of devices in a specific device type, click the relevant section on the pie chart. The system filters the page based on your selection and adds this filter to the Filter list.
Example:
For the statistics displayed above, to view information about the seven desktop devices, click the blue section.
Devices Table
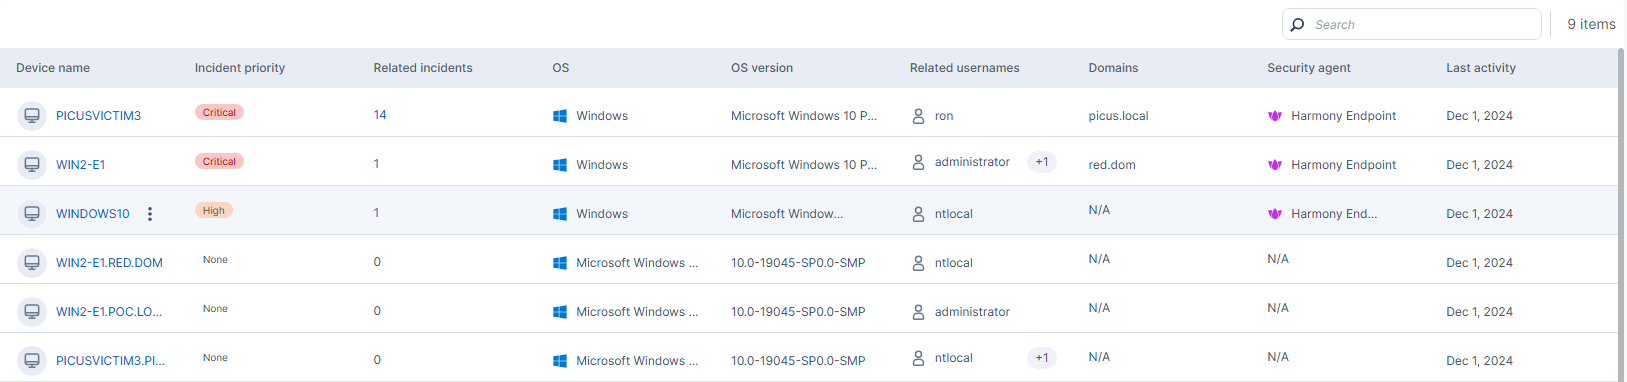
The Devices table is sorted by the priority of incidents related to the devices. It shows:
|
Item |
Description |
||
|---|---|---|---|
|
Device name |
Name of the device. |
||
|
Incidents priority |
Highest priority level among all the related incidents. |
||
|
Related incidents |
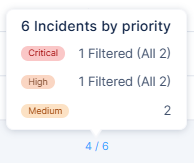
Number of incidents in which the device is involved. Hover over the count to view the number of the filtered incidents (if applicable) and the total number of incidents.
To view the incidents details, click the count. The Incidents page appears. |
||
|
OS |
Operating System on the device. |
||
|
OS version |
Operating System version. |
||
|
Related usernames |
Users who have used the device. |
||
|
Domains |
Domains accessed on the device. |
||
|
Security agent |
Security agent running on the device. |
||
|
Last activity |
Date of last activity on the device. |
To sort the table, click the ![]() icon in the Incidents priority column.
icon in the Incidents priority column.
To search for a specific device in the table, enter the device name in the Search field.
Filtering the Devices Page
You can filter the information on the Devices overview page for different time periods. The system shows information of devices whose Last activity time is within the selected time period.

Adding Filters
To add a new filter:
-
Click + Add Filter.

-
Enter these details:
-
Field - Select the device field.
-
Operator - Select the operator to be applied.
-
Value - Select the value of the device field.
-
-
Click Save.

Note - You can add multiple filters.
The system updates the Devices overview page based on all the active filters.
|
|
Note - You can define the filters below to specify the incidents to be considered to determine the Incident priority and Related incidents:
|

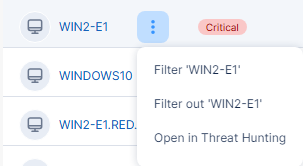
Filter In and Filter Out in Devices Table
You can filter the Devices overview page by either including (Filter) or excluding (Filter out) specific device fields in the Devices table. To do that, hover over the field and click the  icon and then select the required option.

Device Threat Hunting Details
To view the Threat Hunting details for the device:
-
Hover over the device name and click the
icon. -
Click Open in Threat Hunting.
The Threat Hunting page appears and displays the Threat Hunting details for the device.
Device - Related Users, Incidents and IdP Groups
To view the users, incidents and Identity Provider (IdP) groups related to a device, click the device name in Devices table. The system shows:
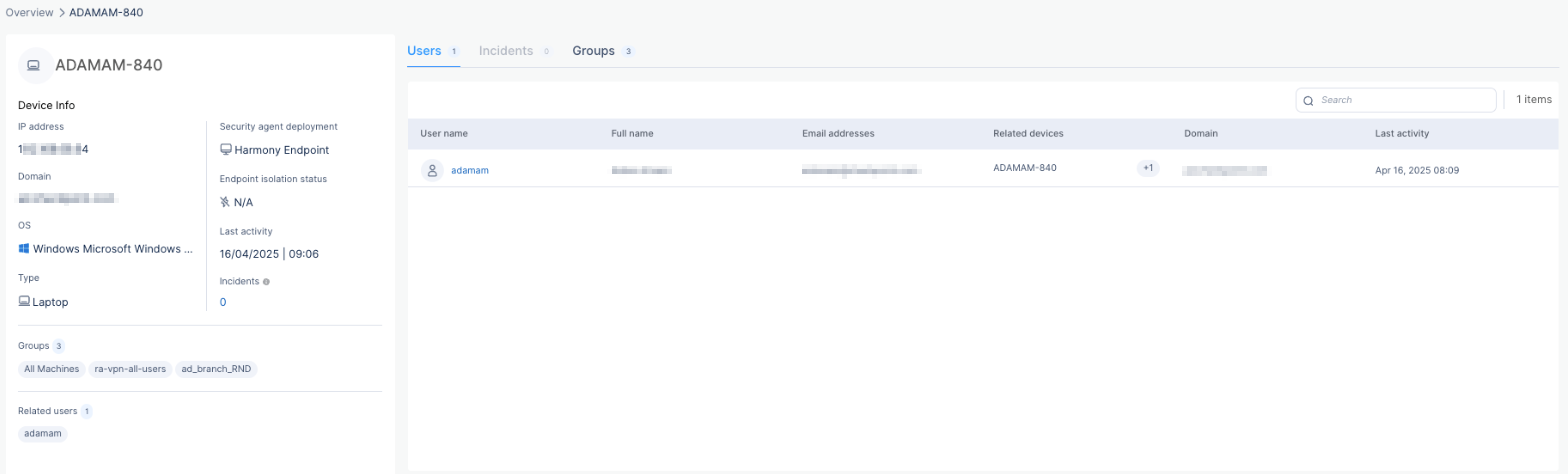
Device Details
The Device Info section displays the device information.
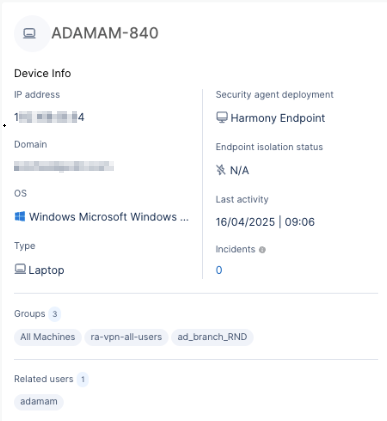
The Device Info section shows:
|
Item |
Description |
|---|---|
|
IP address |
IP address of the device. |
|
Domain |
Domain accessed on the device. |
|
OS |
Operation System on the device. |
|
Type |
Type of the device. |
|
Security agent deployment |
Security agent running on the device. |
|
Endpoint isolation status |
Shows whether endpoint was isolated (disconnected from network). |
|
Last activity |
Date and time of last activity on the device. |
|
Incidents |
Number of incidents in which the device was involved during the past 30 days. |
|
Groups |
The Identity Provider (IdP) groups in which the device is a member. |
|
Related users |
Users who have used the device. |
Devices - User Details
The Users tab displays the details of users who have used the device.
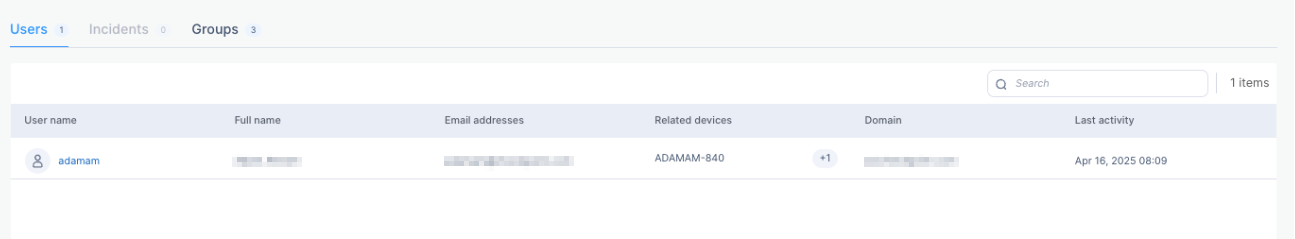
The Users table shows:
|
Item |
Description |
|---|---|
|
User name |
Name of the user in the events and alerts processed by XDR. |
|
Full name |
Full name of the user. |
|
Email addresses |
Email address(es) of the user. |
|
Related devices |
Devices used by the user. |
|
Domain |
Domain(s) accessed by the user. |
|
Last activity |
Date of last activity by the user. |
To view more information about a user, click the user name.
Devices - Incident Details
The Incidents tab displays the incidents in which the device was involved.
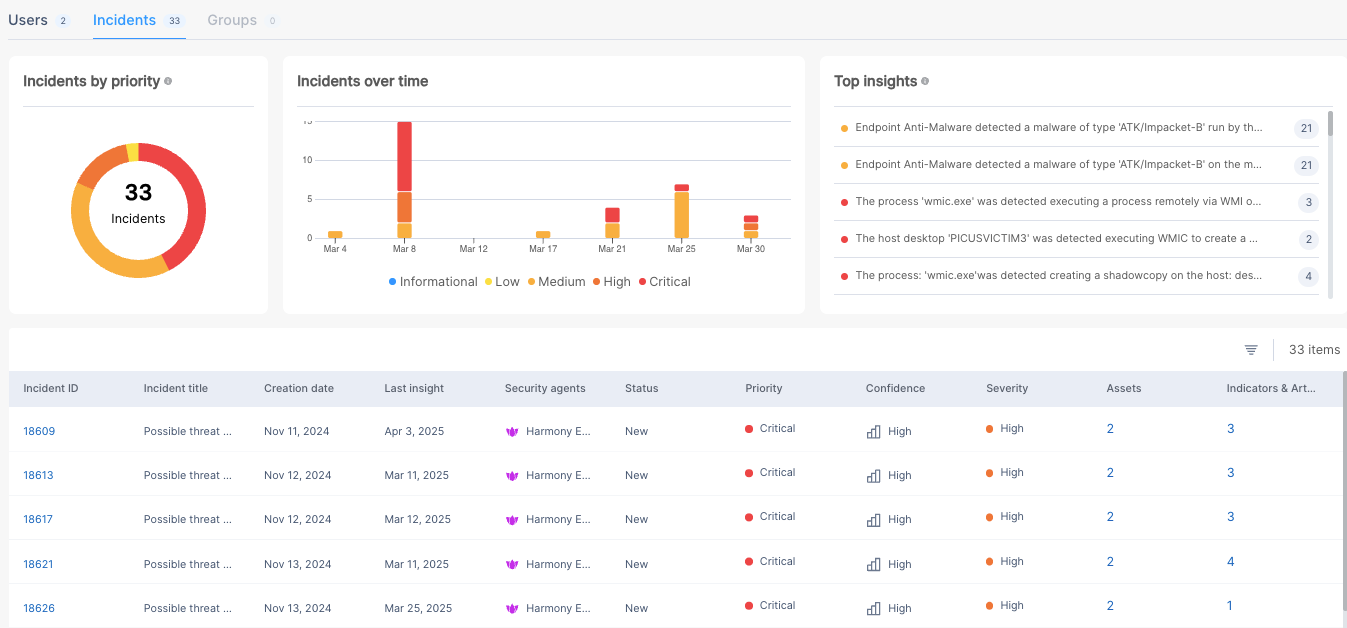
The Incident tab shows:
-
Incidents by priority - Number of incidents in which the device was involved during the past 30 days, based on their priority.
-
Incidents over time - Timeline of incidents during the past 30 days. Incidents are color-coded based on the priority levels.
-
Top insights - Top insights in which the device was involved during the past 30 days.
-
Incidents table:
Item
Description
Incident ID
ID of the incident.
To view more information about an incident, click the ID. The Incidents - Overview page appears.
Incident title
Title of the incident.
Creation date
Date on which the incident was generated.
Last insight
Date when the last insight was created for the incident.
Security agents
Security agent(s) running on the device
Status
Status of the incident.
Priority
Priority level of the incident.
Confidence
Confidence level of the security event detection.
Severity
Severity level of the incident.
Assets
Number of affected assets in the incident.
To view the asset details, click the count link. The Incidents - Affected Assets page appears.
Indicators & Artifacts
Number of indicators and artifacts involved in the incident.
To view more details on the indicators and artifacts, click the count link. The Incidents - Indicators & Artifacts page appears.
To filter the Incidents table, click the
 icon.
icon.
Devices - Group Details
The Groups tab displays the Identity Provider (IdP) groups in which the device is a member. Each group card displays the number of devices in that IdP group.
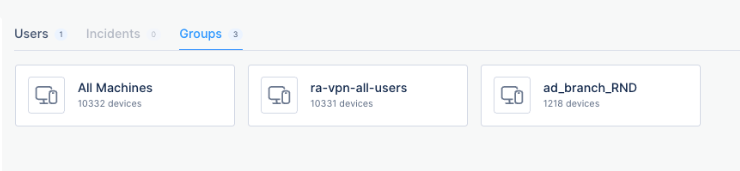
To view the details of devices in an IdP group, click the group card. The system displays the Devices table for that IdP group at the bottom of the page.
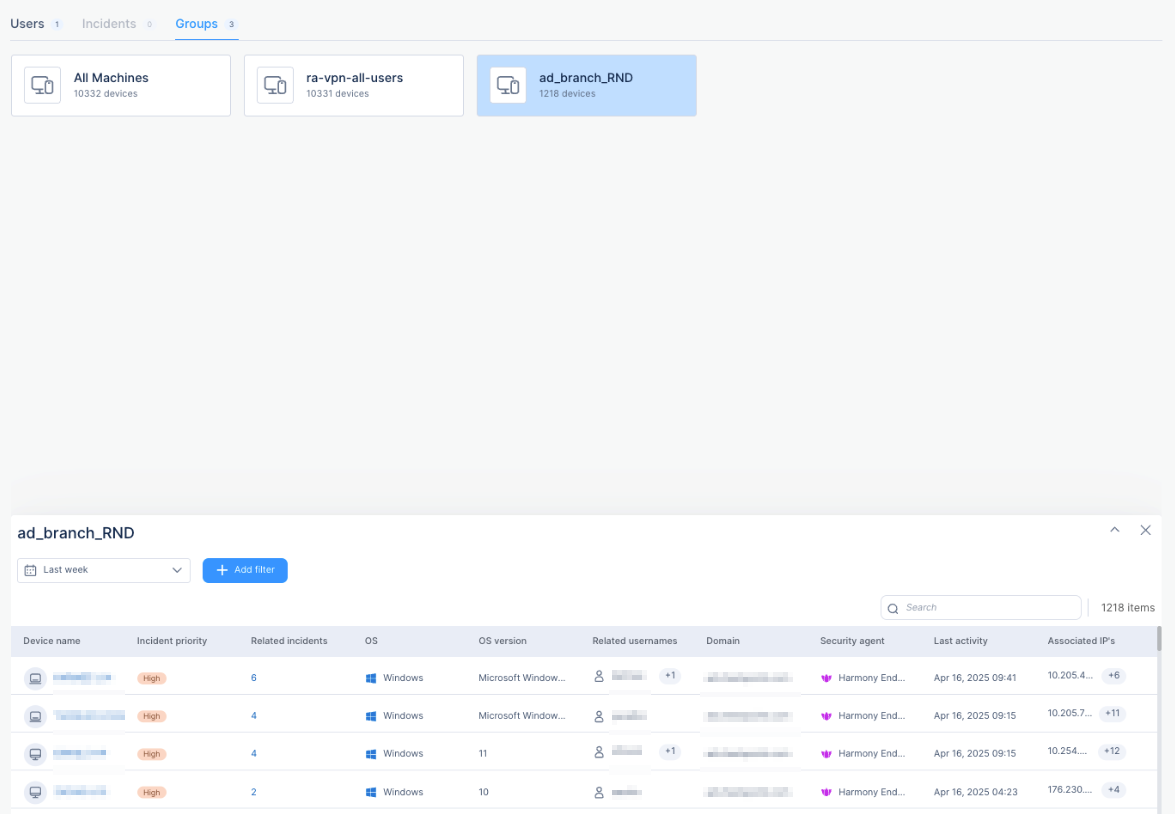
By default, it shows details of devices whose Last activity date is within the past seven days.
To filter the Devices table, see Filtering the Devices Page.