Incidents
An incident is a collection of events from one or more products that together represent an attack story. Check Point XDR![]() Extended Detection & Response (formerly Infinity XDR/XPR
Extended Detection & Response (formerly Infinity XDR/XPR![]() Extended Prevention & Response) utilizes ThreatCloud's Artificial Intelligence (AI) and applies Machine Learning (ML) models to correlate between the events from on-boarded products (both benign and security events) into unified incidents. The incident's priority level is calculated based on the artifacts of the incident, including the confidence and severity levels of the detection. Incidents are actionable with prevention steps that can be taken within the XDR application.
Extended Prevention & Response) utilizes ThreatCloud's Artificial Intelligence (AI) and applies Machine Learning (ML) models to correlate between the events from on-boarded products (both benign and security events) into unified incidents. The incident's priority level is calculated based on the artifacts of the incident, including the confidence and severity levels of the detection. Incidents are actionable with prevention steps that can be taken within the XDR application.
The Incidents page shows the list of incidents and its details that includes:
-
Insights that triggered the incident and its timeline
-
Impacted assets and users
-
Indicators
-
Prevention history and recommended prevention actions. You can automate some of these actions. For more information, see Automations.
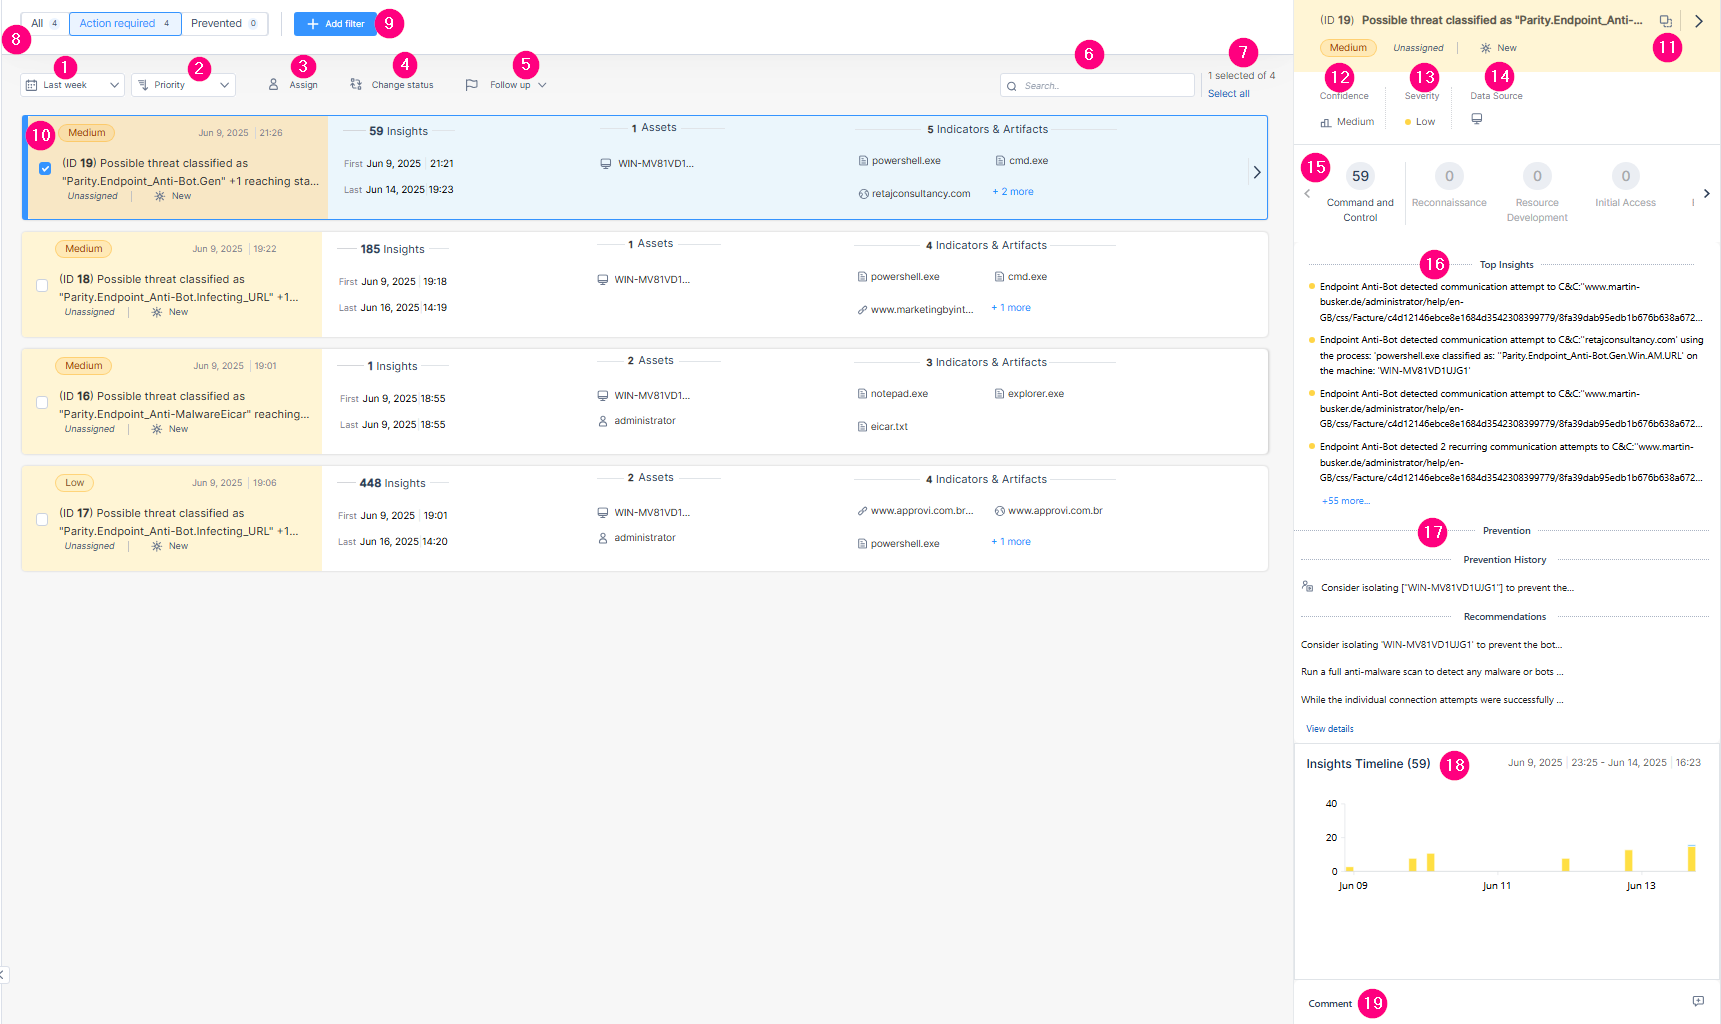
To view the Incidents page, access Check Point XDR and click Incidents > Incidents.
|
Legend |
Item |
Description |
||||||||||||||||||||||
|---|---|---|---|---|---|---|---|---|---|---|---|---|---|---|---|---|---|---|---|---|---|---|---|---|
|
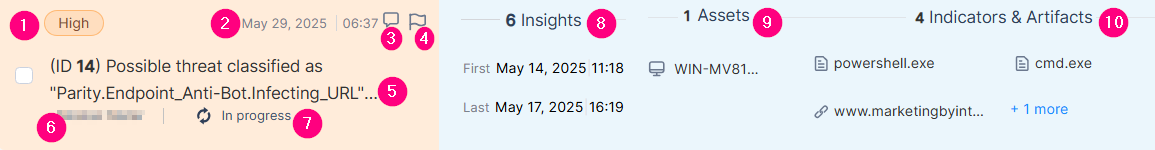
1 |
Time span |
Select the duration for which you want to view the incidents.
|
||||||||||||||||||||||
|
2 |
Sort by |
Select a criterion to sort the incidents.
|
||||||||||||||||||||||
|
3 |
Assign |
Assign a security expert to address the incident. |
||||||||||||||||||||||
|
4 |
Change the status of the incident.
|
|||||||||||||||||||||||
|
5 |
Follow up |
Indicates that the incident requires a follow-up.
|
||||||||||||||||||||||
|
6 |
Search |
Search for the an asset, incident or a user. |
||||||||||||||||||||||
|
7 |
Select all |
Select or clear all incidents. |
||||||||||||||||||||||
|
8 |
Filters |
Filter the incidents by:
|
||||||||||||||||||||||
|
9 |
|
Allows you to filter the incident list. To add a new filter:
You can filter the incidents by:
|
||||||||||||||||||||||
|
10 |
Incident |
Shows incident details.
|
||||||||||||||||||||||
|
11 |
|
Opens the incident Incidents - Overview page in a new tab. |
||||||||||||||||||||||
|
12 |
Confidence |
Confidence level of the detection:
|
||||||||||||||||||||||
|
13 |
Severity |
Priority of the incident:
|
||||||||||||||||||||||
|
14 |
Source |
The source of the events correlated into the incident.
|
||||||||||||||||||||||
|
15 |
MITRE ATT&CK |
MITRE ATT&CK tactics and techniques involved in the incident. The numbers represent the number of insights related to each tactic. Opens the Incidents - Insights & Forensics page that shows the related insights. |
||||||||||||||||||||||
|
16 |
Top Insights |
Top insights for the incident. |
||||||||||||||||||||||
|
17 |
Prevention |
Lists prevention actions taken and those that are recommended to be taken. |
||||||||||||||||||||||
|
18 |
Insights Timeline |
Shows the timeline of insights and the duration between the first and the last insight. |
||||||||||||||||||||||
|
19 |
Comments |
Shows the comments added for the incident. Click |


The Intelligence widget card displays the latest intelligence information about the indicator/artifact. The card's color reflects the severity level of the indicator/artifact.
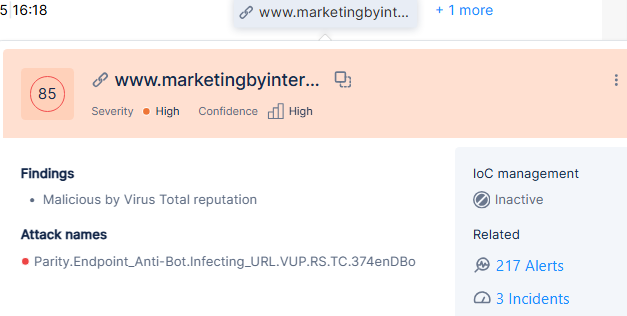
The card displays these details:
-
Indicator
 A malicious artifact, such as domain, URL, IP address, and files./artifact value
 -
XDR score which indicates the overall threat level
-
Severity level
-
Confidence level
-
Findings - Findings from the XDR validation engines.
-
Attack names - Name of attacks in which the indicator/artifact was involved.
-
General information based on the indicator/artifact type and the third-party threat intelligence verdict.
-
Status of the indicator in IOC Management.
-
Related info:
-
Number of related alerts - Click the link to view the Alerts page filtered by the specific indicator.
-
Number of related incidents - Click the link to view the Incidents page filtered by the specific indicator.
-
|
|
Note - If the indicator/artifact information was updated after the incident was created, the card displays the message Information updated since initial analysis at the top right. |
Click the  icon on the card to perform more actions on the indicator/artifact.
