Installation and Configuration
Check Point Data Loss Prevention is a Software Blade. It needs connectivity to a Security Management Server and a SmartDashboard. A Check Point gateway or a DLP-1 appliance is necessary for DLP.
In a dedicated DLP gateway deployment, Check Point recommends that you have a protecting Security Gateway in front of the DLP gateway.
The environment must include a DNS.

|
Important - Before installing DLP, we recommend that you review the requirements and supported platforms for DLP in the R76 Release Notes.
|
DLP Supported Platforms
Before installing or configuring your DLP gateway, make sure that it agrees with the platform requirements for your deployment in the R76 Release Notes.
Installing the DLP gateway
For instructions on how to install and do the initial configuration of the DLP gateway, see the R76 Installation and Upgrade Guide.
DLP Software Blade Trial License
The DLP Software Blade has a 30 day trial license.
To activate the trial license:
- Select the DLP Software Blade in SmartDashboard, in the gateway object.
- Install the policy on the DLP gateway.
During the trial period, when you install a policy on the DLP gateway, a warning message shows how many days remain until the trial license expires.
After the trial period, you must install a full DLP Software Blade license. If you do not, the DLP Software Blade stops working, and a policy cannot be installed on the DLP gateway. You must unselect the DLP Software Blade, and then you can install a policy on the gateway.
SmartDashboard Toolbar
You can use the SmartDashboard toolbar to do these actions:
Icon
|
Description
|

|
Open the SmartDashboard menu. When instructed to select menu options, click this button to show the menu.
For example, if you are instructed to select > , click this button to open the Manage menu and then select the option.
|

|
Save current policy and all system objects.
|

|
Open a policy package, which is a collection of Policies saved together with the same name.
|

|
Refresh policy from the Security Management Server.
|

|
Open the Database Revision Control window.
|

|
Change global properties.
|

|
Verify Rule Base consistency.
|

|
Install the policy on Security Gateways or VSX Gateways.
|

|
Open SmartConsoles.
|
Configuring a DLP Gateway or Security Cluster
You can enable the DLP Software Blade as one of the Software Blades on a Security Gateway. This is known as an integrated DLP deployment. In R75 and higher, you can also enable a DLP Software Blade on a ClusterXL in High Availability mode or Full High Availability mode on a UTM-1 appliance or 2012 Appliance models. In a dedicated DLP gateway, the Data Loss Prevention Software Blade is enabled on a gateway (or a ClusterXL Security Cluster) and no other Network Security Software Blade is enabled.

|
Note - The DLP Software Blade (as a dedicated gateway or in an integrated Security Gateway) can work as part of a ClusterXL Load Sharing cluster only when the policy contains DLP rules that only use the Detect action or Prevent action. Other DLP actions are not supported for ClusterXL Load Sharing.
|
In version R75.20 and higher, you can also configure a ClusterXL High Availability cluster of dedicated DLP-1 appliances.
|
Important - A dedicated DLP gateway does not enforce the Firewall Policy, Stateful Inspection, anti-spoofing or NAT. Check Point recommends that you place it behind a protecting Security Gateway or firewall.
|
In a DLP gateway cluster, synchronization happens every two minutes. Therefore, if there is a failover, the new active member may not be aware of DLP incidents that happened in the two minutes since the failover.
To configure a DLP-1 appliance, see the DLP-1 Getting Started Guide.
Configuring Integrated Deployments
In an integrated deployment you can:
- Enable the DLP blade on an existing Security Gateway or Security Cluster.
- Configure a new Security Gateway or cluster and enable the DLP blade on it.
To enable DLP on an existing Security Gateway or cluster:
- Open SmartDashboard.
- Edit the Security Gateway or Security Cluster object.
- For a Security Cluster:
In the page, select mode or . Note that you can use Load Sharing if the DLP rules only use the Detect action.
- In the page, in the area, enable the Software Blade.
|
Note - On a Security Cluster, this enables the DLP blade on every cluster member.
|
The opens.
- Complete the .
To configure a new DLP gateway or Security Cluster:
- Open SmartDashboard.
- To configure a Security Gateway:
- Open the page of the gateway.
- For a new gateway object only: Click and initialize SIC.
- To configure a Security Cluster:
- Edit the Security Cluster object
- Configure the Security Cluster.
- In the page, select mode or . Note that you can use Load Sharing if the DLP rules only use the Detect action.
- In the page, in the area, select the , and .
Make sure the selections comply with the platform requirements for your deployment in the R76 Release Notes.
- In the area, enable the Software Blade.
|
Note - On a Security Cluster, this enables the DLP blade on every cluster member.
|
The opens.
- Complete the .
Configuring Dedicated Deployments
These are the configuration options in a dedicated deployment environment:
- Dedicated DLP gateway or cluster on an existing Security Gateway or Security Cluster.
- Dedicated DLP gateway or cluster on a locally managed DLP-1 appliance.
- Dedicated DLP gateway or cluster on a centrally managed DLP-1 appliance.
To configure a dedicated DLP gateway on an existing Security Gateway or Security Cluster:
- Configure an existing Security Gateway or cluster as a DLP gateway or Security Cluster.
- Deselect the Firewall Software Blade, if it is selected.
When you clear the Firewall Software Blade, a warning message shows.
You are about to turn off the Firewall blade, with only the DLP blade left on.
Therefore, this Security Gateway will not enforce the security policy.
It is recommended to place this Security Gateway behind a firewall.
Are you sure you want to continue?
- Click .
To configure a dedicated DLP gateway or cluster on a locally managed DLP-1 appliance:
- Open SmartDashboard.
For a locally managed gateway, the Data Loss Prevention Wizard opens.
For a locally managed cluster, the DLP-1 Cluster Wizard opens.
- Complete the Data Loss Prevention Wizard or DLP-1 Cluster Wizard.
To configure a dedicated DLP gateway or cluster on a centrally managed DLP-1 appliance:
- Open SmartDashboard on the Security Management Server that manages the DLP-1 appliance.
- Create a new DLP-1 Security Gateway or Security Cluster object from > > > or .
- Complete the wizard.
DLP-1 Security Cluster Wizard
Prerequisites
Before you define a DLP Security Cluster:
- Make sure you have defined all of the network interfaces in use for each of the DLP-1 appliances. The interfaces must be defined within the same subnet. To make sure they are defined correctly, use the appliance WebUI.
- Make sure a cable is connected between the two SYNC ports on the appliances. It is not necessary to assign them IP addresses. If you do assign IP addresses, make sure the SYNC interfaces use the same subnet.
- Make sure you have the activation key that was set for appliance defined as the secondary member during initial configuration. This key is used to establish trust between the primary member and secondary member.
Configuring a Locally Managed DLP-1 Security Cluster
Use the Security Cluster wizard in SmartDashboard to create a cluster for two DLP-1 gateways. With the wizard you set the name of the cluster object, the name and IP address of the secondary cluster member and configure the topology for the gateways' interfaces.
There is a Cluster Topology page for each of the network interfaces that have been configured for the cluster members. In this page you define whether a network interface participates in the cluster. If the interface is part of the cluster, you must define a virtual IP address for the cluster. This IP address is visible to the network and makes sure that failover events are transparent to all hosts in the network. If the interface is not part of the cluster, the interface is a interface.
To configure a locally managed DLP-1 Security Cluster:
- Log in to SmartDashboard using your Security Management credentials.
The Security Cluster wizard opens.
- Click .
The Cluster General Properties page opens.
- Enter a name for the cluster.
- Click .
The Cluster Secondary Member page opens.
- In and enter a name and the IP address of the appliance you configured as the secondary member.
- In , enter the same activation key that was set for the secondary member in the configuration wizard and confirm it. The activation key is used by the primary member to establish initial trust with the secondary member. Once established, trust is based on security certificates.
- To create a Security Cluster with only a primary member, select .
- Click .
The Cluster Topology page opens.
- To set the interface to be part of the cluster, select and enter a and . If you do not want the interface to be part of the cluster, make sure the checkbox is cleared.
- Click .
- Repeat steps 9-10 for each defined interface.
- In the Cluster Definition Wizard Complete page, click .
The Data Loss Prevention Wizard opens.
- Complete the Data Loss Prevention Wizard.
Data Loss Prevention Wizard
DLP Blade Wizard Options
Completing the Wizard
After you complete the wizard for a DLP gateway of any platform, enable the Software Blade and install the policy.
- Make sure that the Software Blade is enabled.
- Review the topology of the DLP gateway.
DLP by default scans traffic from internal networks to external networks, so you must properly define the DLP gateway interfaces as or . You can do this when you define in the tab of SmartDashboard.
- Run on the DLP gateway only:
- From the menu of SmartDashboard, click and select .
- In the window, select the DLP Gateways.
On a dedicated DLP gateway, only the DLP Policy is installed. This is not a security policy. Make sure you have another Security Gateway in the environment to enforce the Security Policy.
Configuring a DLP Gateway in Bridge Mode
When setting up a dedicated DLP gateway, Check Point recommends that you configure the DLP gateway as a bridge, so that the DLP gateway is transparent to network routing.
You can deploy DLP in bridge mode, with the requirements described in this section for routing, IP address, and VLAN trunks.
Note the current limitations:
- In an environment with more than one bridge interface, the DLP gateway must not see the same traffic twice on the different interfaces. The traffic must not run from one bridged segment to another.
- Inter-bridge routing is not supported. This includes inter-VLAN routing.
- If the bridge interface is connected to a VLAN trunk, all VLANs will be scanned by DLP. You cannot exclude specific VLANs.
- Routing from the bridge interface to a Layer3 interface, and from Layer3 interface to the bridge, is not supported. Traffic on the bridge interface must run through the bridge or be designated to the DLP gateway.
- From R76, the DLP gateway in bridge mode can be in a cluster, in High Availability mode. But the action and the UserCheck Agent are not supported.
- If the DLP gateway in bridge mode is behind a cluster, the cluster must be in High Availability mode.
- Bond High Availability (HA) or Bond Load Sharing (LS) (including Link Aggregation) are not supported in combination with bridge interfaces.
Required Routing in Bridge Mode
There must be routes between the DLP gateway and the required servers:
- Security Management Server
- DNS server
- Mail server, if an SMTP Relay server is configured to work with the gateway
- Active Directory or LDAP server, if configured to work with the gateway
There must be a default route. If this is not a valid route, it must reach a server that answers ARP requests.
If UserCheck is enabled, configure routing between the DLP gateway and the users network.
Configuring Bridge IP Address
The bridge interface can be configured without an IP address, if another interface is configured on the gateway that will be used to reach the UserCheck client and the DLP Portal.
If you do add an IP address to the bridge interface after the Security Gateways are started, run the cpstop cpstart
In Gaia, you must configure an IP address on the bridge interface.
Required VLAN Trunk Interfaces
- A single bridge interface must be configured to bind the DLP gateway for a VLAN trunk.
- If an IP address is configured on the bridge, the IP address must not belong to any of the networks going through the bridge. Users must have routes that run traffic through the bridge interface of the DLP gateway. The gateway handles this traffic and answers to the same VLAN of the original traffic.
- In a VLAN trunk interface, another interface must be configured as the management interface for the required bridge routing.
Configuring Active Directory and LDAP for DLP
You can configure the DLP gateway to access a Microsoft Active Directory or LDAP server to:
- Authenticate to the DLP Portal using Active Directory credentials
- Authenticate to UserCheck using Active Directory credentials
- Define Active Directory or LDAP groups to be used in the DLP policy
- Define the object
If you run the wizard from a computer in the Active Directory domain, the Data Loss Prevention Wizard will ask for your Active Directory credentials to create the LDAP account unit automatically. You can run the wizard again from a computer in the Active Directory domain to create the LDAP account unit.
To configure DLP to use Active Directory LDAP:
- Create the DLP gateway object in SmartDashboard from a computer that is a member of the Active Directory domain.
- Enter your Active Directory credentials in the Active Directory page.
You are not required to enter credentials with administrator privileges. We recommend that you create an Active Directory account that is dedicated for use by Check Point products to connect to Active Directory.
- When you complete the wizard, the LDAP account unit is created automatically.
If you have multiple Active Directory servers:
- Review the created account unit.
- Remove unnecessary servers.
- Assign appropriate priorities to the remaining servers.
The DLP Wizard will ask for Active Directory credentials only if no LDAP account unit exists. If you already have an LDAP account unit, the wizard will not ask for your credentials. To create the LDAP account unit from the DLP Wizard, delete the existing LDAP account unit and run the wizard again.
|
Note - If you configure the LDAP Account Unit manually, with the username and password authentication method, you must set the to .
|
If you need more LDAP account units, you can create the LDAP account unit manually. See the R76 Security Management Administration Guide.
Rerunning the Data Loss Prevention Wizard
If you run the DLP Wizard from a computer that is not part of the Active Directory domain, you can run it again from a computer in the Active Directory domain to create the LDAP account unit.
To run the Data Loss Prevention Wizard again:
- Open SmartDashboard.
- Edit the DLP gateway object.
- In the , deselect the Software Blade.
- Select the Software Blade.
The Data Loss Prevention Wizard starts.
Configuring a DLP Gateway for a Web Proxy
You can use a Web Proxy server or servers for HTTP and HTTPS traffic. If you want the DLP gateway to scan this traffic, you must configure the DLP gateway.
Configuring for a Web Proxy
Use these procedures if the proxy or proxies are between the DLP gateway and the Internet, or in a DMZ. If a proxy is in a DMZ, we recommend that you use the DLP gateway to scan the HTTP traffic between the user network and the proxy in the DMZ.
Configuring an R75 or higher DLP Gateway for Web Proxies
If you have one Web proxy server between the DLP gateway and the Internet, use either Procedure 1 or Procedure 2.
If you have more than one proxy between the DLP gateway and the Internet, use Procedure 2.
If you configure both Procedure 1 and Procedure 2, the DLP gateway drops HTTP and HTTPS traffic sent to any web proxy that is not specified in Procedure 1.
Procedure 1
- In SmartDashboard, edit the DLP gateway object and then open the page.
- Select Either for the gateway, or on the .
- Select .
- In the field, enter the IP address of the Web proxy server.
- In the field, enter the listening port of the Web proxy server.
- Click .
DLP only scans traffic to the specified web proxy.
Procedure 2
- In SmartDashboard, go to the and select the tab
- Edit the TCP service:
- Click
- Select , and choose HTTP.
- Click .
- In the DLP gateway object, select the page
- Select Either for the gateway, or on the .
- Make sure that is not selected.
- Click .
Configuring a Pre-R75 DLP Gateway for a Web Proxy
For a pre-R75 DLP gateway, if you have one Web proxy between the DLP gateway and the Internet, use Procedure 1.
If you have more than one Web proxy, put the DLP gateway between the proxies and the Internet.
Configuring for an Internal Web Proxy
If the DLP gateway is between the Web (HTTP) proxy server or servers and the Internet, use these procedures.
Configuring the DLP Gateway for an Internal Web Proxy
- In SmartDashboard, edit the DLP gateway object and open the page.
- Select Either for the gateway, or on the .
- Click .
- In the tab, open the page.
- In the section, make sure that the Web Proxy and the user networks are included in My Organization.
Configuring the Proxy Server to Allow UserCheck Notifications
If the DLP gateway is between the Web proxy server or servers and the Internet, all packets through the DLP gateway have the source IP address of the proxy server. Therefore, the DLP gateway cannot know the real IP address of the client that opens the original connection to the proxy server. This means that the DLP gateway cannot identify the user, and therefore cannot:
- Send UserCheck client notifications to users about incidents.
- Log the source IP address of the user.
To make it possible for the DLP gateway to identify the user, you must configure the proxy server to reveal the IP address of the client. The proxy server does this by adding the x-forwarded-for
Configuring Proxy Settings After Management Upgrade
For a Security Management server that is upgraded from R70 and lower, traffic that passes through a DLP gateway to a web proxy server contains the gateway's IP as the source address instead of the original client IP address. For new installations and for installations that were upgraded from R71, the original client IP address is used.
If the traffic that contains the gateway's IP as source address reaches another Security Gateway which either logs traffic or enforces access based on identity, the source IP address does not represent the user's IP address.
To use the client's IP address as source address for the traffic leaving the DLP gateway:
- On the SmartDashboard computer, run:
C:\Program Files\CheckPoint\SmartConsole\R76\PROGRAM\GuiDBedit.exe
- Log in with your SmartDashboard credentials.
- In the left pane, select > > .
- In the right pane, select the DLP Gateway.
- In the bottom pane, in the Field Name column, select .
- Change the
http_unfold_proxy_connstrue
Mail Server Required Configuration
DLP rules have different action settings.
Action
|
Description
|
Detect
|
The data transmission event is logged in SmartView Tracker. Administrators with permission can view the data that was sent.
The traffic is passed.
|
Inform User
|
The transmission is passed, but the incident is logged and the user is notified.
|
Ask User
|
The transmission is held until the user verifies that it should be sent. A notification, usually with a remediation link to the Self Incident Handling portal, is sent to the user. The user decides whether the transmission should be completed or not. The decision is logged and can be viewed under the User Actions category in SmartView Tracker. Administrators that have full permissions or the View/Release/Discard DLP messages permission can also decide if to send or discard the message.
|
Prevent
|
The data transmission is blocked.
|
Watermark
|
Tracks outgoing Microsoft Office documents (Word, Excel, or PowerPoint files from Office 2007 and higher) by adding visible watermarks or invisible encrypted text.
|
When you set Data Owners to be notified, a mail server becomes a required component of the DLP system.
The DLP gateway sends mail notifications to users and Data Owners, therefore it is necessary for the gateway to access the mail server as a client.
|
Important -
- The mail server must be set to act as a mail relay. This lets users or administrators with permissions to release (Send) emails that DLP captured and quarantined on rules.
- You must configure the mail server to trust anonymous SMTP connections from the DLP gateway. Alternatively, if your environment requires it, configure your mail relay server to trust authenticated SMTP connections from the DLP gateway.
|
Configuring the Mail Relay
Configuring the Mail Relay for Anonymous SMTP Connections
- In SmartDashboard:
Configure the mail server without authentication in the Data Loss Prevention Wizard. Alternatively:
- In the tab, expand and click
- Select .
- Select the mail server. If the mail server object does not exist, create it.
- On the mail server itself:
Configure the mail relay to accept anonymous connections from the DLP gateway. For details, consult the vendor documentation. For example, on Microsoft Exchange Servers, configure the permissions of the default receive connector (or other relevant connector that handles SMTP traffic) for anonymous users.
Configuring the Mail Server object for Authenticated SMTP Connections
- In SmartDashboard:
Configure the mail server with authentication in the Data Loss Prevention Wizard. Alternatively:
In the tab, expand and select .
- Select
- Select a mail server from the list.
If the mail server does not exist, create it.
- Click
- Select the server from the list.
- Select .
- Enter the authentication credentials: user name and password.
- On the mail server itself:
Configure the mail server to accept authenticated connections from the DLP gateway. For details, consult the vendor documentation. For example, on Microsoft Exchange Servers, configure the default receive connector (or other relevant connector that handles SMTP traffic) for basic authentication.
Configuring a Dedicated DLP gateway and Relay on DMZ
A specific configuration is required for a dedicated DLP gateway if these are all true:
- The DLP gateway and the mail relay that handles SMTP traffic leaving the organization are in the DMZ zone.
- Use of this mail relay is one of the following:
- There is a mail server inside the internal network, such as Exchange, that relays its outgoing SMTP traffic through the mail relay.
- Users email clients are configured to work directly with the mail relay.
- The DLP Policy works only on SMTP.
If this is true, configure the DLP gateway to recognize the mail server as internal to My Organization and the relay in the DMZ as external.
To configure the DLP and Relay in the DMZ:
- Open the tab in SmartDashboard.
- Open .
- In the area, select and click .
The Networks and Hosts window opens.
- Click .
If the Internal Mail Server is already defined as a Check Point network object, select it from the list.
Otherwise, click and define it as a .
- Click .
- Repeat steps to add other Internal Mail Servers.
- If users email clients are configured to work directly with the mail relay that is located in the DMZ using SMTP, add their networks. Select user networks from the list (or click to define these networks) and then click .
- Run on the DLP gateway.
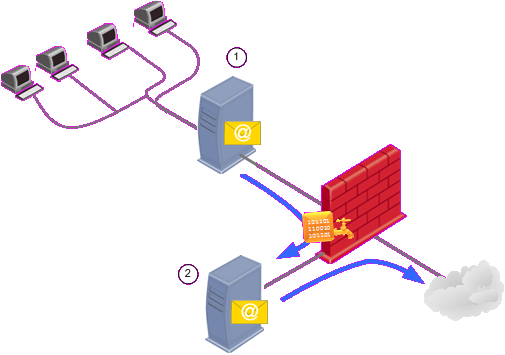
Recommended Deployment - DLP Gateway with Mail Relay
In the recommended deployment of a DLP gateway with a mail relay, the DLP gateway scans mails once, as they are sent from an internal mail server (such as Microsoft Exchange) (1) to a mail relay in the DMZ (2). Make sure that the DLP gateway does not scan mails as they pass from the mail relay to the target mail server in the Internet.
If you can deploy the internal mail relay behind a DMZ interface of the DLP gateway:
- Ensure that mails from the internal mail server (e.g. Microsoft Exchange) (1) arrive at the gateway via an internal Gateway interface:
In the page of the DLP gateway object, define the gateway interface that leads to the internal mail server as .
- Deploy the internal mail relay (2) behind a DMZ interface of the DLP gateway:
In the page of the DLP gateway object, define the gateway interface that leads to the Mail relay as I and also as .
- In the section of the page:
- Select
- Do not select
If you cannot deploy the internal mail relay behind a DMZ interface of the DLP gateway:
If the DLP gateway interface leading to the internal mail relay is internal, and you cannot deploy the internal mail relay behind a DMZ interface of the DLP gateway:
- In the section of the page, select
- Select the networks that include the internal mail server, but not including the relay server.
Workarounds for a Non-Recommended Mail Relay Deployment
A non-recommended deployment is to have the DLP gateway scan mails as they are sent from an internal mail relay that is in My Organization to the target mail server in the Internet. In this deployment, the DLP gateway communicates with the target mail servers on behalf of the mail relay. If the target mail server does not respond, some mail relays (such Mcafee IronMail, postfix 2.0 or earlier and qmail) will not try the next DNS MX record, and so will not try to resend the mail to another SMTP mail server in the same domain.
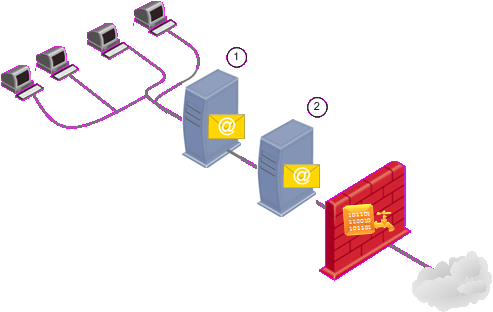
- The internal mail server (1) and the internal relay (2) are in My Organization
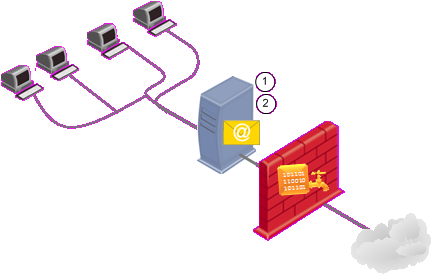
- The internal mail server (1)(2) is in My Organization, and there is no other internal mail relay
Why Some Mail Relays Will Not Resend Emails
If the mail relay does not succeed in sending an email because the target mail server does not respond, the mail relay resends the email to another SMTP server in the same domain. The relay does this by sending the mail to the next DNS MX record.
Most mail relays try the next MX record if the target is unreachable, or if the target server returns a 4xx SMTP error. However, other mail relays (such as Mcafee IronMail, postfix 2.0 or earlier and qmail) do not try the next MX if the target server returns a 4xx error. They will therefore not send the mail.
In these deployments, the DLP gateway communicates with mail servers in the internet on behalf of the mail relay. If the target mail server does not respond, the DLP gateway sends a 4xx response to the mail relay in behalf of the mail server. Therefore, if your mail relay does not try the next MX when the target server returns a 4xx error, the mail will not be sent.
Workarounds for the Non-Recommended Deployments
- Configure your internal mail relay to re-send when it receives a 4xx error from the target mail server.
- If you cannot configure your mail relay in this way, deploy the DLP gateway between two internal mail servers. For example, put the DLP gateway in the DMZ with the relay server.
- If you cannot apply these workarounds, see sk58960.
Untrusted Mail Relays and Microsoft Outlook
If Outlook does not trust the mail relay server, it fails to correctly render the and buttons in the violation notification email. The buttons render correctly only after the mail relay is trusted and a new email sent.
To avoid this issue, instruct users to add the mail relay address to Outlook's safe senders list.
TLS-Encrypted SMTP Connections
TLS-encrypted SMTP connections are not scanned by the DLP Software Blade. If an Exchange Server uses TLS to encrypt emails, you can use the Exchange Security Agent to inspect them.
Configuring Incident Log Handling
In version R75 and higher, DLP incident data is stored on the remote log server or Security Management Server that stores the DLP gateway logs. DLP incidents are only stored permanently (that is, until they expire) on the DLP gateway if no log server or Security Management Server is configured for the DLP gateway.
Incidents are stored at $FWDIR\log\blob
Because DLP incident data is stored on the log server, Check Point recommends that you tune your log server disk management setting for DLP incidents.
To configure disk management for DLP incidents:
- In SmartDashboard, edit the Log server or Security Management Server that manages DLP logs.
- In the page, select and enter a value.
This setting applies to DLP incidents and logs, and to all other logs. The default setting is 45 MBytes or 15%. When the free disk space becomes less than this limit, old DLP incidents and logs, and other logs are deleted to free up disk space.
- Open GuiDBedit:
- On the SmartDashboard computer, run
C:\Program Files\CheckPoint\SmartConsole\R76\PROGRAM\GuiDBedit.exe - Log in with your SmartDashboard credentials.
- In the left pane, select
- In the right pane, select the Log server or Security Management Server that manages DLP logs.
- In the bottom pane, in the column, find
- Configure these fields:
Field Name
|
Description
|
Default value
|
dlp_blob_delete_above_value_percentage
|
The maximum % of disk space that incidents are allowed to occupy.
|
20%
|
dlp_blob_delete_on_above
|
Whether or not to delete incidents if the incidents take up more disk space than dlp_blob_delete_above_value_percentage
truefalse
|
false
|
dlp_blob_delete_on_run_script
|
Whether or not to run a script before deleting incidents. For example, to copy the logs to a different computer before they are deleted.
truefalse
|
false
|
Configuring the Exchange Security Agent
Internal emails between Microsoft Exchange clients use a proprietary protocol for Exchange communication. This protocol is not supported by the DLP gateway. To scan internal emails between clients, you must install an Exchange Security Agent on the . The agent sends emails to the DLP gateway for inspection using the SMTP protocol encrypted with TLS. This requires connectivity between the Exchange server and the DLP gateway.
An Exchange Security Agent must be installed on each Exchange Server that passes traffic to the DLP gateway. Each agent is centrally managed through SmartDashboard and can only send emails to one DLP gateway.
If your organization uses Exchange servers for all of its emails, you can also use this setup for scanning all emails.
To use the Exchange Security Agent it is necessary to configure settings in SmartDashboard and on the Exchange server.
For more about using the Exchange Security Agent to examine internal emails, see some scenarios.
SmartDashboard Configuration
SmartDashboard configuration includes:
- Defining the Exchange Security Agent object in SmartDashboard.
- Using a wizard to:
- Set a one-time password that will be used to initiate trusted communication between the DLP gateway and the Exchange Security Agent
- Set the users/groups for which to send emails.
- Preparing and installing the securing policy.
To define the Exchange Security Agent:
- In SmartDashboard, open the Data Loss Prevention tab.
- Click .
- Click > .
The wizard opens.
- Click . There are four pages in the wizard:
- General
- Trusted Communication
- Inspection Scope
- Configuration Summary
Exchange Security Agent - General
Use the General page to enter information for the Exchange Security Agent.
- - Enter a name for the Exchange Security Agent.
- - Select the host object that represents the on which the Exchange Security Agent is installed. If necessary, click to create one.
- - You can select the user object that represents the administrator.
- - Select the DLP gateway object that the Exchange Security Agent will send emails to for inspection. If you use a name to represent the DLP gateway in the Exchange Security Agent on the Exchange server, make sure to use the same name as this object.
Click .
Exchange Security Agent - Trusted Communication
Use the Trusted Communication page to enter the one-time password used to initialize SIC (Secure Internal Communication) between the Exchange Security Agent and the enforcing DLP gateway. This step creates a security certificate that is then used by the Exchange Security Agent.
- - Enter the one-time password and confirm it. Make sure that the same one-time password is entered in the Trusted Communication window of the Exchange Security Agent snap-in on the .
Click .
Exchange Security Agent - Inspection Scope
Use the Inspection Scope window to define which emails to send for inspection. You can select all users or only specified users or user groups. It is recommended to start with specified users or user groups before inspecting all emails.
- - Define the Active directory, internal or LDAP users whose emails will be inspected.
|
Note - You can define users or groups for whom emails will not be sent for inspection in an list. You can also set a percentage of emails to inspect for the rest of the organization. This lets you gradually increase the inspection coverage of your organization's emails.
To define these options, edit the Exchange Security Agent in SmartDashboard and open the Inspection Scope page.
|
- - All emails will be sent from the Exchange Security Agent to the enforcing DLP gateway for inspection.
Click .
Exchange Security Agent - Configuration Summary
The window opens.
The next steps include:
- Installing the policy on the DLP gateway.
- Installing and configuring the Exchange Security Agent on the Exchange server. You can download the MSI for installing the agent from this window.
Exchange Server Configuration
After the Exchange Security Agent has been installed on the Exchange server, you must:
- Initialize trusted communication between the Check Point Exchange Security Agent and the Security Gateway.
- Start or stop the Exchange Security Agent that runs as an extension of the Microsoft Exchange Transport service.
- See Exchange Security Agent statistics.
- Monitor message status with the Message Tracking log.
- Configure when to bypass inspection of messages.
Initializing Trusted Communication
There are two possible communication states:
- is where trusted communication has not been established.
- is where the Exchange Security Agent has received the security certificate and can receive data securely from the Security Gateway.
To initialize trusted communication:
- On the Exchange server, open the Exchange Security Agent:
- In the Navigation pane, click .
- Click .
The Trusted Communication window opens.
- Enter information in these fields:
- - The same name or IP that is given to the DLP Security Gateway in SmartDashboard.
- - The same name that is set for the Exchange agent object in SmartDashboard.
- - Used only for establishing the initial trust. When trust is established, trust is based on security certificates. This password must be the same as the one time password defined for the Exchange Security Agent in SmartDashboard.
- Click to start the trusted communication procedure.
Starting the Exchange Security Agent
The Exchange Security Agent runs as an extension of the Microsoft Exchange Transport service. When you start or stop the agent. Each time you start or stop the agent, you restart the Microsoft Exchange Transport service.
After you click , messages are sent to the Security Gateway for DLP inspection. The messages sent are based on the users or groups defined for inspection.
To start the Exchange Security Agent:
Statistics
The Statistics page in the Exchange Security Agent shows performance statistics and the number of emails it handles and sends to the Security Gateway.
The graph you see in the window is the Windows Performance Monitor graph. It shows some of the Windows counters plus the CPExchangeAgent counters. Alternatively, you can use the Windows Performance Monitor and add the CPExchangeAgent counters.
Statistics shown:
- - The average latency in seconds of all email messages that go through the Exchange Security Agent.
- - The average latency in seconds of all email messages that go through the Exchange Security Agent and are then sent to the Security Gateway for inspection.
- - Then number of emails that are currently being handled by the Exchange Security Agent.
- - Total number of emails handled by the Exchange Security Agent.
- - Total number of emails inspected by the DLP policy (includes dropped and allowed messages).
- - Emails dropped after being inspected by the DLP policy.
Message Tracking
In the Message Tracking window you can see logs for each message that goes through the Exchange Security Agent. You can do a on all of the fields in the log and the log.
You can see these values in the Event Id column:
- - The message has been received by the Exchange Security Agent. The Reason column for this entry is always blank.
- - The message has been inspected by DLP and has been sent to its destination.
- - The message has been dropped by DLP and has not been sent to its destination.
- - The Exchange Security Agent has not sent the message to DLP for inspection. The message is sent to its destination.
This table describes the possible reasons for each of the event IDs.
Event ID
|
Reason
|
Receive
|
Empty - indicates that the message is being handled by the Exchange Security Agent
|
Release
|
Tap mode - when all of the rules in the Rule Base are detect or inform, the Exchange Security Agent automatically sends the message to its destination. The agent does not receive a response from the Security Gateway
|
Scanned by gateway
|
Timeout
|
Drop
|
Dropped by gateway - after Security Gateway inspection the message matched an ask or prevent rule
|
Bypass
|
DLP scanning is disabled - when DLP inspection is not enabled on the Security Gateway
|
Fail open active - if one of the bypass settings in the Advanced window is matched
|
Message is too big
|
Incoming message scanning is disabled
|
Internal message scanning is disabled
|
Incoming message scanning from other domains is disabled
|
Sender is included in the Inspection Scope exceptions
|
Sender is not included in Inspection Scope settings
|
Advanced
In the Advanced window you can configure log parameters and when not to send emails to the Security Gateway for DLP inspection.
The available options:
Configuring SMTP Mirror Port Mode
In Mirror Port Mode, the DLP gateway scans SMTP and HTTP traffic for possible violations. The DLP gateway connects to the SPAN port of a switch and monitors traffic without enforcing a policy. Mirror Port Mode lets you run a full data leak assessment of all outgoing SMTP/HTTP traffic with minimal deployment risk.
How it works
When the DLP Security Gateway is connected to a SPAN port of the switch, the gateway gets a copy of all packets passing through the switch. The DLP tap mechanism builds TCP streams of SMTP and HTTP traffic. These streams are scanned by the DLP engine for possible violations of the policy.
Enabling Mirror Port Mode scanning of SMTP and HTTP Traffic
Before enabling Mirror Port Mode scanning, you must prepare the gateway.
Mirror Port Mode scanning is not enabled by default.
To enable Mirror Port Mode:
Use the dlp_smtp_mirror_port
dlp_smtp_mirror_port
|
|
Description
|
Enables SMTP Mirror Port Mode
|
Syntax
|
dlp_smtp_mirror_port |status | enable |disable
|
Parameters
|
Parameter
|
Description
|
status
|
Shows the status, whether mirror port mode is enabled or disabled.
|
enable
|
Enables Mirror Port Mode
|
disable
|
Disables Mirror Port Mode
|
|
|
Example
|
dlp_smtp_mirror_port enable
|
Output
|
# dlp_smtp_mirror_port enable
Enabling SMTP mirror port requires running local policy installation. continue? (yes)
yes
Installing Security Policy Standard on all.all@dlpgw
Fetching Security Policy from local succeeded
# dlp_smtp_mirror_port status
SMTP mirror port is enabled
|
|
|
Comments
|
SMTP mirror mode remains enabled after a gateway reboot.
|
HTTPS Inspection
You can enable HTTPS traffic inspection on Security Gateways to inspect traffic that is encrypted by the Secure Sockets Layer (SSL) protocol. SSL secures communication between internet browser clients and web servers. It supplies data privacy and integrity by encrypting the traffic, based on standard encryption ciphers.
However, SSL has a potential security gap. It can hide illegal user activity and malicious traffic from the content inspection of Security Gateways. One example of a threat is when an employee uses HTTPS (SSL based) to connect from the corporate network to internet web servers. Security Gateways without HTTPS Inspection are unaware of the content passed through the SSL encrypted tunnel. This makes the company vulnerable to security attacks and sensitive data leakage.
The SSL protocol is widely implemented in public resources that include: banking, web mail, user forums, and corporate web resources.
There are two types of HTTPS inspection:
- - To protect internal servers from malicious requests originating from the internet or an external network.
- - To protect an organization from malicious traffic being sent by an internal client to a destination outside of the organization.
The Security Gateway acts as an intermediary between the client computer and the secure web site. The Security Gateway behaves as the client with the server and as the server with the client using certificates.
All data is kept private in HTTPS Inspection logs. This is controlled by administrator permissions. Only administrators with HTTPS Inspection permissions can see all the fields in a log. Without these permissions, some data is hidden.
How it Operates
In outbound HTTPS inspection, when a client in the organization initiates an HTTPS connection to a secure site, the Security Gateway:
- Intercepts the request.
- Establishes a secure connection to the requested web site and validates the site server certificate.
- Creates a new SSL certificate for the communication between the Security Gateway and the client, sends the client the new certificate and continues the SSL negotiation with it.
- Using the two SSL connections:
- It decrypts the encrypted data from the client.
- Inspects the clear text content for all blades set in the Policy.
- Encrypts the data again to keep client privacy as the data travels to the destination web server resource.
In inbound HTTPS inspection, when a client outside of the organization initiates an HTTPS connection to a server behind the organization's gateway, the Security Gateway:
- Intercepts the request.
- Uses the server's original certificate and private key to initiate an SSL connection with the client.
- Creates and establishes a new SSL connection with the web server.
- Using the two SSL connections:
- It decrypts the encrypted data from the client.
- Inspects the clear text content for all blades set in the policy.
- Encrypts the data again to keep client privacy as the data travels to the destination server behind the gateway.
Configuring Outbound HTTPS Inspection
To enable outbound HTTPS traffic inspection, you must do these steps:
Enabling HTTPS Inspection
You must enable HTTPS inspection on each Security Gateway. From > > > Select .
The first time you enable HTTPS inspection on one of the Security Gateways, you must create an outbound CA certificate for HTTPS inspection or import a CA certificate already deployed in your organization. This outbound certificate is used by all Security Gateways managed on the Security Management Server.
Creating an Outbound CA Certificate
The outbound CA certificate is saved with a P12 file extension and uses a password to encrypt the private key of the file. The Security Gateways use this password to sign certificates for the sites accessed. You must keep the password as it also used by other Security Management Servers that import the CA certificate to decrypt the file.
After you create an outbound CA certificate, you must export it so it can be distributed to clients. If you do not deploy the generated outbound CA certificate on clients, users will receive SSL error messages in their browsers when connecting to HTTPS sites. You can configure a troubleshooting option that logs such connections.
After you create the outbound CA certificate, a certificate object named Outbound Certificate is created. Use this in rules that inspect outbound HTTPS traffic in the HTTPS inspection Rule Base.
To create an outbound CA certificate:
- In SmartDashboard, right-click the Security Gateway object and select Edit.
The Gateway Properties window opens.
- In the navigation tree, select .
- In the HTTPS Inspection page, click .
- Enter the necessary information:
- - Enter the domain name of your organization.
- - Enter the password that is used to encrypt the private key of the CA certificate.
- - Retype the password.
- - Select the date range for which the CA certificate is valid.
- Click .
- Export and deploy the CA certificate.
Importing an Outbound CA Certificate
You can import a CA certificate that is already deployed in your organization or import a CA certificate created on one Security Management Server to use on another Security Management Server.
|
|
|
|
|
Note - It is recommended that you use private CA Certificates.
|
|
Important - If you are importing a CA certificate created on another Security Management Server, make sure the initial certificate was exported from the Security Management Server on which it was created.
|
For each Security Management Server that has Security Gateways enabled with HTTPS inspection, you must:
- Import the CA certificate.
- Enter the password the Security Management Server uses to decrypt the CA certificate file and sign the certificates for users. This password is only used when you import the certificate to a new Security Management Server.
|
Important - After you import a certificate from another Security Management Server, make sure to export the certificate and deploy it on the client machines if it has not already been deployed.
|
To import a CA certificate:
- In SmartDashboard, right-click a Security Gateway object, select > >
Or
From the > Gatewayspane of a supported blade, click the arrow next to Create Certificate and select .
The Import Outbound Certificate window opens.
- Browse to the certificate file.
- Enter the .
- Click .
Exporting a Certificate from the Security Management Server
If you use more than one Security Management Server in your organization, you must first export the CA certificate using the export_https_cert
Usage:
export_https_cert [-local] | [-s server] [-f certificate file name under FWDIR/tmp][-help]
To export the CA certificate:
Exporting and Deploying the Generated CA
To prevent users from getting warnings about the generated CA certificates that HTTPS inspection uses, install the generated CA certificate used by HTTPS inspection as a trusted CA. You can distribute the CA with different distribution mechanisms such as Windows GPO. This adds the generated CA to the trusted root certificates repository on client computers.
When users do standard updates, the generated CA will be in the CA list and they will not receive browser certificate warnings.
To distribute a certificate with a GPO:
- From the window of the Security Gateway, click
Or
From the > pane in a supported blade, click .
- Save the CA certificate file.
- Use the Group Policy Management Console to add the certificate to the Trusted Root Certification Authorities certificate store.
- Push the Policy to the client computers in the organization.
Note - Make sure that the CA certificate is pushed to the client computer organizational unit.
- Test the distribution by browsing to an HTTPS site from one of the clients and verifying that the CA certificate shows the name you entered for the CA certificate that you created in the field.
Deploying Certificates by Using Group Policy
You can use this procedure to deploy a certificate to multiple client machines by using Active Directory Domain Services and a Group Policy object (GPO). A GPO can contain multiple configuration options, and is applied to all computers that are within the scope of the GPO.
Membership in the local Administrators group, or equivalent, is necessary to complete this procedure.
To deploy a certificate using Group Policy:
- Open the Group Policy Management Console.
- Find an existing GPO or create a new GPO to contain the certificate settings. Make sure the GPO is associated with the domain, site, or organization unit whose users you want affected by the policy.
- Right-click the GPO and select .
The Group Policy Management Editor opens and shows the current contents of the policy object.
- Open > > > > .
- Click > .
- Do the instructions in the to find and import the certificate you exported from SmartDashboard.
- In the navigation pane, click and repeat steps 5-6 to install a copy of the certificate to that store
Configuring Inbound HTTPS Inspection
To enable inbound HTTPS traffic inspection, you must do these steps:
- Set the Security Gateway for HTTPS Inspection (if it is not already configured). From > > > Select .
- Import server certificates for servers behind the organization Security Gateways.
- Generate an HTTPS inspection policy by defining relevant rules in the HTTPS inspection Rule Base.
- Make sure to configure the relevant server certificate in the HTTPS inspection Rule Base.
Server Certificates
When a client from outside the organization initiates an HTTPS connection to an internal server, the Security Gateway intercepts the traffic. The Security Gateway inspects the inbound traffic and creates a new HTTPS connection from the gateway to the internal server. To allow seamless HTTPS inspection, the Security Gateway must use the original server certificate and private key.
For inbound HTTPS inspection, do these steps:
- Add the server certificates to the Security Gateway - This creates a server certificate object.
- Add the server certificate object to the column in the HTTPS Inspection Policy to enforce it in rules.
The Server Certificates window in SmartDashboard includes these options:
- - Import a new server certificate. Enter a name for the server certificate, optional comment and import the P12 certificate file.
- - Delete a previously added server certificate. This option does not delete the server certificate option. It only removes it from the Server Certificate list.
- - Enter a key word to search for a server certificate in the list.
Adding a Server Certificate
When you import a server certificate, enter the same password that was entered to protect the private key of the certificate on the server. The Security Gateway uses this certificate and the private key for SSL connections to the internal servers.
After you import a server certificate (with a P12 file extension) to the Security Gateway, make sure you add the object to the HTTPS Inspection Policy.
Do this procedure for all servers that receive connection requests from clients outside of the organization.
To add a server certificate:
- In SmartDashboard, open > .
- Click .
The Import Certificate window opens.
- Enter a and a (optional).
- Browse to the certificate file.
- Enter the .
- Click .
The Successful Import window opens the first time you import a server certificate. It shows you where to add the object in the HTTPS Inspection Rule Base. Click if you do not want to see the window each time you import a server certificate and .
The HTTPS Inspection Policy
The HTTPS inspection policy determines which traffic is inspected. The primary component of the policy is the Rule Base. The rules use the categories defined in the Application Database, network objects and custom objects (if defined).
The HTTPS Rule Base lets you inspect the traffic on other network blades. The blades that HTTPS can operate on are based on the blade contracts and licenses in your organization and can include:
- Application Control
- URL Filtering
- IPS
- DLP
- Anti-Virus
- Anti-Bot
If you enable Identity Awareness on your gateways, you can also use Access Role objects as the source in a rule. This lets you easily make rules for individuals or different groups of users.
To access the HTTPS inspection Rule Base:
- In SmartDashboard, open the Policy page from the specified blade tab:
- For Application and URL Filtering, Anti-Bot, Anti-Virus, and IPS - Select > > .
- For DLP - Select > >.
Predefined Rule
When you enable HTTPS inspection, a predefined rule is added to the HTTPS Rule Base. This rule defines that all HTTPS and HTTPS proxy traffic from any source to the internetis inspected on all blades enabled in the Blade column. By default, there are no logs.

Parts of the Rule
The columns of a rule define the traffic that it matches and if that traffic is inspected or bypassed. When traffic is bypassed or if there is no rule match, the traffic continues to be examined by other blades in the Security Gateway.
Number (No.)
The sequence of rules is important because the first rule that matches is applied.
For example, if the predefined rule inspects all HTTPS traffic from any category and the next rule bypasses traffic from a specified category, the first rule that inspects the traffic is applied.
Name
Give the rule a descriptive name. The name can include spaces.
Double-click in the Name column of the rule to add or change a name.
Source
The source is where the traffic originates. The default is Any.
|
Important - A rule that blockstraffic, with the and parameters defined as , also blocks traffic to and from the Captive Portal.
|
Put your mouse in the column and a plus sign shows. Click the plus sign to open the list of network objects and select one or multiple sources. The source can be an Access Role object, which you can define when Identity Awareness is enabled.
Destination
Choose the destination for the traffic. The default is the , which includes all traffic with the destination of DMZ or external. If you delete the destination value, the rule changes to , which applies to traffic going to all destinations
|
Important - A rule that blockstraffic, with the and parameters defined as , also blocks traffic to and from the Captive Portal.
|
To choose other destinations, put your mouse in the column and a plus sign shows. Click the plus sign to open the list of network objects and select one or multiple destinations.
Services
By default, HTTPS traffic on port 443 and HTTP and HTTPS proxy on port 8080 is inspected. You can include more services and ports in the inspection by adding them to the services list.
To select other HTTPS/HTTP services, put your mouse in the column and a plus sign shows. Click the plus sign to open the list of services and select a service. Other services, such as SSH are not supported.
Site Category
The Site Category column contains the categories for sites and applications that users browse to and you choose to include. One rule can include multiple categories of different types.
|
Important -
- A valid URL Filtering blade contract and license are necessary on the relevant Security Gateways to use the Site Category column.
- To perform categorization correctly, a single connection to a site must be inspected in some cases regardless of the HTTPS inspection policy. This maps the IP address of a site to the relevant domain name.
|
You can also include custom applications, sites, and hosts. You can select a custom defined application or site object with the Custom button or create a new host or site with the New button at the bottom of the page.
|
Note - You can only use custom objects that specify the domain name or host part of a URL. URLs that contain paths are not supported. For example, you can use an object defined as ww.gmail.com but not www.gmail.com/myaccount.
|
To add site categories to a rule:
Put your mouse in the column and a plus sign shows. Click the plus sign to open the Category viewer. For each category, the viewer shows a description and if there are applications or sites related with it.
- To filter the Available list by categories or custom-defined sites, click the specified button in the toolbar of the viewer. The Available list opens in the left column and then you can add items to the rule.
- To add a category object to the rule, click the checkbox in the Available list.
- To see the details of category without adding it to the rule, click the name of the item in the Available list.
- You can only select a category to add to the rule from the Available list.
- If a category is already in a rule, it will not show in the Category viewer.
- If you know the name of a category, you can search for it. The results will show in the Available list.
- You can add a new host site with the New button.
Adding a New Host Site
You can create a new host site object to use in the HTTPS Rule Base if there is no corresponding existing category. Only the domain name part or hosts part of the URL is supported.
To create a new host site:
- Click the plus icon in the Site Category column.
- In the Category viewer, select .
The window opens.
- Enter a name for the host site.
- Set a color for the host site icon (optional).
- Enter a comment for the host site (optional).
- In , enter a valid URL and click .
- If you used a regular expression in the URL, click .
- Click .
The new host site is added to the list and can be added to the Rule Base.
Action
The action is what is done to the traffic. Click in the column to see the options and select one to add to the rule.
- - The traffic is inspected on the blades set in the column.
- - The traffic of source and destination traffic in rules that include the bypass action are not decrypted and inspected. You can bypass HTTPS inspection for all Check Point objects. This is recommended for Anti-Bot, Anti-Virus, URL Filtering, and IPS updates. Other HTTPS protections that already operate on traffic will continue to work even when the HTTPS traffic is not decrypted for inspection.
Track
Choose if the traffic is logged in SmartView Tracker or if it triggers other notifications. Click in the column and the options open. The options include:
- - Does not record the event
- - Records the event details in SmartView Tracker. This option is useful for obtaining general information on your network traffic. There is one or more log for each session depending on the suppression option.
- - Logs the event and executes a command, such as display a popup window, send an email alert or an SNMP trap alert, or run a user-defined script as defined in >>>
- - Sends an email to the administrator, or runs the mail alert script defined in >>>
- - Sends a SNMP alert to the SNMP GUI, or runs the script defined in >>>
- - Sends one of three possible customized alerts. The alerts are defined by the scripts specified in >>>
Blade
Choose the blades that will inspect the traffic. Click in the column and the options open. The options include:
- Application Control
- Data Loss Prevention
- IPS
- URL Filtering
- Anti-Virus
- Anti-Bot
|
Important - The blade options you see are based on the blade contracts and licenses in your organization.
|
Install On
Choose which Security Gateways the rule will be installed on. The default is All, which means all Security Gateways that have HTTPS inspection enabled. Put your mouse in the column and a plus sign shows. Click the plus sign to open the list of available Security Gateways and select.
Certificate
Choose the certificate that is applicable to the rule. The Security Gateway uses the selected certificate for communication between the Security Gateway and the client.
- - choose the object (default) that reflects the CA certificate you created/imported and deployed on the client machines in your organization.
- - choose the server certificate applicable to the rule. Put your mouse in the column and a plus sign shows. Click the plus sign to open the list of available server certificates and select one. When there is a match to a rule, the Security Gateway uses the selected server certificate to communicate with the source client. You can create server certificates from > > .
Bypassing HTTPS Inspection to Software Update Services
Check Point dynamically updates a list of approved domain names of services from which content is always allowed. This option makes sure that Check Point updates or other 3rd party software updates are not blocked. For example, updates from Microsoft, Java, and Adobe.
To bypass HTTPS inspection to software updates:
- In the HTTPS Inspection > Policy pane, select. This option is selected by default.
- Click to see the list of approved domain names.
Gateways Pane
The pane lists the gateways with HTTPS Inspection enabled. Select a gateway and click Edit to edit the gateway properties. You can also search, add and remove Security Gateways from here.
For each gateway, you see the gateway name, IP address and comments.
In the CA Certificate section, you can the certificate validity date range if necessary and it for distribution to the organization client machines.
If the Security Management Server managing the selected Security Gateway does not have a generated CA certificate installed on it, you can add it with . There are two options:
- You can import a CA certificate already deployed in your organization.
- You can import a CA certificate from another Security Management Server. Before you can import it, you must first export it from the Security Management Server on which it was created.
Adding Trusted CAs for Outbound HTTPS Inspection
When a client initiates an HTTPS connection to a web site server, the Security Gateway intercepts the connection. The Security Gateway inspects the traffic and creates a new HTTPS connection from the Security Gateway to the designated server.
When the Security Gateway establishes a secure connection (an SSL tunnel) to the designated web site, it must validate the site server certificate.
HTTPS Inspection comes with a preconfigured list of trusted CAs. This list is updated by Check Point when necessary and is automatically downloaded to the Security Gateway. The system is configured by default to notify you when a Trusted CA update file is ready to be installed. The notification in SmartDashboard shows as a pop-up notification or in the window in the Automatic Updates section. After you install the update, make sure to install the policy. You can choose to disable the automatic update option and manually update the Trusted CA list.
If the Security Gateway receives a non-trusted server certificate from a site, by default the user gets a self-signed certificate and not the generated certificate. A page notifies the user that there is a problem with the website security certificate, but lets the user continue to the website.
You can change the default setting to block untrusted server certificates.
The trusted CA list is based on the Microsoft Root Certificate Program.
Automatically Updating the Trusted CA List and Certificate Blacklist
Updates for the trusted CA list and Certificate Blacklist will be published from time to time on the Check Point web site. They are automatically downloaded to the Security Management Server by default. When you are sent a notification that there is an update available, install it and do the procedure. The first notification is shown in a popup balloon once and then in the notification line under > . You can disable automatic updates if necessary.
To update the Trusted CA list and Certificate Blacklist:
- In SmartDashboard, select > .
- In the section, click .
You see the certificates that will be added or removed to the lists and the validity date range of the certificates added to the Trusted CA list.
- Click to confirm the update.
The certificates will be added or removed respectively from the lists.
- Install the Policy.
To disable automatic updates:
- In SmartDashboard, select > .
- In the section, clear the checkbox.
Manually Updating a Trusted CA
To add a trusted CA manually to the Security Gateway, you must export the necessary certificate from a non-trusted web site and then import it into SmartDashboard.
To export a CA certificate to add to the Trusted CAs list:
- Temporarily disable HTTPS inspection on the Security Gateway.
- Install the security policy.
- Browse to the site to get the certificate issued by the CA.
- Go to the Certification Path of the certificate.
- Select the root certificate (the top most certificate in the list).
- In Internet Explorer and Chrome:
- Click .
- From the Details tab, click .
- Follow the wizard steps.
- In Firefox, export the certificate.
To import a CA certificate to the Trusted CAs list:
- In SmartDashboard, open >.
- Click ,browse to the location of the saved certificate and click .
The certificate is added to the trusted CAs list.
- Install the security policy on Security Gateways enabled with HTTPS Inspection.
Saving a CA Certificate
You can save a selected certificate in the trusted CAs list to the local file system.
To export a CA certificate:
- In SmartDashboard, open > .
- Click > .
- Browse to a location, enter a file name and click .
A CER file is created.
HTTPS Validation
Server Validation
When a Security Gateway receives an untrusted certificate from a web site server, the settings in this section define when to drop the connection.
When selected, traffic from a site with an untrusted server certificate is immediately dropped. The user gets an error page that states that the .
When cleared, a self-signed certificate shows on the client machine when there is traffic from an untrusted server. The user is notified that there is a problem with the website security certificate, but lets the user to continue to the website (default).
When selected, the Security Gateway validates that each server site certificate is not in the Certificate Revocation List (CRL) (default).
If the CRL cannot be reached, the certificate is considered trusted (this is the default configuration). An HTTPS Inspection log is issued that indicates that the CRL could not be reached. This setting can be changed with GuiDBedit. Select > > and change the attribute drop_if_crl_cannot_be_reached
To validate the CRL, the Security Gateway must have access to the internet. For example, if a proxy server is used in the organization environment, you must configure the proxy for the Security Gateway.
To configure the proxy:
- From the tab, double-click the Security Gateway that requires proxy configuration.
- Select > .
- Select and and enter the proxy IP address.
- Optionally, you can use the default proxy settings.
- Click .
When cleared, the Security Gateway does not check for revocations of server site certificates.
|
Important - Make sure that there is a rule in the Rule Base that allows outgoing HTTP from the Security Gateway.
|
- When selected, the Security Gateway drops the connection if the server certificate has expired.
- When cleared, the Security Gateway creates a certificate with the expired date. The user can continue to the website (default).
Choose if the server validation traffic is logged in SmartView Tracker or if it triggers other notifications. The options include:
- - Does not record the event.
- - Records the event details in SmartView Tracker
- - Logs the event and executes a command, such as shows a popup window, send an email alert or an SNMP trap alert, or run a user-defined script as defined in >>>
- - Sends an email to the administrator, or runs the mail alert script defined in >>>
- - Sends an SNMP alert to the SNMP GUI, or runs the script defined in >>>
- - Sends one of three possible customized alerts. The alerts are defined by the scripts specified in >>>
- When selected, intermediate CA certificates issued by trusted root CA certificates that are not part of the certificate chain are automatically retrieved using the information on the certificate (default).
- When cleared, a web server certificate signed by an intermediate CA and not sent as part of the certificate chain, is considered untrusted.
Certificate Blacklisting
You can create a list of certificates that are blocked. Traffic from servers using the certificates in the blacklist will be dropped. If a certificate in the blacklist is also in the Trusted CAs list, the blacklist setting overrides the Trusted CAs list.
- - Lets you add a certificate. Enter the certificate serial number (in hexadecimal format HH:HH) and a comment that describes the certificate.
- - Lets you change a certificate in the blacklist.
- - lets you delete a certificate in the blacklist.
- - Lets you search for a certificate in the blacklist.
Choose if the dropped traffic is logged in SmartView Tracker or if it triggers other notifications. The options include:
- - Does not record the event.
- - Records the event details in SmartView Tracker
- - Logs the event and executes a command, such as shows a popup window, send an email alert or an SNMP trap alert, or run a user-defined script as defined in >>>
- - Sends an email to the administrator, or runs the mail alert script defined in >>>
- - Sends an SNMP alert to the SNMP GUI, or runs the script defined in >>>
- - Sends one of three possible customized alerts. The alerts are defined by the scripts specified in >>>
Troubleshooting
Secure connections between a client and server with no traffic create logs in SmartView Tracker labeled as "Client has not installed CA certificate". This can happen when an application or client browser fails to validate the server certificate. Possible reasons include:
- The generated CA was not deployed on clients.
- The DN in the certificate does not match the actual URL (for example, when you browse to https://www.gmail.com, the DN in the certificate states mail.google.com).
- Applications (such as Firefox and anti-viruses) that use an internal trusted CA list (other than Windows). Adding the CA certificate to the Windows repository does not solve the problem.
The option in the HTTPS Validation pane:
- When selected, logs are recorded for secure connections between a client and server with no traffic in SmartView Tracker (default). Logs are recorded only when a server certificate is trusted by the Security Gateway. If the server certificate is untrusted, a self-signed certificate is created and always results in a log labeled as "Client has not installed CA certificate".
- When cleared, logs are not recorded for secure connections without traffic that can be caused by not installing the CA certificate on clients or one of the above mentioned reasons.
HTTP/HTTPS Proxy
You can configure a gateway to be an HTTP/HTTPS proxy. When it is a proxy, the gateway becomes an intermediary between two hosts that communicate with each other. It does not allow a direct connection between the two hosts.
Each successful connection creates two different connections:
- One connection between the client in the organization and the proxy.
- One connection between the proxy and the actual destination.
Proxy Modes
Two proxy modes are supported:
- - All HTTP traffic on specified ports and interfaces is intercepted and sent to a proxy. No configuration is required on the clients.
- - All HTTP/HTTPS traffic on specified ports and interfaces directed to the gateway is sent to a proxy. Configuration of the proxy address and port is required on client machines.
Access Control
You can configure one of these options for forwarding HTTP requests:
- - HTTP/HTTPS traffic from all internal interfaces is forwarded by proxy.
- - HTTP/HTTPS traffic from interfaces specified in the list is forwarded by proxy.
Ports
By default, traffic is forwarded only on port 8080. You can add or edit ports as required.
Advanced
By default, the HTTP header contains the proxy related header. You can remove this header with the option.
You can also use the Advanced option to configure the that contains the IP address of the client machine. It is not added by default because it reveals the internal client IP.
Logging
The Security Gateway opens two connections, but only the Firewall blade can log both connections. Other blades show only the connection between the client and the gateway. The Destination field of the log only shows the gateway and not the actual destination server. The Resource field shows the actual destination.
To configure a Security Gateway to be an HTTP/HTTPS proxy:
- From the window of a Security Gateway object, select from the tree.
- Select .
- Select the or proxy mode.
Note - If you select mode, make sure to configure the clients to work with the proxy.
- Select to forward HTTP requests from one of these options:
- - Click the plus sign to add specified interfaces or the minus sign to remove an interface.
- To enter more ports on which to forward traffic, select .
- To include the actual source IP address in the HTTP header, select > .
The X-Forward-For header must be configured if traffic will be forwarded to Identity Awareness Security Gateways that require this information for user identification.
- Click .
Security Gateway Portals
The Security Gateway runs a number of web-based portals over HTTPS:
- Mobile web access portal
- SecurePlatform WebUI
- Gaia WebUI
- Identity Awareness (Captive Portal)
- DLP portal
- SSL Network Extender portal
- UserCheck portal
- Endpoint Security portals (CCC)
All of these portals can resolve HTTPS hosts to IPv4 and IPv6 addresses over port 443.
These portals (and HTTPS inspection) support the latest versions of the TLS protocol. In addition to SSLv3 and TLS 1.0 (RFC 2246), the Security Gateway supports:
- TLS 1.1 (RFC 4346)
- TLS 1.2 (RFC 5246)
Support for TLS 1.1 and TLS 1.2 is enabled by default but can be disabled in SmartDashboard (for web-based portals) or GuiDBedit (for HTTPS Inspection).
To configure TLS protocol support for portals:
- In , open .
- In the section, click .
The window opens.
- On the page, set minimum and maximum versions for SSL and TLS protocols.
To Configure TLS Protocol Support for HTTPS inspection:
- In , on the tab, select .
- In the column, select .
- In the column, select the minimum and maximum TLS version values in these fields:
- (default = TLS 1.2)
- (default = SSLv3)
HTTPS Inspection in SmartView Tracker
Logs from HTTPS Inspection are shown in SmartView Tracker. There are two types of predefined queries for HTTPS Inspection logs in SmartView Tracker:
- HTTPS Inspection queries
- Blade queries - HTTPS Inspection can be applied to these blades:
- Application Control
- URL Filtering
- IPS
- DLP
- Anti-Virus
- Anti-Bot
To open SmartView Tracker do one of these:
- From the SmartDashboard toolbar, select Window > SmartView Tracker.
- Press Control +Shift +T.
HTTPS Inspection Queries
These are the predefined queries in Predefined > Network Security Blades > HTTPS Inspection.
- - Shows all HTTPS traffic that matched the HTTPS Inspection policy and was configured to be logged.
- Shows traffic with connection problems.
- Action values include rejected or detected. The actions are determined by the SSL validation settings for HTTPS Inspection.
- HTTPS Validation values include:
- - For general SSL protocol problems
Blade Queries
When applying HTTPS Inspection to a specified blade:
- There is an for each of the blades that can operate with HTTPS Inspection. The query shows all traffic of the specified blade that passed through HTTPS inspection.
- The log in the blade queries includes an . The field value can be inspect or bypass. If the traffic did not go through HTTPS inspection, the field does not show in the log.
Permissions for HTTPS Logs
An administrator must have HTTPS inspection permissions to see classified data in HTTPS inspected traffic.
To set permissions for an administrator in a new profile:
- In the Users and Administrators tree, select an administrator > Edit.
- In the > page in the field, click .
- In the window:
- Enter a for the profile.
- Select and click .
The window opens.
- In the tab, select for permission to see the classified information in the HTTPS Inspection logs.
- Click on all of the open windows.
To edit an existing permissions profile:
- From the SmartDashboard toolbar, select >.
- Select a profile and click .
- Follow the instructions above from step 3.
HTTPS Inspection in SmartEvent
Events from HTTPS Inspection are shown in SmartEvent. There are two types of predefined queries for HTTPS Inspection events in SmartEvent:
- HTTPS Inspection queries for HTTPS validations
- Blade queries - HTTPS Inspection can be applied to these blades:
- Application Control
- URL Filtering
- IPS
- DLP
- Anti-Virus
To open SmartEvent do one of these:
- From the SmartDashboard toolbar, select Window > SmartEvent.
- Press Control +Shift +T.
Event Analysis in SmartEvent
SmartEvent supplies advanced analysis tools with filtering, charts, reporting, statistics, and more, of all events that pass through enabled Security Gateways. SmartEvent shows all HTTPS Inspection events.
You can filter the HTTPS Inspection information for fast monitoring on HTTPS Inspection traffic.
- Real-time and history graphs of HTTPS Inspection traffic.
- Graphical incident timelines for fast data retrieval.
- Easily configured custom views to quickly view specified queries.
- Incident management workflow.
SmartEvent shows information for all Software Blades in the environment.
Viewing Information in SmartEvent
There are two types of predefined queries for HTTPS Inspection events in SmartEvent:
- HTTPS Inspection queries
- Blade queries
HTTPS Inspection Queries
- Go to >>> to shows the SSL validation events that occurred.
- The and in the event record show if the traffic was detected or rejected due to SSL Validation settings.
Blade Queries
- There is an for each of the blades that can operate with HTTPS Inspection. The query shows all traffic of the specified blade that passed through HTTPS inspection.
- The in the event record in the blade queries includes an . The field value can be inspect or bypass. If the traffic did not go through HTTPS inspection, the field does not show in the event record.
|
