Managing Application Control and URL Filtering
You configure Application Control and URL Filtering in SmartDashboard. SmartView Tracker shows the logs and SmartEvent shows real-time traffic statistics and analysis. This chapter explains the Application Control and URL Filtering configuration and management that you do in SmartDashboard.
The Policy Rule Base
The Application Control and URL Filtering Policy determines who can access which applications and sites from an organization. The primary component of the Policy is the Rule Base. The rules use the Application and URL Filtering Database, network objects and custom objects (if defined).
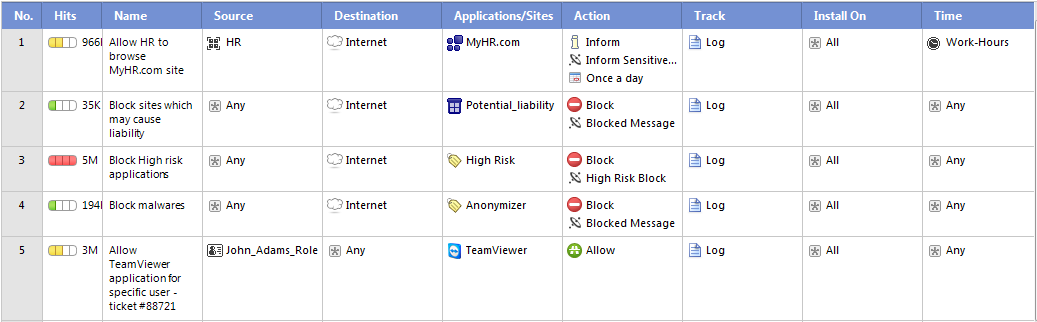
If you enable Identity Awareness on your Security Gateways, you can also use Access Role objects as the source in a rule. This lets you easily make rules for individuals or different groups of users. You cannot use a regular network object and an access role together in one field. For example, you can have the source of Rule 4 as an Access Role and the Destination as an Address Range. But you cannot have an Access Role and an Address Range together in the Source field.
There are no implied rules in the Rule Base. Application and site traffic is allowed unless it is explicitly blocked.
For examples of how to create different types of rules, see Creating Application Control Rules.
Default Rule and Monitor Mode
When you enable Application Control, a default rule is added to the Rule Base that allows all traffic from known applications and sites, with the tracking set to .
Source
|
Destination
|
Applications/Sites
|
Action
|
Track
|
Install On
|
Any
|
Internet
|
Any Recognized
|
Allow
|
Log
|
All
|
The result of this rule is that all application traffic is monitored. Therefore, you can see logs related to application traffic in SmartView Tracker and SmartEvent. Use the data there to better understand the use of applications in your environment and create an effective Rule Base.
If you enabled Identity Awareness on the Security Gateway, you will also see names of identified users in the logs.
If you do not add other rules to the Rule Base, your Application Control Policy stays in . This means that you see application traffic in the logs but do not block access to applications.
If you change the default rule, for example:
- You change the tracking to none
- You change the value in Applications/Sites from to a specified application,
Then no traffic will be monitored.
You can add more rules that block specified applications or sites or have different tracking settings. But if you do not change the default rule, traffic that is not included in other rules is allowed and monitored.
Parts of the Rules
The columns of a rule define the traffic that it matches and what is done to that traffic:
Number (NO.)
The sequence of rules is important because the first rule that matches an application is applied.
For example, Gmail additional categories include Sends Mail, Transmits Personal or Enterprise Information, and Instant Chat. If rule 3 allows Gmail and rule 4 blocks applications with the Instant Chat additional category, Gmail will be allowed based on rule 3.
Hits
Hit Count tracks the number of connections that each rule matches. For each rule in the Rule Base, the Hits column shows by default a visual indicator of matching connections together with the number of hits in K (thousands), M (millions), G (billions), or T (trillions). You can configure to show the percentage of the rule's hits from total hits, the indicator level (very high, high, medium, low, or zero) and set a timeframe for the data that is shown. These options are configured from the Firewall Rule Base by right-clicking the Hits column header or the rule number.
See Hit Count.
Name
Give the rule a descriptive name. The name can include spaces.
Double-click in the Name column of the rule to add or change a name.
Source
The source is where the traffic originates. The default is Any.

|
Important - A rule that blockstraffic, with the and parameters defined as , also blocks traffic to and from the Captive Portal.
|
Put your mouse in the column and a plus sign shows. Click the plus sign to open the list of network objects and select one or multiple sources. The source can be an Access Role object, which you can define when Identity Awareness is enabled.
Destination
Choose the destination for the traffic. The default is the , which includes all traffic with the destination of DMZ or external. If you delete the destination value, the rule changes to , which applies to traffic going to all destinations
|
Important - A rule that blockstraffic, with the and parameters defined as , also blocks traffic to and from the Captive Portal.
|
To choose other destinations, put your mouse in the column and a plus sign shows. Click the plus sign to open the list of network objects and select one or multiple destinations.
Applications/Sites
The Applications/Sites column contains the applications and categories for sites and applications that you choose to include. One rule can include multiple items and items of different types. For example, one rule can include 2 applications and 3 categories. The default is that the rule applies to all known applications and sites. The category on which the rule is matched is shown in the SmartView Tracker logs in the Matched Category field.
You can also include widgets and custom defined applications, sites, categories and groups. Custom defined items are set in SmartDashboard by the administrator and are not a part of the Application and URL Filtering Database.
If you do not enable URL Filtering on the Security Gateway, you can use a generic web browser application called .
This application includes all HTTP traffic that is not a defined application. Because Web Browsing traffic can generate a lot of logs, the Web browsing application has its own activation setting. You can activate Web Browsing in > .
To add applications or categories to a rule:
Put your mouse in the column and a plus sign shows. Click the plus sign to open the Application viewer. For each application or widget, the viewer shows a short description and its related categories. For each category, the viewer shows a description and if there are applications or sites related with it.
- To add an item to the rule, click the checkbox in the list.
- To see the details of an item without adding it to the rule, click the name of the item.
- You can select an application, category, site or group to add to the rule from the list.
- To filter the list by categories, applications, custom-defined items or widgets, click the buttons in the toolbar of the viewer. The Available list shows the filtered items and then you can add items to the rule.
- To see all applications in a risk level, select the level from the Risk field in the toolbar.
- If you know the name of an application or category, you can search for it. The results show in the list.
- To add a new category, application or site, or application or site group, use the button.
Action
Action refers to what is done to the traffic. Click in the column to see the options and select an action to add to the rule.
|
|
|
|
|
Action
|
Meaning
|
Allow
|
Allows the traffic
|
Inform
|
Sends a message to the user attempting to access the application
|
Ask
|
Asks the user a question and adds a confirmatory check box, or a reason box.
|
Block
|
Blocks the traffic. If no UserCheck object is defined for this action, no page is displayed.
|
Limit
|
Limits the bandwidth that is permitted for a rule. Add a Limit object to configure a maximum throughput for uploads and downloads.
|
User Check Frequency
|
Configure how often the user should see the configured message when the action is ask, inform, or block.
|
Edit User Check Message
|
Opens the User Check message for editing
|
Captive Portal
|
Redirects http traffic to an authentication (captive) portal. Once the authentication credentials are obtained, further connections from this source are inspected without requiring authentication.
|
Rule Actions
|
From the toolbar at the top of the Application Control Policy page, click the icons to create new rules or to delete the selected rules.
If you right-click in a column of the Rule Base and select Rule Actions, a menu opens with these options:
- New Rule - Select to create a new rule Above or Below the rule that is currently selected.
- Delete Rule - Deletes the selected rule or rules.
- Disable Rule - The rule stays in the Rule Base but is not active.
- Select All Rules - Selects all the rules and you can then choose another action to apply to them.
- View rule logs in SmartView Tracker - Opens SmartView Tracker and shows logs related to the rule.
- View rule logs in SmartEvent - Opens SmartEvent and shows logs related to the rule.
|
|
Important - A rule that blockstraffic, with the and parameters defined as , also blocks traffic to and from the Captive Portal.
|

|
Note - The actions Block, Ask, and Inform involve the creation of UserCheck Interaction Objects.
|
Track
Choose if the traffic is logged in SmartView Tracker or if it triggers other notifications. Click in the column and the options open. The options include:
- - Does not record the event
- - Records the event in SmartView Tracker with byte information.
- - Logs the event and runs a command, such as display a popup window, send an email alert or an SNMP trap alert, or run a user-defined script as defined in >>>.
- - Sends an email to the administrator, or runs the mail alert script defined in >>>.
- - Sends a SNMP alert to the SNMP GUI, or runs the script defined in >>>.
- - Sends one of three possible customized alerts. The alerts are defined by the scripts specified in >>>.
Install On
Choose which Security Gateways the rule will be installed on. The default is All, which means all Security Gateways that have Application Control enabled. Put your mouse in the column and a plus sign shows. Click the plus sign to open the list of available Security Gateways and select.
Time
You can add a object to a rule to make the rule active only during specified times. If you do not include a Time object in a rule, the rule is always active.
You can include multiple Time objects in a rule in these ways:
- Select each Time object to include it.
- Create a that includes multiple Time objects.
When you have multiple Time objects or a Time Group, each Time object works independently. For example, if a rule has two Time objects:
- One shows that the rule is active on Mondays.
- One shows that the rule is active from 9:00 - 17:00.
The rule is active each day from 9:00 - 17:00 and all day on Mondays. For the rule to be active from 9:00 - 17:00 on Mondays only, make one Time object that contains all of the criteria.
If Time objects were created from a different tab in SmartDashboard, you can also use them in the Application Control and URL Filtering Rule Base. For example, you can create Time objects from the Firewall Rule Base or from menu >
To add Time objects to a rule:
- In the column of a rule, right click and select .
- Select from the available objects and click .
To create a new Time object from the Application Control and URL Filtering Rule Base:
- In the column of a rule, right click and select .
- Click and select Time.
- In the pane, enter a without spaces.
- In the pane, select one or more options:
- - Select a date and time when the rule starts to be active and expires.
- - Select hours of the day when the rule is active.
- - Select days of the week or month when the rule is active. The default is .
- Click .
- Click to add the object to the selected rule.
|
Note - The relevant time zone is that of the Security Gateway enforcing the rule. If Security Gateways are in different time zones, they enforce the same time object rules at different times.
|
Limit Objects
Use the action in rules to limit the bandwidth that is permitted for a rule in the Application Control and URL Filtering Rule Base. Configure a maximum throughput for uploads and downloads. The Limit action makes sure that employee use of the internet does not impede important business tasks.
You can add one Limit object to a rule. It can include upload and download rates.
- - From the internet to the organization.
- - From the organization to the internet.
When the limit is reached, the gateway begins to drop packets. The Application Control logs show dropped packets.
To add a Limit object to a rule:
- In the Application Control and URL Filtering Rule Base, right-click in the column and select .
- Select a limit to add from the list shown or select to create a new Limit object.
- if creating a new Limit object, in the window:
- Enter a without spaces.
- Select , , or the two of them.
- For each selected option, select a number and unit to define the maximum permitted bandwidth for that action.
- Click .
The Limit is added to the rule.
|
Note - The Security Gateway implements the Limit action by dropping successive packets which exceed the allowed bandwidth.
|
Analyzing the Rule Base (Hit Count)
Use the Hit Count feature to track the number of connections that each rule matches. You can show Hit Count for the rules in these options:
- The percentage of the rule hits from total hits
- The indicator level (very high, high, medium, low, or zero)
These options are configured in the Firewall Rule Base and also changes how Hit Count is shown in other supported Software Blades.
When you enable Hit Count, the Security Management Server collects the data from supported Security Gateways (from version R75.40 and up). Hit Count works independently from logging and tracks the hits even if the option is .
You can use the Hit Count data to:
- Analyze a Rule Base - You can delete rules that have no matching connections
|
Note - If you see a rule with a zero hit count it only means that in the Security Gateways enabled with Hit Count there were no matching connections. There can be matching connections on other Security Gateways.
|
- Better Firewall performance - You can move a rule that has a high hit count to a higher position in the Rule Base
- Better understand the behavior of the security Policy
Enabling or Disabling Hit Count
By default, Hit Count is globally enabled for all supported Security Gateways (from R75.40). The timeframe setting that defines the data collection time range is configured globally. If necessary, you can disable Hit Count for one or more Security Gateways.
After you enable or disable Hit Count you must install the Policy for the Security Gateway to start or stop collecting data.
To enable or disable Hit Count globally:
- From the menu, select .
- Select from the tree.
- Select the options:
- Select to enable or clear to disable all Security Gateways to monitor the number of connections each rule matches.
- Select one of the time range options. The default is 6 months. Data is kept in the Security Management Server database for this period and is shown in the Hits column.
- Click and then install the Policy.
To enable or disable Hit Count on each Security Gateway:
- From the for the Security Gateway, select from the navigation tree.
- Select to enable the feature or clear it to disable Hit Count.
- Click and then install the Policy.
Configuring the Hit Count Display
These are the options you can configure for how matched connection data is shown in the column:
- - Shows the number of matched hits for the rule from supported Security Gateways. Connection hits are not accumulated in the total hit count for:
- Security Gateways that are not supported (versions before R75.40)
- Security Gateways that have disabled the hit count feature
The values are shown with these letter abbreviations:
- K = 1,000
- M = 1,000,000
- G = 1,000,000,000
- T = 1,000,000,000,000
For example, 259K represents 259 thousand connections and 2M represents 2 million connections.
- Shows the percentage of the number of matched hits for the rule from the total number of matched connections. The percentage is rounded to a tenth of a percent.
- The hit count level is a label for the range of hits according to the table.
The hit count range = Maximum hit value - Minimum hit value (does not include zero hits)
Hit Count Level
|
Icon
|
Range
|
Zero
|

|
0 hits
|
Low
|

|
Less than 10 percent of the hit count range
|
Medium
|

|
Between 10 - 70 percent of the hit count range
|
High
|

|
Between 70 - 90 percent of the hit count range
|
Very High
|

|
Above 90 percent of the hit count range
|
To configure the Hit Count display:
- Right-click the column header or the rule number in the row.
- From the menu, select .
- Select one or more options:
Configuring the Hit Count Timeframe
The values shown in the Hits column are based on the Timeframe setting. By default, the timeframe is cumulative according to the parameter in the Global Settings. For example, if the parameter is configured to 6 months, the available timeframe options are 1 month, 3 months, and 6 months.
You can change the timeframe according to intervals based on the Global Settings parameter.
To configure the hit count timeframe:
- Right-click the column header or the rule number in the row.
- From the menu, select .
- Select the timeframe.
Refreshing the Hit Count Data
Hit count data is transferred from the Security Gateways to the Security Management Server at three hour intervals for each rule. When you refresh the hit count data, you get updated data from the Security Management Server database and not directly from the Security Gateways.
After you install a Policy, the hit count is updated from each Security Gateway in the Policy to the Security Management Server database. This is done at one minute intervals for the first 3 minutes after the Policy is installed.
To refresh hit count data in the Firewall Rule Base:
- Right-click the column header or the rule number in the row.
- From the menu, select > .
To refresh hit count data in the Application and URL Filtering Rule Base:
Click the refresh hits button  in the Policy toolbar. in the Policy toolbar.
UserCheck Interaction Objects
UserCheck Interaction Objects add flexibility to Application and URL Filtering by giving the Security Gateway a mechanism to communicate with users. UserCheck objects are used in the Application and URL Filtering Rule Base to:
- Help users with decisions that can be dangerous to the organization security.
- Share the organization changing internet policy for web applications and sites with users, in real-time.
If a UserCheck object is set as the action on a policy rule, the browser redirects to the web portal on port 443 or 80. The portal hosts UserCheck notifications.
The UserCheck client adds the option to send notifications for applications that are not in a web browser, such as Skype, iTunes, or browser add-ons (such as radio toolbars). The UserCheck client can also work together with the UserCheck portal to show notifications on the computer itself when:
- The notification cannot be displayed in a browser, or
- The UserCheck engine determines that the notification will not be shown correctly in the browser and the for the UserCheck object is .
For more about configuring UserCheck on the gateway and the UserCheck client, see Configuring UserCheck.
Creating UserCheck Interaction Objects
Create a UserCheck Interaction object from the Rule Base or from the page of the Application and URL Filtering tab. The procedure below shows how to create the object from the Rule Base.
To create a UserCheck object that includes a message:
- In the > rule base > column, select one of these interaction modes:
- - Show an informative message users. Users can continue to the application or cancel the request.
- - Show a message to users that asks them if they want to continue with the request or not.
- - Show a message to users and block the application request.
- Select or one of the existing UserCheck Interaction objects.
If you selected , the window opens on the page.
- Enter a name for the UserCheck object and, optionally, a comment.
- Select a language (English is the default) from the tabs.
- Click the box to add a graphic, such as company logo.
Note - The graphic must have a height and width of 176 x 52 pixels.
- Click the text box adjacent to the picture and enter title text for the message.
Note - Right-clicking inside any of the text boxes gives you the option to Switch to HTML mode and enter HTML code directly. Switching to HTML mode closes the formatting toolbar.
- In the page title, message subject, and message body text boxes, enter the message content. You can:
- Use the formatting toolbar to change text color, alignment, add or remove bullets.
- variables for:
- Application name
- Category
- Username
- Original URL
- Source IP
- Incident ID
Variables are replaced with applicable values when the (Block, Ask, Inform) action occurs and the message shows. The Username can only be displayed if the Identity Awareness blade is enabled.
- Use the variable to add a:
- - Users select a checkbox to continue
- - Users can enter an explanation for their activity or other text according to the instructions. Edit the default text in the Textual Input box based on your business needs.
- - Users can click a link to report that an incorrect category was included in the message. Use this field with the variable.
- Optional: Click to see the results in your default browser.
- Click
This creates the UserCheck object and web page notification for the portal.
Localizing and Customizing the UserCheck Portal
After you set the UserCheck interaction object language, you can translate the Portal OK and Cancel buttons to the applicable language. For more information, see: sk83700.
UserCheck Frequency and Scope
You can set the number of times that users get UserCheck messages for accessing applications that are not permitted by the policy. You can also set if the notifications are based on accessing the rule, application category, or application itself.
To set how often UserCheck notifications show
- Select from the column of a rule in the policy. The options are:
- Select a option from the column of a rule in the policy. This sets if the notifications are based on accessing the:
- For this rule
- For each category
- For each application
Example:
In a rule that contains:
Applications/Sites
|
Action
|
Social Networking category
|
Inform
|
If you select , as the and for:
A user who accesses Facebook and then LinkedIn on the same day gets one Informmessage.
If you select , as the and for:
A user who accesses Facebook and then LinkedIn on the same day gets one Informmessage for Facebook and one for LinkedIn.
In new installations, the default is .
In upgrades from a version before R75.40, the default is
More UserCheck Interaction Options
For each UserCheck Interaction object you can configure these options from the UserCheck Interaction window:
- - Set a language for the UserCheck message if the language setting in the user browser cannot be determined or is not implemented. For example:
- If the browser native language is Spanish
- The UserCheck message is in Japanese and French
- You select Japanese as the default language
Then the notification displays in Japanese.
- - Select an alternative action (allow or block) for when the UserCheck notification cannot be shown in the browser or application that caused the notification. If UserCheck determines that the notification cannot be shown in the browser or application, the behavior is:
- If the is (the default for Inform messages), the user is allowed to access the website or application, and the UserCheck client (if installed) shows the notification.
- If the is , the gateway tries to show the notification in the application that caused the notification. If it cannot and the UserCheck client is installed, it shows the notification through the client. The website or application is blocked, even if the user does not see the notification.
- - Select this to redirect users to an external portal, not on the gateway.
- - Enter the URL for the external portal. The specified URL can be an external system that obtains authentication credentials from the user, such as a user name or password. It sends this information to the gateway.
- - An incident ID is added to the end of the URL query.
The URL template field points to an XML file. This file should be placed on the external portal so that it can be sent back to the Security Gateway when called. The pre-shared secret authenticates the external portal to the Security Gateway.
- - Select actions that must occur before users can access the application. Select one or more of these options:
- - This applies if the UserCheck message contains a checkbox ( > ). Users must accept the text shown and select the checkbox before they can access the application.
- - This applies if the UserCheck message contains a text field ( > ). Users must enter text in the text field before they can access the application. For example, you might require that users enter an explanation for use of the application.
UserCheck Page
On the UserCheck page, you can create, edit, and preview UserCheck interaction objects and their messages.
Item
|
Meaning
|
|
|
Creates a new UserCheck object
|
|
|
Modifies an existing UserCheck object
|
|
|
Deletes an UserCheck object
|
|
|
Clones the selected UserCheck object.
|
These are the default UserCheck messages:
Name
|
Action Type
|
Description
|
Cancel Page
|
Cancel
|
Shows after a user gets an Inform or Ask message and clicks Cancel.
|
Blocked Message
|
Block
|
Shows when a request is blocked.
|
Access Notification
|
Inform
|
Shows when the action for the rule is It informs users what the company policy is for that site.
|
Company Policy
|
Ask
|
Shows when the action for the rule is . It informs users what the company policy is for that site and they must click to continue to the site.
|
and pages include a button that users can click to cancel the request.
For Threat Prevention and Application and URL Filtering, you can show these UserCheck message previews:
- - Shows a preview of the UserCheck message on a computer.
- - Shows a preview of the UserCheck message on a mobile device.
For DLP, you can also show these UserCheck message previews:
- - Shows a preview of the UserCheck message in an email.
- - Shows a preview of the UserCheck message in the DLP agent window.
The Application and URL Filtering Database
The Check Point Application and URL Filtering Database contains more than 4,500 applications and about 96 million categorized URLs.
For URL Filtering, each Security Gateway also has:
- A local database that contains commonly used URLs and their related categorization.
- A local cache that gives answers to 99% of URL categorization requests. When the cache does not have an answer, only the host name is sent to the Check Point Online Web Service for categorization. This maintains user privacy since no user parameters are sent for the categorization procedure.
Upon rule match in the Rule Base, it is necessary to determine if the URL is an application and its related category. To do this the Security Gateway does these steps:
- For URL Filtering: Goes to the local cache to see if the data is already there. If the category data is not in the cache, it checks the local database for the URL category.
For Application Control: Matches locally stored signatures. - For Application Control and URL Filtering: If the URL is suspected to be a widget or the category data is not in the cache, the Security Gateway accesses the Check Point Online Web Service.
Each item has a description, a category, additional categories, and a risk level. You can include applications and categories in your Application Control and URL Filtering rules. When you have a valid Application Control and/or URL Filtering contract, the database is updated regularly with new applications, categories and social networking widgets. This lets you easily create and maintain an up to date Policy.
Access the Application and URL Filtering Database from:
- SmartDashboard - From the Application Control Rule Base in SmartDashboard, click the plus sign in the Application column, and the Application viewer opens. From there you can add applications and categories directly into the Rule Base.
- AppWiki - An easy to use tool to see the Application and URL Filtering Database. Open it from the AppWiki pane in the Application and URL Filtering tab or from the Check Point website.
Security Category Updates
The local cache on each Security Gateway keeps URL categorization responses up to 3 days. In that time frame, it is possible that the initial categorization of a security category is updated on the Check Point Online Web Service. For example, a URL categorized as portal, is updated to phishing after 24 hours.
Changes made to URLs with security categories (such as phishing, malware, botnet, and spam) are updated in a security service list by the Check Point Online Web Service.
The local cache is updated on a regular basis depending on the category involved. For security related categories, such as phishing, there is a special update Policy that allows fast updates to occur.
Application Categories
In the Application and URL Filtering Database, each application is assigned to one based on its most defining aspect. See the category in the description of each application and in the logs.
In the Application and URL Filtering Database, each application can have , which are characteristics of the application. For example, some of the additional categories of Gmail include: Supports File Transfer, Sends mail, and Instant Chat. If an additional category is in a rule, the rule matches all applications that are marked with it.
|
Note - In the AppWiki, additional categories are called tags.
|
When you use the AppWiki or add applications to the Rule Base, you can filter by additional category or risk level to see all applications with that characteristic. This is a good way to get ideas of types of applications that you might want to block or allow.
If new applications are added to an additional category that is in an Application Control or URL Filtering rule, the rule is updated automatically when the database is updated.
Application Risk Levels
The Application and URL Filtering Database and AppWiki show a Risk Level for each application.
This table explains what each level means and gives examples of applications or types of applications with that level.
Risk Level
|
Definition
|
Examples
|
5 - Critical
|
Can bypass security or hide identities
|
Tor, VTunnel
|
4 - High
|
Can cause data leakage or malware infection without user knowledge
|
Remote Desktop, File Sharing, P2P (uTorrent, Kazaa)
|
3 - Medium
|
Can be misused and cause data leakage or malware infection
|
Instant messaging, File Storage (Drop box), WebEx, Gmail
|
2- Low
|
Potentially not business related, but low risk
|
Gaming, Facebook, YouTube, Media
|
1- Very Low
|
Usually business related with no or very low risk
|
SalesForce, Google Finance
|
You can filter a search based on the risk level. For example, select risk level 5 to see all applications with that risk level. The risk level is also a tag that shows in the details of each application. This helps you to understand which types of applications to be wary of and which are low risk.
Using the AppWiki
The AppWiki is an easy to use tool that lets you search and filter the Application and URL Filtering Database to find out information.
- Learn about applications, including social networking widgets.
- Filter by a category, tag, or risk level.
- Search for a word or application.
Access the AppWiki from the Application and URL Filtering tab or from the Check Point website.
Updating the Application and URL Filtering Database
The Application and URL Filtering Database automatically updates regularly to make sure that you have the most current data and newly added applications and websites in your Application Control and URL Filtering Policy. The Application and URL Filtering Database only updates if you have a valid Application Control and/or URL Filtering contract. By default, all new Application Control installations have a valid contract for 30 days.
By default, updates run on the Security Management Server and Security Gateways every two hours. You can change the update schedule or choose to manually update the management server. The updates are stored in a few files on each Security Gateway.
To manually update the management server only:
On the >pdates pane of the Application and URL Filtering tab, click Update Management to update the management only.
To change the schedule for updates on the management server and Security Gateways:
- Before you run the scheduled update, in the section of the Updates pane, select both:
When you update the database on the Security Management Server, you can see relevant database changes in SmartDashboard. If you only update the Security Gateways, you will see in SmartDashboard that the Security Gateway has a new version of the Application and URL Filtering Database.
- On the Updates pane, in the section, click Configure to schedule when the updates will run. By default, a scheduled update runs at two hour intervals.
In Multi-Domain Security Management, update the database for all Domain Management Servers in the Global SmartDashboard and not from Domain Management Servers.
Connecting to the Internet for Updates
The gateway or Security Management Server connects to the internet to get the Application and URL Filtering Database updates. To make sure that it can get the updates successfully:
- Make sure that there is a DNS server configured.
- Make sure a proxy is configured for each gateway and the Security Management Server, if necessary.
To configure a proxy:
- The > pane shows if the Security Management Server uses a proxy to connect to the internet or not. Click to go to the SmartDashboard page to configure the proxy for the Security Management Server.
- In SmartDashboard, in the object properties of a gateway or Security Management Server, go to Topology > Proxy.
- In a Multi-Domain Security Management environment, configure a proxy in Policy > Global Properties > Proxy.
To Configure IPv6 proxy support:
If the proxy uses an IPv6 address:
- Open .
- Open the .
- Create a new .
- Set the value to:
updates_over_IPv6=1.
Scheduling Updates
To change the update schedule from the default scheduled Application and URL Filtering Database updates:
- On the > pane, under Schedule Updates, click Configure.
The Scheduled Event Properties window opens.
- In the General page, set the Time of Event.
- Select Every and adjust the setting to run the update after an interval of time.
- Select At to set days of the week or month and a time of day for updates to occur:
- Enter an hour in the format that is shown.
- Click Days and the Days page opens. Select the days when the update will occur. If you select or , more options open for you to select.
- Click .
If you have Security Gateways in different time zones, they will not be synchronized when one updates and the other did not update yet.
The Application and URL Filtering Overview Pane
In the Application and URL Filtering Overview pane, you can quickly see the status of computers and incidents. Use the windows for the most urgent or commonly-used management actions.
My Organization
- Shows a summary of which Security Gateways enforce Application Control and URL Filtering. It also has a link to the pane.
- Shows the total number of rules in the Policy:
- The number of Allow rules. Click the link to see them.
- The number of Block rules. Click the link to see them.
Messages and Action Items
- Shows if a new Application and URL Filtering Database update package is available.
- Shows if Security Gateways require renewed licenses or Application Control or URL Filtering contracts.
Detected in My Organization
Shows a graphical summary of the most popular applications in , the most popular categories in and the most popular sites in .
- Select a time interval for graph data.
- Select the criteria for the graph data: Bandwidth or Sessions.
- Start SmartView Tracker button - Link to open the Application Control and URL Filtering logs in SmartView Tracker.
- Start SmartEvent button - Link to open SmartEvent where you can see the traffic statistics and analysis.
Top Users
Shows a graphical summary of the most popular users who use applications the most.
- Select a time interval for graphs data.
- Select the criteria for the graph data: Bandwidth or Sessions.
- Start SmartView Tracker button - Link to open the Application Control and URL Filtering logs in SmartView Tracker.
- Start SmartEvent button - Link to open SmartEvent where you can see the traffic statistics and analysis.
AppWiki
- Shows current statistics of the quantities and types of Applications and Social Networking Widgets included in the Application and URL Filtering Database.
- Click the arrows to browse through the types of Social Networking Widgets.
- Click the links to go directly to the AppWiki.
The Security Gateway connects to the internet to get the most current AppWiki.
- Make sure that there is a DNS server configured.
- Make sure a proxy is configured for each gateway and the Security Management Server, if necessary.
GatewaysPane
The Gateways pane lists the gateways with Application Control and/or URL Filtering enabled. Select a gateway and click Edit to edit the gateway properties.
For each gateway, you see the gateway name and IP address. You also see these columns:
- Application Control - If Application Control is enabled.
- URL Filtering - If URL Filtering is enabled.
- Identity Awareness - If Identity Awareness is enabled, and if so, a summary of its Identity Awareness status.
- Update Status - If the Application and URL Filtering Database is up to date on the gateway or if an update is necessary.
- Comments - All relevant comments.
In the Application and URL Filtering Database Updates section, you can also see the status of the Application and URL Filtering Database on the Security Management Server. A message shows if the Management server is up to date or if a new update is available. Click to go to the Updates pane.
Applications/Sites Pane
The pane shows custom applications, sites, categories and groups that you defined. Select an object in the list and click to change its properties. You can use the toolbar buttons to create, look for, delete and import objects.
You can import a customized application binary file that Check Point creates for applications not in the Application and URL Filtering Database. This file contains a database of internal applications that are not necessarily web-based.
For each object in the list, you see the name and type and also:
- - If the object is an application or website, this column shows the primary category assigned to it.
- - The comment entered for the custom-defined object.
Creating Applications or Sites
You can create a custom application or site to use in the Rule Base. You can enter the URLs manually or use a .csv (comma separated values) file to add many URLs at one time from an external source.
The .csv file syntax is one URL for each line in the text file. When you use the .csv file option, the URLs are imported when you click . If it is necessary to edit the URLs, click the Applications/Site object in the list and click Edit.
To create an application or site:
- In the pane, click.
The Application/Site wizard opens.
- Enter a name for the application/site.
- Select one of the options:
- - To manually enter a URL.
- - To upload a .csv file with URLs.
- Click .
- If you selected :
- Enter a URL and click .
- If you used a regular expression in the URL, click .
Note - Select the checkbox only if the application or site URL is entered as a regular expression using the correct syntax.
- Click and go to step 7.
- If you selected :
- Browse to the .csv file and upload it.
- Click .
- Select a for the application or site.
Note - You can click New in the list to create a new category.
- To select :
- Click .
- Select the necessary checkboxes in the list.
- Click .
- Click .
- Click.
You can use this custom application or site in the Policy.
Creating Categories
You can create a custom category to use in the Rule Base if there is no corresponding category.
|
Note - If category data in the Application and URL Filtering Database for a URL is not applicable for your organization, you can override the categorization.
|
To create a new category:
- In the pane, click>.
The Category Properties window opens.
- Enter a name for the category.
- Set a color for the category icon (optional).
- Enter a description for the category (optional).
- Click .
You can use this custom category object in the Policy.
Creating Application or Site Groups
You can create a group of applications or sites to use in the Rule Base. The group members can include categories, applications and widgets from the Application and URL Filtering Database and also custom applications, sites and categories.
To create an application or site group:
- In the pane, click>.
The Applications/Sites group window opens.
- Enter a name for the group.
- Set a color for the group icon (optional).
- Enter a comment for the group (optional).
- Click .
The Application viewer opens.
- Select the categories, applications, widgets, and custom items to add as members to the group.
- Click .
The selected items are shown in the Group members list.
- Click .
You can use this group in the Policy.
Exporting and Importing Applications or Sites
You can import Check Point custom applications for Application Control from the pane. These are signatures that Check Point creates for organizations that have network applications not in the Application and URL Filtering Database (for example, proprietary applications). After importing the file, you can include them in your Rule Base. The custom applications have an .apps suffix.
To import an application or site file:
- From the pane, select .
The window opens.
- Browse to the location of the .apps file, select it and click .
- Click .
The Custom Application object is added to the Applications/Sites list.
Advanced Settings for Application and URL Filtering
This section describes settings that you can configure in the tab, in the section of the navigation tree. These settings apply globally for all Security Gateways with Application Control and URL Filtering.
HTTP Inspection on Non-Standard Ports
Applications that use HTTP normally send the HTTP traffic on TCP port 80. Some applications send HTTP traffic on other ports also. You can configure some Software Blades to only inspect HTTP traffic on port 80, or to also inspect HTTP traffic on non-standard ports.
When selected, the Application and URL Filtering policy inspects all HTTP traffic, even if it is sent using non-standard ports. This option is selected by default. You can configure this option in the Advanced section of the Application and URL Filtering tab.
You can also configure IPS to inspect HTTP traffic on non-standard ports.
Overriding Categorization
In some cases, the category data in the Application and URL Filtering Database for a URL is not applicable for your organization. You can use the option to update the category and risk definitions of a URL.
This definition overrides the information in the Application and URL Filtering Database and the responses received from the Check Point Online Web Service. The Rule Base will use the newly specified categorization when matching rules with URLs.
You can use the toolbar buttons to create, edit, search, and delete a categorization entry.
To override categorization for a URL:
- In the pane, select .
The Override Categorization for URL window opens.
- Enter a in the field. You do not need to include the prefix
http:\\. - If the URL contains a regular expression, select .
- Enter a comment (optional).
- Select a from the list.
- Select a from the list.
- To add , click .
- Select the categories and click .
The selected categories are shown in the list.
- Click .
The URL with its newly defined categories is shown in the list in the Override Categorization pane.
HTTPS Inspection
You can enable HTTPS traffic inspection on Security Gateways to inspect traffic that is encrypted by the Secure Sockets Layer (SSL) protocol. SSL secures communication between internet browser clients and web servers. It supplies data privacy and integrity by encrypting the traffic, based on standard encryption ciphers.
However, SSL has a potential security gap. It can hide illegal user activity and malicious traffic from the content inspection of Security Gateways. One example of a threat is when an employee uses HTTPS (SSL based) to connect from the corporate network to internet web servers. Security Gateways without HTTPS Inspection are unaware of the content passed through the SSL encrypted tunnel. This makes the company vulnerable to security attacks and sensitive data leakage.
The SSL protocol is widely implemented in public resources that include: banking, web mail, user forums, and corporate web resources.
There are two types of HTTPS inspection:
- - To protect internal servers from malicious requests originating from the internet or an external network.
- - To protect an organization from malicious traffic being sent by an internal client to a destination outside of the organization.
The Security Gateway acts as an intermediary between the client computer and the secure web site. The Security Gateway behaves as the client with the server and as the server with the client using certificates.
All data is kept private in HTTPS Inspection logs. This is controlled by administrator permissions. Only administrators with HTTPS Inspection permissions can see all the fields in a log. Without these permissions, some data is hidden.
How it Operates
In outbound HTTPS inspection, when a client in the organization initiates an HTTPS connection to a secure site, the Security Gateway:
- Intercepts the request.
- Establishes a secure connection to the requested web site and validates the site server certificate.
- Creates a new SSL certificate for the communication between the Security Gateway and the client, sends the client the new certificate and continues the SSL negotiation with it.
- Using the two SSL connections:
- It decrypts the encrypted data from the client.
- Inspects the clear text content for all blades set in the Policy.
- Encrypts the data again to keep client privacy as the data travels to the destination web server resource.
In inbound HTTPS inspection, when a client outside of the organization initiates an HTTPS connection to a server behind the organization's gateway, the Security Gateway:
- Intercepts the request.
- Uses the server's original certificate and private key to initiate an SSL connection with the client.
- Creates and establishes a new SSL connection with the web server.
- Using the two SSL connections:
- It decrypts the encrypted data from the client.
- Inspects the clear text content for all blades set in the policy.
- Encrypts the data again to keep client privacy as the data travels to the destination server behind the gateway.
Configuring Outbound HTTPS Inspection
To enable outbound HTTPS traffic inspection, you must do these steps:
Enabling HTTPS Inspection
You must enable HTTPS inspection on each Security Gateway. From > > > Select .
The first time you enable HTTPS inspection on one of the Security Gateways, you must create an outbound CA certificate for HTTPS inspection or import a CA certificate already deployed in your organization. This outbound certificate is used by all Security Gateways managed on the Security Management Server.
Creating an Outbound CA Certificate
The outbound CA certificate is saved with a P12 file extension and uses a password to encrypt the private key of the file. The Security Gateways use this password to sign certificates for the sites accessed. You must keep the password as it also used by other Security Management Servers that import the CA certificate to decrypt the file.
After you create an outbound CA certificate, you must export it so it can be distributed to clients. If you do not deploy the generated outbound CA certificate on clients, users will receive SSL error messages in their browsers when connecting to HTTPS sites. You can configure a troubleshooting option that logs such connections.
After you create the outbound CA certificate, a certificate object named Outbound Certificate is created. Use this in rules that inspect outbound HTTPS traffic in the HTTPS inspection Rule Base.
To create an outbound CA certificate:
- In SmartDashboard, right-click the Security Gateway object and select Edit.
The Gateway Properties window opens.
- In the navigation tree, select .
- In the HTTPS Inspection page, click .
- Enter the necessary information:
- - Enter the domain name of your organization.
- - Enter the password that is used to encrypt the private key of the CA certificate.
- - Retype the password.
- - Select the date range for which the CA certificate is valid.
- Click .
- Export and deploy the CA certificate.
Importing an Outbound CA Certificate
You can import a CA certificate that is already deployed in your organization or import a CA certificate created on one Security Management Server to use on another Security Management Server.
|
|
|
|
|
Note - It is recommended that you use private CA Certificates.
|
|
Important - If you are importing a CA certificate created on another Security Management Server, make sure the initial certificate was exported from the Security Management Server on which it was created.
|
For each Security Management Server that has Security Gateways enabled with HTTPS inspection, you must:
- Import the CA certificate.
- Enter the password the Security Management Server uses to decrypt the CA certificate file and sign the certificates for users. This password is only used when you import the certificate to a new Security Management Server.
|
Important - After you import a certificate from another Security Management Server, make sure to export the certificate and deploy it on the client machines if it has not already been deployed.
|
To import a CA certificate:
- In SmartDashboard, right-click a Security Gateway object, select > >
Or
From the > Gatewayspane of a supported blade, click the arrow next to Create Certificate and select .
The Import Outbound Certificate window opens.
- Browse to the certificate file.
- Enter the .
- Click .
Exporting a Certificate from the Security Management Server
If you use more than one Security Management Server in your organization, you must first export the CA certificate using the export_https_cert CLI command from the Security Management Server on which it was created before you can import it to other Security Management Servers.
Usage:
export_https_cert [-local] | [-s server] [-f certificate file name under FWDIR/tmp][-help]
To export the CA certificate:
Exporting and Deploying the Generated CA
To prevent users from getting warnings about the generated CA certificates that HTTPS inspection uses, install the generated CA certificate used by HTTPS inspection as a trusted CA. You can distribute the CA with different distribution mechanisms such as Windows GPO. This adds the generated CA to the trusted root certificates repository on client computers.
When users do standard updates, the generated CA will be in the CA list and they will not receive browser certificate warnings.
To distribute a certificate with a GPO:
- From the window of the Security Gateway, click
Or
From the > pane in a supported blade, click .
- Save the CA certificate file.
- Use the Group Policy Management Console to add the certificate to the Trusted Root Certification Authorities certificate store.
- Push the Policy to the client computers in the organization.
Note - Make sure that the CA certificate is pushed to the client computer organizational unit.
- Test the distribution by browsing to an HTTPS site from one of the clients and verifying that the CA certificate shows the name you entered for the CA certificate that you created in the field.
Deploying Certificates by Using Group Policy
You can use this procedure to deploy a certificate to multiple client machines by using Active Directory Domain Services and a Group Policy object (GPO). A GPO can contain multiple configuration options, and is applied to all computers that are within the scope of the GPO.
Membership in the local Administrators group, or equivalent, is necessary to complete this procedure.
To deploy a certificate using Group Policy:
- Open the Group Policy Management Console.
- Find an existing GPO or create a new GPO to contain the certificate settings. Make sure the GPO is associated with the domain, site, or organization unit whose users you want affected by the policy.
- Right-click the GPO and select .
The Group Policy Management Editor opens and shows the current contents of the policy object.
- Open > > > > .
- Click > .
- Do the instructions in the to find and import the certificate you exported from SmartDashboard.
- In the navigation pane, click and repeat steps 5-6 to install a copy of the certificate to that store
Configuring Inbound HTTPS Inspection
To enable inbound HTTPS traffic inspection, you must do these steps:
- Set the Security Gateway for HTTPS Inspection (if it is not already configured). From > > > Select .
- Import server certificates for servers behind the organization Security Gateways.
- Generate an HTTPS inspection policy by defining relevant rules in the HTTPS inspection Rule Base.
- Make sure to configure the relevant server certificate in the HTTPS inspection Rule Base.
Server Certificates
When a client from outside the organization initiates an HTTPS connection to an internal server, the Security Gateway intercepts the traffic. The Security Gateway inspects the inbound traffic and creates a new HTTPS connection from the gateway to the internal server. To allow seamless HTTPS inspection, the Security Gateway must use the original server certificate and private key.
For inbound HTTPS inspection, do these steps:
- Add the server certificates to the Security Gateway - This creates a server certificate object.
- Add the server certificate object to the column in the HTTPS Inspection Policy to enforce it in rules.
The Server Certificates window in SmartDashboard includes these options:
- - Import a new server certificate. Enter a name for the server certificate, optional comment and import the P12 certificate file.
- - Delete a previously added server certificate. This option does not delete the server certificate option. It only removes it from the Server Certificate list.
- - Enter a key word to search for a server certificate in the list.
Adding a Server Certificate
When you import a server certificate, enter the same password that was entered to protect the private key of the certificate on the server. The Security Gateway uses this certificate and the private key for SSL connections to the internal servers.
After you import a server certificate (with a P12 file extension) to the Security Gateway, make sure you add the object to the HTTPS Inspection Policy.
Do this procedure for all servers that receive connection requests from clients outside of the organization.
To add a server certificate:
- In SmartDashboard, open > .
- Click .
The Import Certificate window opens.
- Enter a and a (optional).
- Browse to the certificate file.
- Enter the .
- Click .
The Successful Import window opens the first time you import a server certificate. It shows you where to add the object in the HTTPS Inspection Rule Base. Click if you do not want to see the window each time you import a server certificate and .
The HTTPS Inspection Policy
The HTTPS inspection policy determines which traffic is inspected. The primary component of the policy is the Rule Base. The rules use the categories defined in the Application and URL Filtering Database, network objects and custom objects (if defined).
The HTTPS Rule Base lets you inspect the traffic on other network blades. The blades that HTTPS can operate on are based on the blade contracts and licenses in your organization and can include:
- Application Control
- URL Filtering
- IPS
- DLP
- Anti-Virus
- Anti-Bot
If you enable Identity Awareness on your gateways, you can also use Access Role objects as the source in a rule. This lets you easily make rules for individuals or different groups of users.
To access the HTTPS inspection Rule Base:
- In SmartDashboard, open the Policy page from the specified blade tab:
- For Application and URL Filtering, Anti-Bot, Anti-Virus, and IPS - Select > > .
- For DLP - Select > >.
Predefined Rule
When you enable HTTPS inspection, a predefined rule is added to the HTTPS Rule Base. This rule defines that all HTTPS and HTTPS proxy traffic from any source to the internetis inspected on all blades enabled in the Blade column. By default, there are no logs.

Parts of the Rule
The columns of a rule define the traffic that it matches and if that traffic is inspected or bypassed. When traffic is bypassed or if there is no rule match, the traffic continues to be examined by other blades in the Security Gateway.
Number (No.)
The sequence of rules is important because the first rule that matches is applied.
For example, if the predefined rule inspects all HTTPS traffic from any category and the next rule bypasses traffic from a specified category, the first rule that inspects the traffic is applied.
Name
Give the rule a descriptive name. The name can include spaces.
Double-click in the Name column of the rule to add or change a name.
Source
The source is where the traffic originates. The default is Any.
|
Important - A rule that blockstraffic, with the and parameters defined as , also blocks traffic to and from the Captive Portal.
|
Put your mouse in the column and a plus sign shows. Click the plus sign to open the list of network objects and select one or multiple sources. The source can be an Access Role object, which you can define when Identity Awareness is enabled.
Destination
Choose the destination for the traffic. The default is the , which includes all traffic with the destination of DMZ or external. If you delete the destination value, the rule changes to , which applies to traffic going to all destinations
|
Important - A rule that blockstraffic, with the and parameters defined as , also blocks traffic to and from the Captive Portal.
|
To choose other destinations, put your mouse in the column and a plus sign shows. Click the plus sign to open the list of network objects and select one or multiple destinations.
Services
By default, HTTPS traffic on port 443 and HTTP and HTTPS proxy on port 8080 is inspected. You can include more services and ports in the inspection by adding them to the services list.
To select other HTTPS/HTTP services, put your mouse in the column and a plus sign shows. Click the plus sign to open the list of services and select a service. Other services, such as SSH are not supported.
Site Category
The Site Category column contains the categories for sites and applications that users browse to and you choose to include. One rule can include multiple categories of different types.
|
Important -
- A valid URL Filtering blade contract and license are necessary on the relevant Security Gateways to use the Site Category column.
- To perform categorization correctly, a single connection to a site must be inspected in some cases regardless of the HTTPS inspection policy. This maps the IP address of a site to the relevant domain name.
|
You can also include custom applications, sites, and hosts. You can select a custom defined application or site object with the Custom button or create a new host or site with the New button at the bottom of the page.
|
Note - You can only use custom objects that specify the domain name or host part of a URL. URLs that contain paths are not supported. For example, you can use an object defined as ww.gmail.com but not www.gmail.com/myaccount.
|
To add site categories to a rule:
Put your mouse in the column and a plus sign shows. Click the plus sign to open the Category viewer. For each category, the viewer shows a description and if there are applications or sites related with it.
- To filter the Available list by categories or custom-defined sites, click the specified button in the toolbar of the viewer. The Available list opens in the left column and then you can add items to the rule.
- To add a category object to the rule, click the checkbox in the Available list.
- To see the details of category without adding it to the rule, click the name of the item in the Available list.
- You can only select a category to add to the rule from the Available list.
- If a category is already in a rule, it will not show in the Category viewer.
- If you know the name of a category, you can search for it. The results will show in the Available list.
- You can add a new host site with the New button.
Adding a New Host Site
You can create a new host site object to use in the HTTPS Rule Base if there is no corresponding existing category. Only the domain name part or hosts part of the URL is supported.
To create a new host site:
- Click the plus icon in the Site Category column.
- In the Category viewer, select .
The window opens.
- Enter a name for the host site.
- Set a color for the host site icon (optional).
- Enter a comment for the host site (optional).
- In , enter a valid URL and click .
- If you used a regular expression in the URL, click .
- Click .
The new host site is added to the list and can be added to the Rule Base.
Action
The action is what is done to the traffic. Click in the column to see the options and select one to add to the rule.
- - The traffic is inspected on the blades set in the column.
- - The traffic of source and destination traffic in rules that include the bypass action are not decrypted and inspected. You can bypass HTTPS inspection for all Check Point objects. This is recommended for Anti-Bot, Anti-Virus, URL Filtering, and IPS updates. Other HTTPS protections that already operate on traffic will continue to work even when the HTTPS traffic is not decrypted for inspection.
Track
Choose if the traffic is logged in SmartView Tracker or if it triggers other notifications. Click in the column and the options open. The options include:
- - Does not record the event
- - Records the event details in SmartView Tracker. This option is useful for obtaining general information on your network traffic. There is one or more log for each session depending on the suppression option.
- - Logs the event and executes a command, such as display a popup window, send an email alert or an SNMP trap alert, or run a user-defined script as defined in >>>
- - Sends an email to the administrator, or runs the mail alert script defined in >>>
- - Sends a SNMP alert to the SNMP GUI, or runs the script defined in >>>
- - Sends one of three possible customized alerts. The alerts are defined by the scripts specified in >>>
Blade
Choose the blades that will inspect the traffic. Click in the column and the options open. The options include:
- Application Control
- Data Loss Prevention
- IPS
- URL Filtering
- Anti-Virus
- Anti-Bot
|
Important - The blade options you see are based on the blade contracts and licenses in your organization.
|
Install On
Choose which Security Gateways the rule will be installed on. The default is All, which means all Security Gateways that have HTTPS inspection enabled. Put your mouse in the column and a plus sign shows. Click the plus sign to open the list of available Security Gateways and select.
Certificate
Choose the certificate that is applicable to the rule. The Security Gateway uses the selected certificate for communication between the Security Gateway and the client.
- - choose the object (default) that reflects the CA certificate you created/imported and deployed on the client machines in your organization.
- - choose the server certificate applicable to the rule. Put your mouse in the column and a plus sign shows. Click the plus sign to open the list of available server certificates and select one. When there is a match to a rule, the Security Gateway uses the selected server certificate to communicate with the source client. You can create server certificates from > > .
Bypassing HTTPS Inspection to Software Update Services
Check Point dynamically updates a list of approved domain names of services from which content is always allowed. This option makes sure that Check Point updates or other 3rd party software updates are not blocked. For example, updates from Microsoft, Java, and Adobe.
To bypass HTTPS inspection to software updates:
- In the HTTPS Inspection > Policy pane, select. This option is selected by default.
- Click to see the list of approved domain names.
Gateways Pane
The pane lists the gateways with HTTPS Inspection enabled. Select a gateway and click Edit to edit the gateway properties. You can also search, add and remove Security Gateways from here.
For each gateway, you see the gateway name, IP address and comments.
In the CA Certificate section, you can the certificate validity date range if necessary and it for distribution to the organization client machines.
If the Security Management Server managing the selected Security Gateway does not have a generated CA certificate installed on it, you can add it with . There are two options:
- You can import a CA certificate already deployed in your organization.
- You can import a CA certificate from another Security Management Server. Before you can import it, you must first export it from the Security Management Server on which it was created.
Adding Trusted CAs for Outbound HTTPS Inspection
When a client initiates an HTTPS connection to a web site server, the Security Gateway intercepts the connection. The Security Gateway inspects the traffic and creates a new HTTPS connection from the Security Gateway to the designated server.
When the Security Gateway establishes a secure connection (an SSL tunnel) to the designated web site, it must validate the site server certificate.
HTTPS Inspection comes with a preconfigured list of trusted CAs. This list is updated by Check Point when necessary and is automatically downloaded to the Security Gateway. The system is configured by default to notify you when a Trusted CA update file is ready to be installed. The notification in SmartDashboard shows as a pop-up notification or in the window in the Automatic Updates section. After you install the update, make sure to install the policy. You can choose to disable the automatic update option and manually update the Trusted CA list.
If the Security Gateway receives a non-trusted server certificate from a site, by default the user gets a self-signed certificate and not the generated certificate. A page notifies the user that there is a problem with the website security certificate, but lets the user continue to the website.
You can change the default setting to block untrusted server certificates.
The trusted CA list is based on the Microsoft Root Certificate Program.
Automatically Updating the Trusted CA List and Certificate Blacklist
Updates for the trusted CA list and Certificate Blacklist will be published from time to time on the Check Point web site. They are automatically downloaded to the Security Management Server by default. When you are sent a notification that there is an update available, install it and do the procedure. The first notification is shown in a popup balloon once and then in the notification line under > . You can disable automatic updates if necessary.
To update the Trusted CA list and Certificate Blacklist:
- In SmartDashboard, select > .
- In the section, click .
You see the certificates that will be added or removed to the lists and the validity date range of the certificates added to the Trusted CA list.
- Click to confirm the update.
The certificates will be added or removed respectively from the lists.
- Install the Policy.
To disable automatic updates:
- In SmartDashboard, select > .
- In the section, clear the checkbox.
Manually Updating a Trusted CA
To add a trusted CA manually to the Security Gateway, you must export the necessary certificate from a non-trusted web site and then import it into SmartDashboard.
To export a CA certificate to add to the Trusted CAs list:
- Temporarily disable HTTPS inspection on the Security Gateway.
- Install the security policy.
- Browse to the site to get the certificate issued by the CA.
- Go to the Certification Path of the certificate.
- Select the root certificate (the top most certificate in the list).
- In Internet Explorer and Chrome:
- Click .
- From the Details tab, click .
- Follow the wizard steps.
- In Firefox, export the certificate.
To import a CA certificate to the Trusted CAs list:
- In SmartDashboard, open >.
- Click ,browse to the location of the saved certificate and click .
The certificate is added to the trusted CAs list.
- Install the security policy on Security Gateways enabled with HTTPS Inspection.
Saving a CA Certificate
You can save a selected certificate in the trusted CAs list to the local file system.
To export a CA certificate:
- In SmartDashboard, open > .
- Click > .
- Browse to a location, enter a file name and click .
A CER file is created.
HTTPS Validation
Server Validation
When a Security Gateway receives an untrusted certificate from a web site server, the settings in this section define when to drop the connection.
When selected, traffic from a site with an untrusted server certificate is immediately dropped. The user gets an error page that states that the .
When cleared, a self-signed certificate shows on the client machine when there is traffic from an untrusted server. The user is notified that there is a problem with the website security certificate, but lets the user to continue to the website (default).
When selected, the Security Gateway validates that each server site certificate is not in the Certificate Revocation List (CRL) (default).
If the CRL cannot be reached, the certificate is considered trusted (this is the default configuration). An HTTPS Inspection log is issued that indicates that the CRL could not be reached. This setting can be changed with GuiDBedit. Select > > and change the attribute drop_if_crl_cannot_be_reached from to .
To validate the CRL, the Security Gateway must have access to the internet. For example, if a proxy server is used in the organization environment, you must configure the proxy for the Security Gateway.
To configure the proxy:
- From the tab, double-click the Security Gateway that requires proxy configuration.
- Select > .
- Select and and enter the proxy IP address.
- Optionally, you can use the default proxy settings.
- Click .
When cleared, the Security Gateway does not check for revocations of server site certificates.
|
Important - Make sure that there is a rule in the Rule Base that allows outgoing HTTP from the Security Gateway.
|
- When selected, the Security Gateway drops the connection if the server certificate has expired.
- When cleared, the Security Gateway creates a certificate with the expired date. The user can continue to the website (default).
Choose if the server validation traffic is logged in SmartView Tracker or if it triggers other notifications. The options include:
- - Does not record the event.
- - Records the event details in SmartView Tracker
- - Logs the event and executes a command, such as shows a popup window, send an email alert or an SNMP trap alert, or run a user-defined script as defined in >>>
- - Sends an email to the administrator, or runs the mail alert script defined in >>>
- - Sends an SNMP alert to the SNMP GUI, or runs the script defined in >>>
- - Sends one of three possible customized alerts. The alerts are defined by the scripts specified in >>>
- When selected, intermediate CA certificates issued by trusted root CA certificates that are not part of the certificate chain are automatically retrieved using the information on the certificate (default).
- When cleared, a web server certificate signed by an intermediate CA and not sent as part of the certificate chain, is considered untrusted.
Certificate Blacklisting
You can create a list of certificates that are blocked. Traffic from servers using the certificates in the blacklist will be dropped. If a certificate in the blacklist is also in the Trusted CAs list, the blacklist setting overrides the Trusted CAs list.
- - Lets you add a certificate. Enter the certificate serial number (in hexadecimal format HH:HH) and a comment that describes the certificate.
- - Lets you change a certificate in the blacklist.
- - lets you delete a certificate in the blacklist.
- - Lets you search for a certificate in the blacklist.
Choose if the dropped traffic is logged in SmartView Tracker or if it triggers other notifications. The options include:
- - Does not record the event.
- - Records the event details in SmartView Tracker
- - Logs the event and executes a command, such as shows a popup window, send an email alert or an SNMP trap alert, or run a user-defined script as defined in >>>
- - Sends an email to the administrator, or runs the mail alert script defined in >>>
- - Sends an SNMP alert to the SNMP GUI, or runs the script defined in >>>
- - Sends one of three possible customized alerts. The alerts are defined by the scripts specified in >>>
Troubleshooting
Secure connections between a client and server with no traffic create logs in SmartView Tracker labeled as "Client has not installed CA certificate". This can happen when an application or client browser fails to validate the server certificate. Possible reasons include:
- The generated CA was not deployed on clients.
- The DN in the certificate does not match the actual URL (for example, when you browse to https://www.gmail.com, the DN in the certificate states mail.google.com).
- Applications (such as Firefox and anti-viruses) that use an internal trusted CA list (other than Windows). Adding the CA certificate to the Windows repository does not solve the problem.
The option in the HTTPS Validation pane:
- When selected, logs are recorded for secure connections between a client and server with no traffic in SmartView Tracker (default). Logs are recorded only when a server certificate is trusted by the Security Gateway. If the server certificate is untrusted, a self-signed certificate is created and always results in a log labeled as "Client has not installed CA certificate".
- When cleared, logs are not recorded for secure connections without traffic that can be caused by not installing the CA certificate on clients or one of the above mentioned reasons.
HTTP/HTTPS Proxy
You can configure a gateway to be an HTTP/HTTPS proxy. When it is a proxy, the gateway becomes an intermediary between two hosts that communicate with each other. It does not allow a direct connection between the two hosts.
Each successful connection creates two different connections:
- One connection between the client in the organization and the proxy.
- One connection between the proxy and the actual destination.
Proxy Modes
Two proxy modes are supported:
- - All HTTP traffic on specified ports and interfaces is intercepted and sent to a proxy. No configuration is required on the clients.
- - All HTTP/HTTPS traffic on specified ports and interfaces directed to the gateway is sent to a proxy. Configuration of the proxy address and port is required on client machines.
Access Control
You can configure one of these options for forwarding HTTP requests:
- - HTTP/HTTPS traffic from all internal interfaces is forwarded by proxy.
- - HTTP/HTTPS traffic from interfaces specified in the list is forwarded by proxy.
Ports
By default, traffic is forwarded only on port 8080. You can add or edit ports as required.
Advanced
By default, the HTTP header contains the proxy related header. You can remove this header with the option.
You can also use the Advanced option to configure the that contains the IP address of the client machine. It is not added by default because it reveals the internal client IP.
Logging
The Security Gateway opens two connections, but only the Firewall blade can log both connections. Other blades show only the connection between the client and the gateway. The Destination field of the log only shows the gateway and not the actual destination server. The Resource field shows the actual destination.
To configure a Security Gateway to be an HTTP/HTTPS proxy:
- From the window of a Security Gateway object, select from the tree.
- Select .
- Select the or proxy mode.
Note - If you select mode, make sure to configure the clients to work with the proxy.
- Select to forward HTTP requests from one of these options:
- - Click the plus sign to add specified interfaces or the minus sign to remove an interface.
- To enter more ports on which to forward traffic, select .
- To include the actual source IP address in the HTTP header, select > .
The X-Forward-For header must be configured if traffic will be forwarded to Identity Awareness Security Gateways that require this information for user identification.
- Click .
Security Gateway Portals
The Security Gateway runs a number of web-based portals over HTTPS:
- Mobile web access portal
- SecurePlatform WebUI
- Gaia WebUI
- Identity Awareness (Captive Portal)
- DLP portal
- SSL Network Extender portal
- UserCheck portal
- Endpoint Security portals (CCC)
All of these portals can resolve HTTPS hosts to IPv4 and IPv6 addresses over port 443.
These portals (and HTTPS inspection) support the latest versions of the TLS protocol. In addition to SSLv3 and TLS 1.0 (RFC 2246), the Security Gateway supports:
- TLS 1.1 (RFC 4346)
- TLS 1.2 (RFC 5246)
Support for TLS 1.1 and TLS 1.2 is enabled by default but can be disabled in SmartDashboard (for web-based portals) or GuiDBedit (for HTTPS Inspection).
To configure TLS protocol support for portals:
- In , open .
- In the section, click .
The window opens.
- On the page, set minimum and maximum versions for SSL and TLS protocols.
To Configure TLS Protocol Support for HTTPS inspection:
- In , on the tab, select .
- In the column, select .
- In the column, select the minimum and maximum TLS version values in these fields:
- (default = TLS 1.2)
- (default = SSLv3)
HTTPS Inspection in SmartView Tracker
Logs from HTTPS Inspection are shown in SmartView Tracker. There are two types of predefined queries for HTTPS Inspection logs in SmartView Tracker:
- HTTPS Inspection queries
- Blade queries - HTTPS Inspection can be applied to these blades:
- Application Control
- URL Filtering
- IPS
- DLP
- Anti-Virus
- Anti-Bot
To open SmartView Tracker do one of these:
- From the SmartDashboard toolbar, select Window > SmartView Tracker.
- Press Control +Shift +T.
HTTPS Inspection Queries
These are the predefined queries in Predefined > Network Security Blades > HTTPS Inspection.
- - Shows all HTTPS traffic that matched the HTTPS Inspection policy and was configured to be logged.
- Shows traffic with connection problems.
- Action values include rejected or detected. The actions are determined by the SSL validation settings for HTTPS Inspection.
- HTTPS Validation values include:
- - For general SSL protocol problems
Blade Queries
When applying HTTPS Inspection to a specified blade:
- There is an for each of the blades that can operate with HTTPS Inspection. The query shows all traffic of the specified blade that passed through HTTPS inspection.
- The log in the blade queries includes an . The field value can be inspect or bypass. If the traffic did not go through HTTPS inspection, the field does not show in the log.
Permissions for HTTPS Logs
An administrator must have HTTPS inspection permissions to see classified data in HTTPS inspected traffic.
To set permissions for an administrator in a new profile:
- In the Users and Administrators tree, select an administrator > Edit.
- In the > page in the field, click .
- In the window:
- Enter a for the profile.
- Select and click .
The window opens.
- In the tab, select for permission to see the classified information in the HTTPS Inspection logs.
- Click on all of the open windows.
To edit an existing permissions profile:
- From the SmartDashboard toolbar, select >.
- Select a profile and click .
- Follow the instructions above from step 3.
HTTPS Inspection in SmartEvent
Events from HTTPS Inspection are shown in SmartEvent. There are two types of predefined queries for HTTPS Inspection events in SmartEvent:
- HTTPS Inspection queries for HTTPS validations
- Blade queries - HTTPS Inspection can be applied to these blades:
- Application Control
- URL Filtering
- IPS
- DLP
- Anti-Virus
To open SmartEvent do one of these:
- From the SmartDashboard toolbar, select Window > SmartEvent.
- Press Control +Shift +T.
Event Analysis in SmartEvent
SmartEvent supplies advanced analysis tools with filtering, charts, reporting, statistics, and more, of all events that pass through enabled Security Gateways. SmartEvent shows all HTTPS Inspection events.
You can filter the HTTPS Inspection information for fast monitoring on HTTPS Inspection traffic.
- Real-time and history graphs of HTTPS Inspection traffic.
- Graphical incident timelines for fast data retrieval.
- Easily configured custom views to quickly view specified queries.
- Incident management workflow.
SmartEvent shows information for all Software Blades in the environment.
Viewing Information in SmartEvent
There are two types of predefined queries for HTTPS Inspection events in SmartEvent:
- HTTPS Inspection queries
- Blade queries
HTTPS Inspection Queries
- Go to >>> to shows the SSL validation events that occurred.
- The and in the event record show if the traffic was detected or rejected due to SSL Validation settings.
Blade Queries
- There is an for each of the blades that can operate with HTTPS Inspection. The query shows all traffic of the specified blade that passed through HTTPS inspection.
- The in the event record in the blade queries includes an . The field value can be inspect or bypass. If the traffic did not go through HTTPS inspection, the field does not show in the event record.
Engine Settings
On the > pane, configure settings related to engine inspection, the Check Point Online Web Service, Application Control and URL Filtering sessions, and compatibility with gateways from lower versions (Web Browsing application and session unification).
Fail Mode
Select the behavior of the Application Control and URL Filtering engine, if it is overloaded or fails during inspection. For example, if the application inspection is terminated in the middle for any reason. By default, in such a situation all application and site traffic is blocked.
- - All traffic is allowed in a situation of engine overload or failure.
- - All traffic is blocked in a situation of engine overload or failure (default).
Check Point Online Web Service
The Check Point Online Web Service is used by the URL Filtering engine for updated website categorization and by the Application Control engine for updated Widget definitions. The responses the Security Gateway gets are cached locally to optimize performance.
-
- When selected, requests are blocked when there is no connectivity to the Check Point Online Web Service.
- When cleared, requests are allowed when there is no connectivity (default).
- - You can select the mode that is used for website categorization:
- - When a request cannot be categorized with a cached response, an uncategorized response is received. Access to the site is allowed. In the background, the Check Point Online Web Service continues the categorization procedure. The response is then cached locally for future requests (default). This option reduces latency in the categorization procedure.
- - When a request cannot be categorized with the cached responses, it remains blocked until the Check Point Online Web Service completes categorization.
- -Lets you set different modes for URL Filtering and Social Networking Widgets. For example, click to set URL Filtering to Background mode and Social Networking Widgets to Hold mode.
- When selected, the Security Gateway connects to the Check Point Online Web Service to identify social networking widgets that it does not recognize (default).
- When cleared or there is no connectivity between the Security Gateway and the Check Point Online Web, the unknown widget is treated as Web Browsing traffic.
URL Filtering
You can enable these URL Filtering features:
- Categorize HTTPS sites (without activating HTTP inspection)
- Enforce safe search in search engines
- Categorize cached pages and translated pages in search engines.
Categorize HTTP sites
Selecting this option lets you categorize HTTPS sites without activating HTTPS inspection. Each site is filtered and categorized according to its Domain Name. When this option is enabled, the server certificate is detected and validated. If the certificate is:
Before extracting the Domain Name from the server certificate, the certificate is validated by checking it against the:
Fine tuning
Categorizing HTTPS sites according to DN can be fine-tuned by editing these properties in GuiDBedit:
urlf_ssl_cn_enc_http_services_only
Value
|
Meaning
|
False
|
The Security Gateway listens for SSL signatures on all ports
|
True
|
- The Security Gateway listens for SSL signatures only on those ports specified by the
enc_http services property. - By default,
enc_http services specifies only port 443. - New
enc_http services can be added to any port by creating a new service in SmartDashboard.
|
urlf_ssl_cn_max_server_hello_sizeThe maximum size of the certificate in bytes.
urlf_ssl_cn_wstlsd_ttlThe maximum amount of time to wait while the DN is being extracted from a certificate. After the default value expires, the IP address is used to categorize the site. The default value (10 seconds) is a Check Point internal attribute. We do not recommend that you change it.
Enforce safe search in search engines
Selecting this option enforces a safe search. The URL Filtering Policy applies the strictest safe search options offered by the search engine. Regardless of what the user has selected, the strictest Safe Search settings are applied. Explicit sexual content is filtered out of the search results.
Categorize cached pages and translated pages in search engines
Selecting this option enables the categorization of a search engine cached and translated pages. Pages from the search engine cache are not categorized as "search engine pages". Cached and translated pages are categorized according to the original web site they were cached and translated from.
Connection Unification
Application and URL traffic generate a large quantity of logs. To make the quantity of logs manageable, you can consolidate logs by session. A session is a period that starts when the user first accesses an application or site. During a session, the Security Gateway records one log for each application or site that a user browses to. All actions that the user does in the session are included in the log.
There are 3 tracking options you can use:
- - Records the event details in SmartView Tracker. This option is useful to get general information on your network traffic. It consolidates logs by session (there is one log for each session). It shows the initial URL browsed and the number of suppressed logs it includes.
- - Consolidates logs by session, shows the number of suppressed logs and includes data for each URL request in the session time frame. Each of the URLs has an entry in the tab of the log in SmartView Tracker. Using this option can have an effect on performance.
- - Records logs for each URL request made regardless of session. Each URL request has its own log. This option also generates an event in SmartEvent for each URL browsed and is intended only for troubleshooting purposes. Note that this option generates many logs.
To adjust the length of a session:
- For applications and sites that are allowed in the Rule Base, the default session is three hours (180 minutes). To change this, click and enter a different value, in minutes.
- For applications and sites that are blocked in the Rule Base, a session is 30 seconds. You cannot change this in SmartDashboard.
Web Browsing
- The Web Browsing application includes all HTTP traffic that is not a defined application. Web Browsing is enabled by default. If you disable it:
- Instances of the Web Browsing in the Application and URL Filtering Control Rule Base are not enforced. For example, if you have a rule that blocks Web Browsing, this traffic will not be blocked if Web Browsing is turned off.
- No Web Browsing logs are recorded.
Application Control Backwards Compatibility
For compatibility with Security Gateway versions earlier than R75.20, click to configure backwards compatibility for use with Application Control.
- When selected, all application or site traffic during a session is combined into one log (default).
- When cleared, each connection to an application or site generates a different log.
- When cleared (default), all Web Browsing connections from a user or IP address during a session are combined into one log.
- When selected, the Web Browsing application generates one log for each domain that a user or IP address browses to for each session.
Application and URL Filtering and Identity Awareness
Identity Awareness and Application and URL Filtering can be used together to add user awareness, computer awareness, and application awareness to the Check Point Security Gateway. They work together in these procedures:
- Use Identity Awareness Access Roles in Application and URL Filtering rules as the source of the rule.
- You can use all the types of identity sources to acquire identities of users who try to access applications.
In SmartView Tracker logs and SmartEvent events, you can see which user and IP address accesses which applications. For more details, see the R76 Identity Awareness Administration Guide.
Using Identity Awareness in the Application and URL Filtering Rule Base
The Security Gateway inspects Application and URL Filtering requests and applies rules in a sequential manner. When a Security Gateway receives a packet from a connection, it examines the packet against the first rule in the Rule Base. If there is no match, it goes on to the second rule and continues until it completes the Rule Base. If no rule matches, the packet is allowed.
In rules with access roles, you can add a property in the Action field to redirect traffic to the Captive Portal. If this property is added, when the source identity is unknown and traffic is HTTP, the user is redirected to the Captive Portal. If the source identity is known, the in the rule (Allow or Block) is enforced immediately and the user is not sent to the Captive Portal. After the system gets the credentials from the Captive Portal, it can examine the rule for the next connection.
In rules with access role objects, criteria matching operates like this:
- When identity data for an IP is known:
- If it matches an access role, the rule is enforced and traffic is allowed or blocked based on the specified action.
- If it does not match an access role, it goes on to examine the next rule.
- When identity data for an IP is unknown and:
- All the rule’s fields match besides the source field with an access role.
- The connection protocol is HTTP.
- The action is set to redirect to the Captive Portal.
If all the conditions apply, the traffic is redirected to the Captive Portal to get credentials and see if there is a match.
If not all conditions apply, there is no match and the next rule is examined.
- When the criteria does not match any of the rules in the Rule Base, the traffic is allowed.
To redirect HTTP traffic to the Captive Portal:
- In a rule that uses an access role in the column, right-click the column and select .
The Action Properties window opens.
- Select .
- Click .
The Action column shows that a redirect to the Captive Portal occurs.
This is an example of an Application and URL Filtering Rule Base that shows how criteria matching operates:
No.
|
Source
|
Destination
|
Service
|
Applications/Sites
|
Action
|
1
|
Finance_Dept (Access Role)
|
Internet
|
Any
|
Salesforce
|
Allow
(display Captive Portal)
|
2
|
Any_identified_user
(Access Role)
|
Internet
|
Any
|
Remote Administration Tool (non-HTTP category)
|
Allow
|
3
|
Any_identified_user
(Access Role)
|
Internet
|
Any
|
Any recognized
|
Block
|
When browsing the Internet, different users experience different outcomes:
Example 1 - An unidentified Finance user that attempts to access Salesforce is sent to the Captive Portal. This happens because the action is set to redirect to the Captive Portal. After entering credentials and being identified, the user is granted access according to rule number 1.
Example 2 - An unidentified user that attempts to access the Remote Administration Tool matches rule 2, but not the Source column. Because the application is not HTTP, traffic cannot be redirected to the Captive Portal. Since none of the rules match, the user is granted access to the Remote Administration Tool.
Example 3 - An unidentified user that browses to Gmail does not match rules 1 and 2 because of the application. In rule 3 there is also no match because the action is not set to redirect to the Captive Portal. Since none of the rules match, the user is granted access to Gmail.
Identifying Users Behind a Proxy
If your organization uses an HTTP proxy server behind the Security Gateway, the Rule Base cannot match taking into account identities. Therefore, you cannot see identities of users behind the proxy. Application Control and URL Filtering logs show the proxy as their source IP address and not the user identity. Application Control, URL Filtering and Identity Awareness Security Gateways can use X-Forward-For HTTP header, which is added by the proxy server, to resolve this issue. When you configure the proxy server to add X-Forward-For HTTP header and the Check Point gateways to use it, you will see the correct source identities for traffic that goes through the proxy.
You can also configure the gateways to hide and strip the X-Forward-For header in outgoing traffic so that internal IP addresses will not be seen in requests to the internet.
To use X-Forwarded-For HTTP header:
- Configure your proxy server to use X-Forwarded-For HTTP Header.
- In SmartDashboard, on the I page of each gateway object, select .
- To configure the gateway to hide the X Forwarded-For header to not show internal IP addresses in requests to the internet, select .
- Install the Policy.
|
