Application Control and URL Filtering in SmartView Tracker
Log Sessions
Application traffic generates a very large amount of activity. To make sure that the amount of logs is manageable, by default, logs are consolidated by session. A session is a period that starts when a user first accesses an application or site. During a session, the Security Gateway records one log for each application or site that a user accesses. All activity that the user does within the session is included in the log.
To see the number of connections made during a session, see the field of the log in SmartView Tracker.
In SmartEvent the number of connections during the session is in the field of the Event Details.
Session duration for all applications or sites, including Web Browsing:
- For applications or sites that are allowed in the Rule Base, the default session is three hours. You can change this in SmartDashboard from the tab > > > .
- For applications or sites that are blocked in the Rule Base, a session is 30 seconds.
Application Control and URL Filtering Logs
Logs from Application Control and URL Filtering are shown in SmartView Tracker. The logs that Application Control and URL Filtering generate depend on the Tracking settings that you configure in:
- Each Application Control and URL Filtering rule in the Rule Base - sets logs for the traffic. These can be regular logs, extended logs or complete logs:
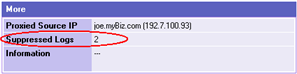
- - Records the event details in SmartView Tracker. This option is useful to get general information on your network traffic. It consolidates logs by session (there is one log for each session). It shows the initial URL browsed and the number of suppressed logs it includes.
- - Consolidates logs by session, shows the number of suppressed logs and includes data for each URL request in the session time frame. Each of the URLs has an entry in the tab of the log in SmartView Tracker. Using this option can have an effect on performance.
- - Records logs for each URL request made regardless of session. Each URL request has its own log. This option also generates an event in SmartEvent for each URL browsed and is intended only for troubleshooting purposes. Note that this option generates many logs.

|
Note - For versions earlier than R75.20, the logging option that you select for on the > > page - sets logging options for the Web Browsing application.
|
Logs related to Application and URL Filtering Database updates on the Security Gateway are in > .
Logs related to Application and URL Filtering Database updates on the management are in the tab.
Viewing Logs
To open SmartView Tracker do one of these:
- Click > > .
- From the pane > , click SmartView Tracker.
- From the SmartDashboard toolbar of any SmartConsole application, select Window > SmartView Tracker or press .
Predefined Queries
There are multiple predefined queries in Predefined > Network Security Blades > Application and URL Filtering. You can filter the queries to focus on logs of interest.
- - Shows all Application Control and URL Filtering traffic, including allowed and blocked.
- - Shows traffic of Risk Levels 4 and 5.
- > - Shows all Application Control traffic.
- > - Shows all URL Filtering traffic.
- > - Shows logs from traffic that has the High Bandwidth tag.
- > - Shows all blocked traffic.
- > - Shows all Application Control and URL Filtering traffic that passed through HTTPS inspection.
- >- Shows logs related to Application and URL Filtering Database updates and other system related issues. This includes logs related to problems that the application detection service might encounter.
Permissions for Logs
Most information in Application Control and URL Filtering logs is classified and only administrators with at least Read permissions for Application Control Logs can see it.
To set these permissions for an administrator in a new profile:
- Open SmartDashboard.
- In the Users and Administrators tree, select an administrator > Edit.
- In the Administrator Properties > General Properties page in the Permissions Profile field, click New.
- In the Permissions Profile Properties window:
- Enter a Name for the profile.
- Select Customized and click Edit.
The Permissions Profile Custom Properties window opens.
- In the Monitoring and Logging tab, select Application Control Logs for permission to see the classified information in the Application Control and URL Filtering logs.
- Click OK on all of the open windows.
To edit an existing permissions profile:
- From the SmartDashboard toolbar, select Manage > Permissions Profiles.
- Select a profile and click Edit.
- Follow the instructions above from step 3.
|
