Statistics
On the Statistics pane, you can:
-
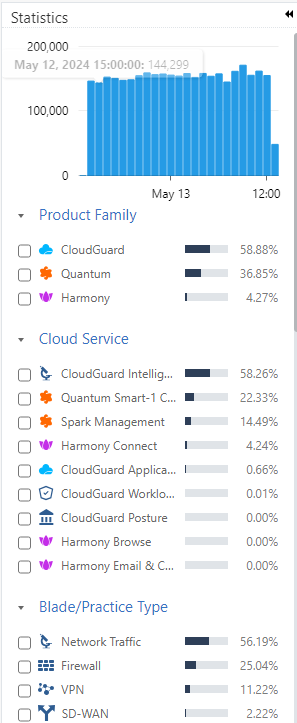
See a bar graph of the number of events for the selected time frame.
-
Filter the event data in Logs Table. For example, you can filter the events data for a product family, an MSP child account and more.
Note:As the logs for Log Sharing cloud service are distributed between Quantum Smart-1 Cloud and Log Sharing, the system may show inaccurate statistics in the Cloud Service section.