


|
|
|
In This Section: |
To configure a new target (Splunk server) for the logs:
On the Check Point server, run:
cp_log_export add name <name> [domain-server <domain-server>] target-server <target-server> target-port <target-port> protocol <tcp | udp> format splunk read-mode <raw | semi-unified>
Example:
cp_log_export add name my_exporter target-server 192.168.1.1 target-port 12001 protocol tcp format splunk read-mode semi-unified
On Multi-Domain Server/Multi-Domain Log Server:
$EXPORTERDIR/targets/< name>. Note - On a Multi-Domain Server environment, there is an EXPORTERDIR for each domain.
The deployment described above exports the logs in clear text. To send the logs over an encrypted connection, refer to the “TLS Configuration” section in sk122323.
Note - After you configure the target (Splunk server), you must configure the data input on the Splunk side before you export logs from your Check Point server.
To modify an existing target for the logs to work with Splunk format:
On the Check Point server, run:
cp_log_export set name <name> format splunk read-mode <raw | semi-unified>
Example:
cp_log_export set name my_exporter format splunk read-mode semi-unified
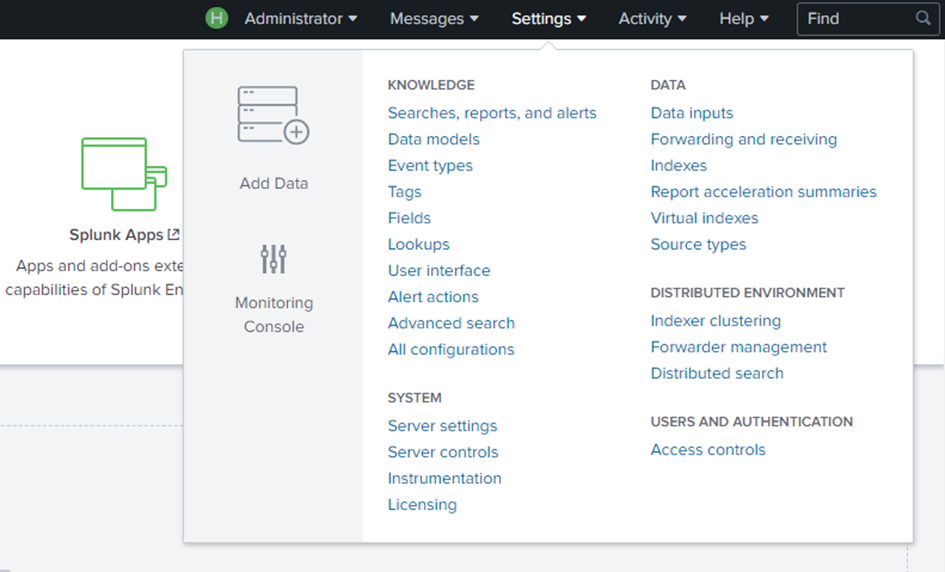
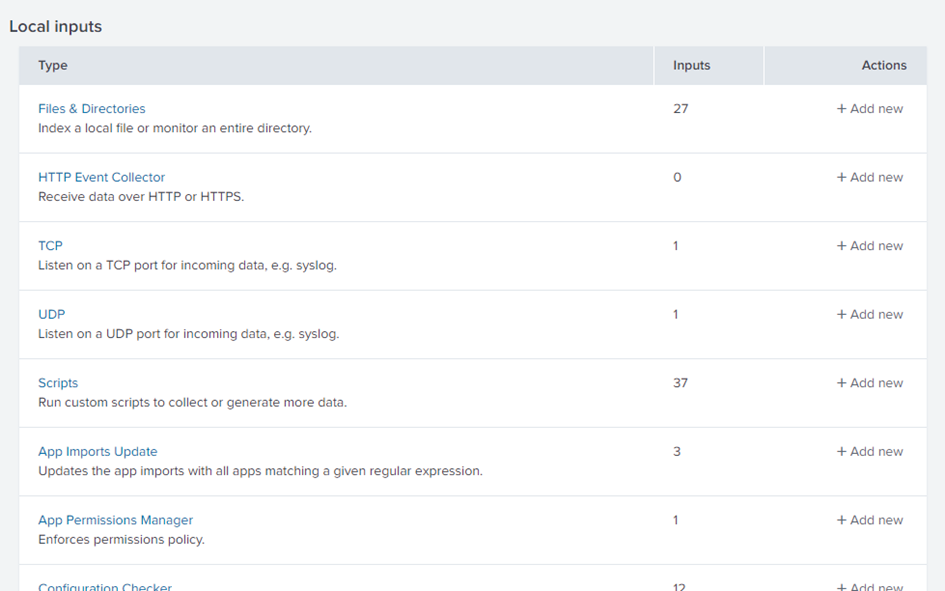
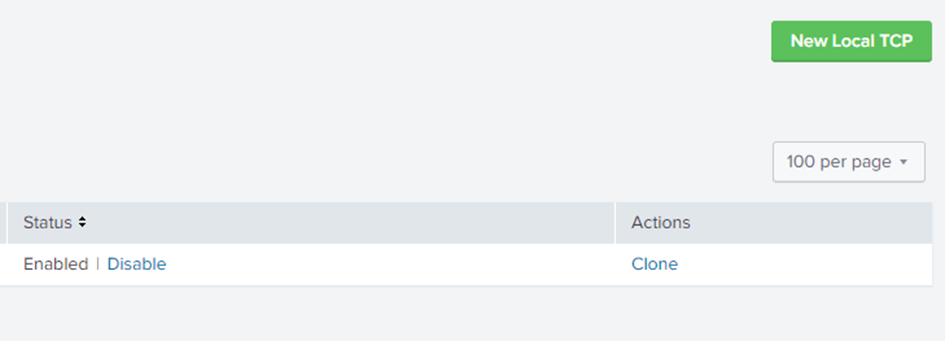
To configure a new data input for the logs:

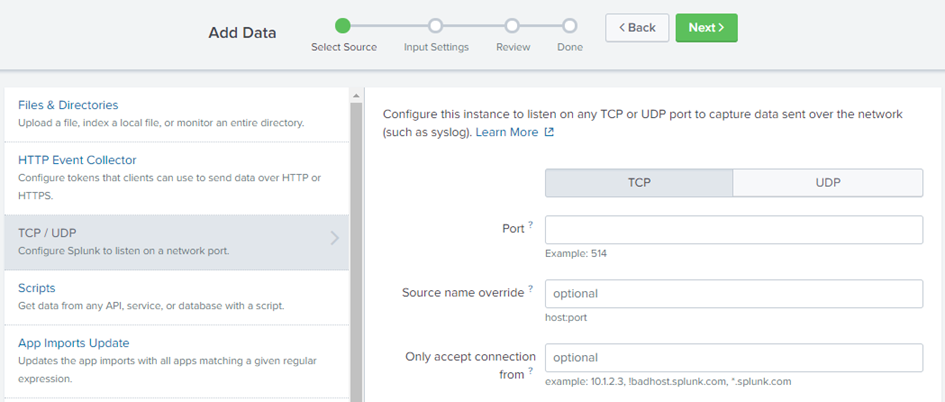
cp_log as the source type.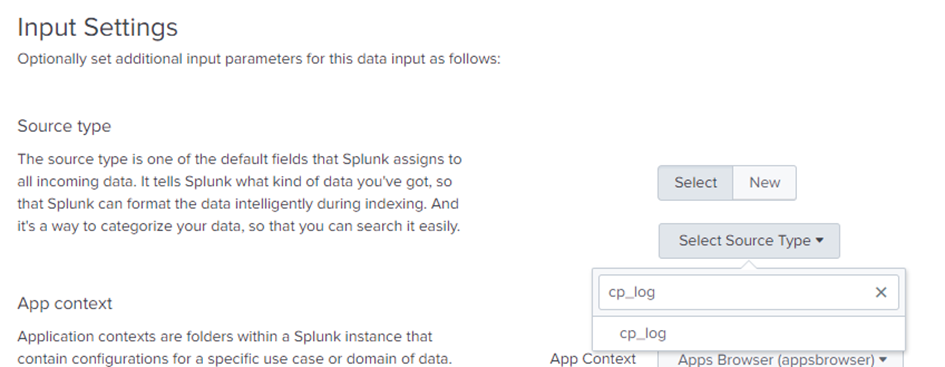
For more information on Data Inputs on Splunk, refer to Splunk documentation - Configure your inputs.
To modify an existing data input for the logs:
cp_log.The last step is to start the export process on your Check Point Server:
Run:
cp_log_export restart name <name>
You now can see the exported logs on your Splunk WebUI.

