

Using rich and customizable views and reports, R80 introduces a new experience for log and event monitoring.
The new views are available from two locations:
Where Server IP is IP address of the Security Management Server or SmartEvent server.
Catalog
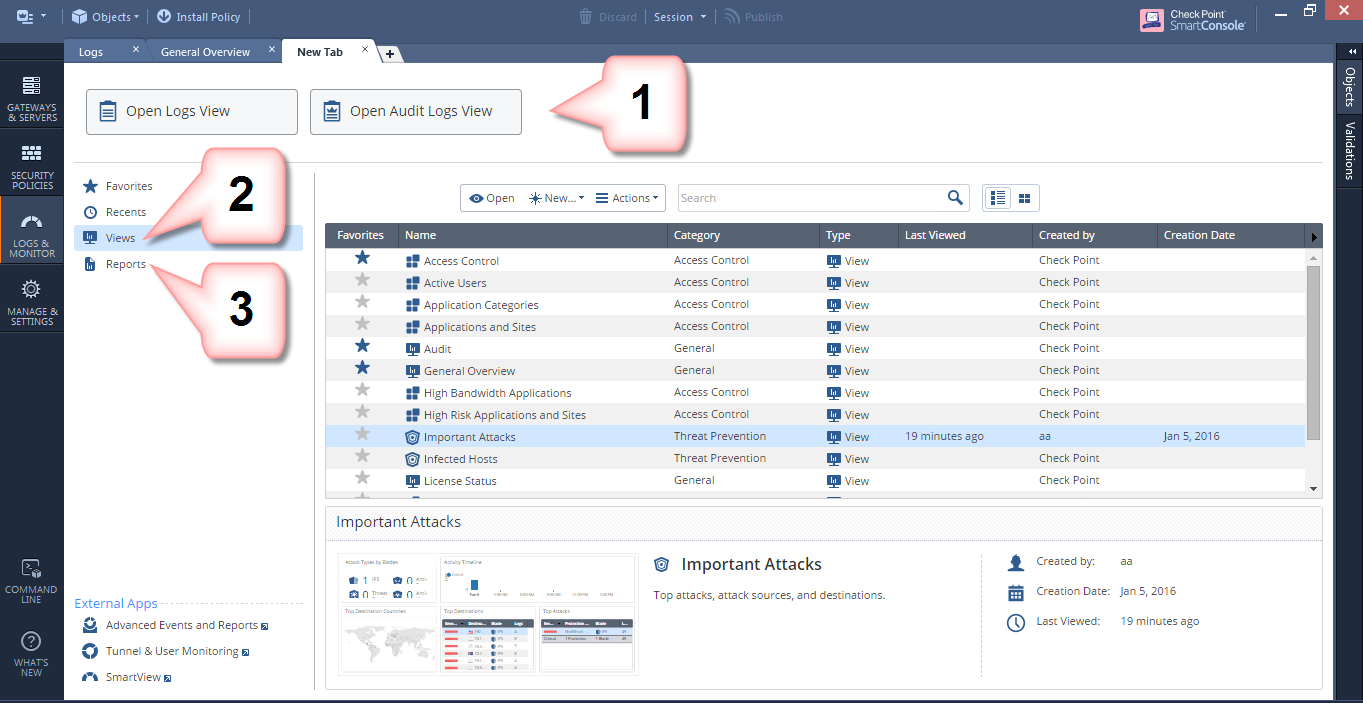
In the Logs & Monitor view, clicking the (+) tab opens a catalog of all views and reports, predefined and customized. Click a view or report to open it.

Use Log View to see and search through the logs from all Log Servers. You can also search the logs from a Log Server that you choose. You can also Open Audit Logs View to see records of actions done by SmartConsole administrators. Other views come from the SmartEvent Server.
Shows a list of graphical widgets. Widgets represent predefined and customized views. Double-click a widget to drill down to a more specific view or raw log files. For more, see: Managing Views.
Shows a list of predefined and customized reports. Report consists of multiple views. Reports can be customized, filtered, generated and scheduled. For more, see: Managing Reports.
Use the Favorites view to collect the views and reports you use the most.
Connecting with SmartConsole to the Security Management Server lets you see all views and reports generated by SmartEvent, although SmartEvent can also reside on a separate server. Queries are forwarded to the SmartEvent Server, and the results shown in SmartConsole.
Note - In R80, the SmartEvent GUI client is still supported. Use it for initial setup and to define the SmartEvent Correlation Unit policy.
To open the SmartEvent GUI client: