Widgets
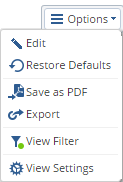
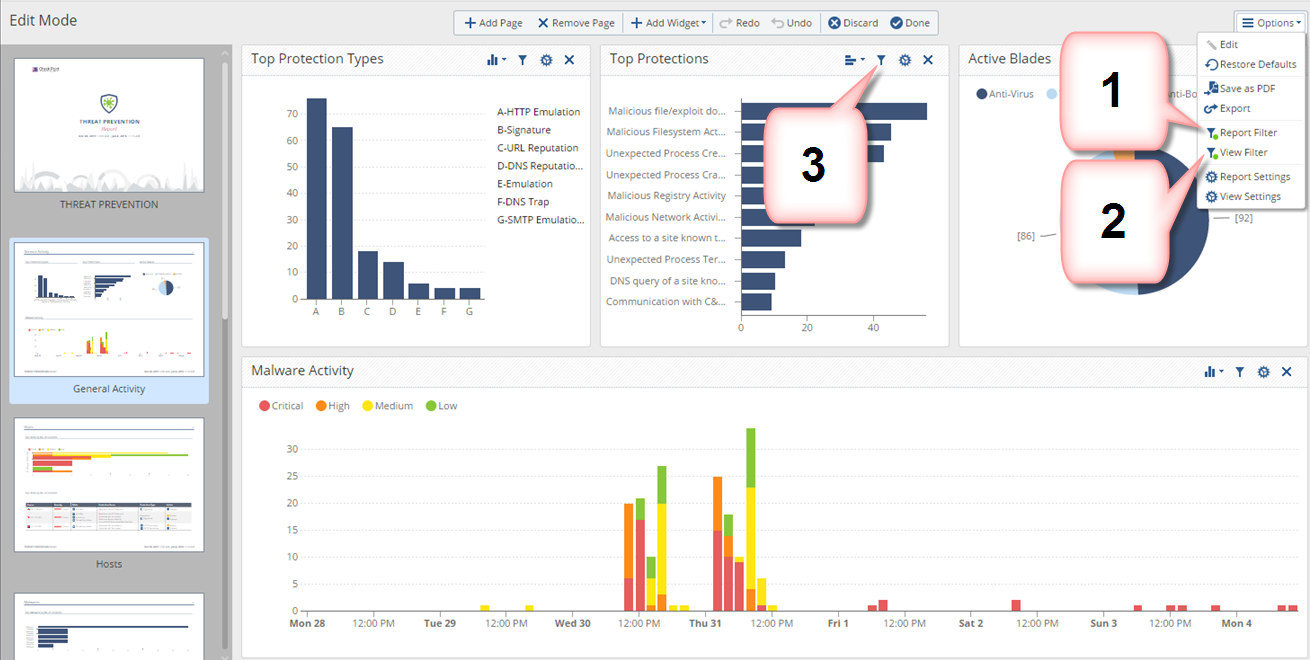
To customize widgets, switch to edit mode. Click on >.
- To save changes, click .
- To cancel changes, click on .
- To restore the predefined view to the default values, click > .
Adding and Customizing
To add a Widget:
- Add a widget
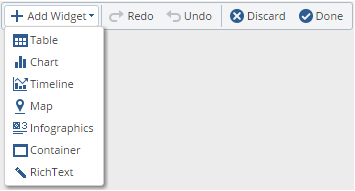
- Select a widget type:
Chart
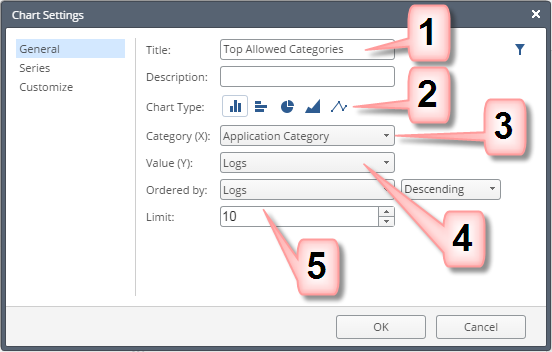
- Enter a title.
- Select a chart type: vertical bar, horizontal bar, pie, area or line.
- Select a data category for the X axis.
- Define how the Top Values are calculated (by number of logs, or by traffic).
- Set a limit for how many top values to show.
- Optional: click - split the results into colored groups with different values for the series.
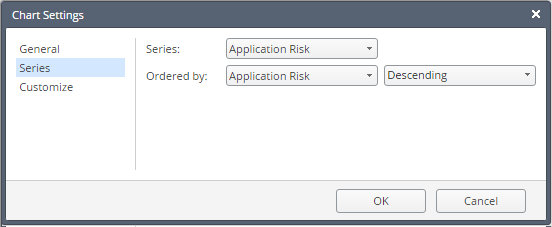
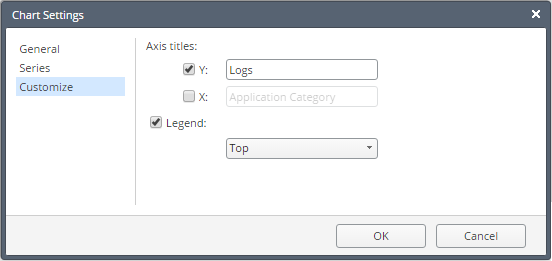
- Optional: click and define axis titles and legend position.
Timeline
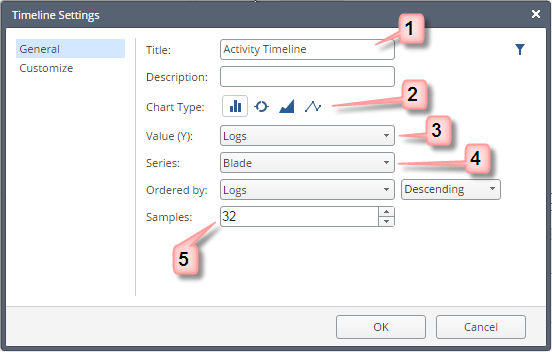
- Enter a title.
- Select a timeline graphical presentation: vertical bar, doughnut, area or line.
- Select the data to count.
- Advanced - split the results into colored groups, with different values for the .
- Define the time-granularity. Enter the number of bars or doughnuts to show.
Table
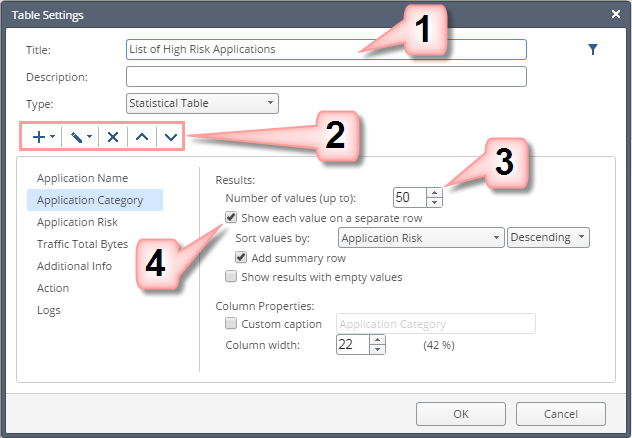
- Enter a title.
- Manage columns: add, edit, remove, and change the order.
- Select a column on the left and define its settings:
- Enter the number of top values to show.
- Select how values are sorted.
- Select this option to group results with the same value in one row.
Map
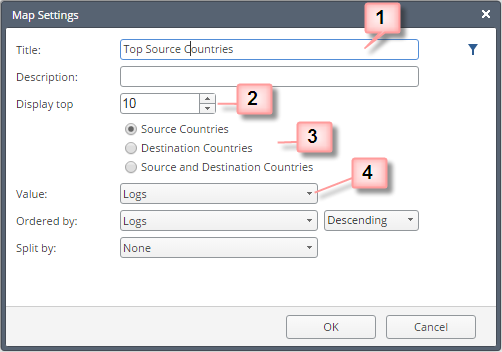
- Enter a title.
- Enter the number of Top Countries to mark.
- Select to mark Top Source Countries, Top Destination Countries, or both.
- Define how to find the Top Countries (for example, by number of logs or by traffic).
Infographic
The infographic widget shows large meaningful values. For example:

Configure an infographic using these settings:
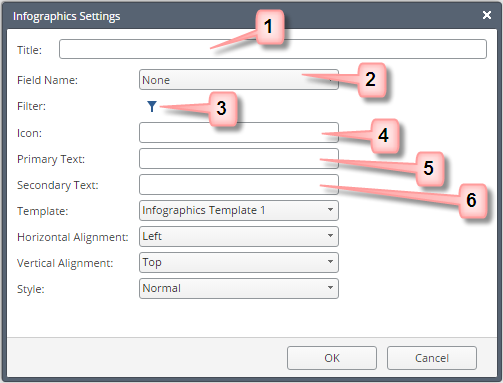
- Enter a title
- Select a field to count. Selecting means all the logs that match the filter criteria are counted.
- Define filter criteria.
This critieria is in addition to the inherited filters for the report and view layers.
For more, see Filters.
- Optional: Enter an icon name in the field.
Select a name from the list below. Pay attention to upper and lower case letters and the use of hyphens.
Icon
|
Used for
|
apps
|
|
attacks
|
|
hosts
|
|
Gateway
|
|
traffic
|
|
usercheck
|
|
users
|
|
new
|
Audit Logs
|
add
|
Audit Logs
|
remove
|
Audit logs
|
modify
|
Audit logs
|
install-policy
|
|
publish
|
|
ips
|
|
anti-bot
|
|
anti-virus
|
|
threat-emulation
|
|
- Enter primary text that describes the value counted.
- Optional: For secondary text, enter a more detailed description.
Container
Use a container to unify multiple widgets into one frame. Add a container, then add, edit, or remove the widgets inside it.
Note - The container widget cannot be added to a container.
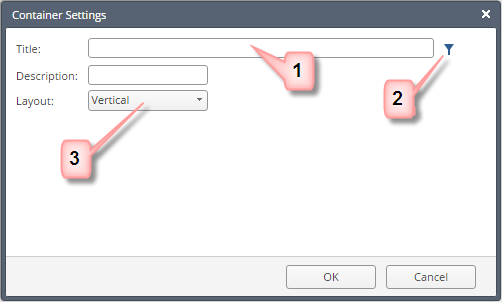
- Enter a title.
- Optional: filter at the container level. The filter applies to all internal widgets.
- Select the widget order inside the container: Horizontal, Vertical, Grid or Tabs.
After the container is added to the view, you can configure it further.
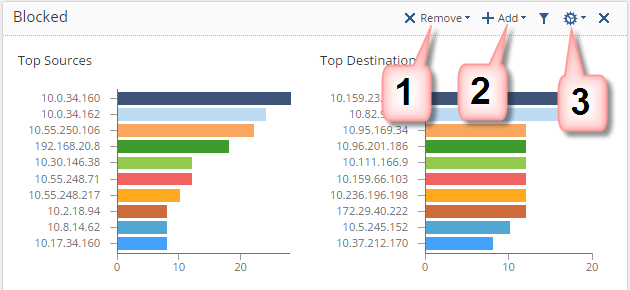
- Remove the widget from the container.
- Add a new widget.
- Edit the settings for the container, or edit one of the widgets in the list.
Rich Text
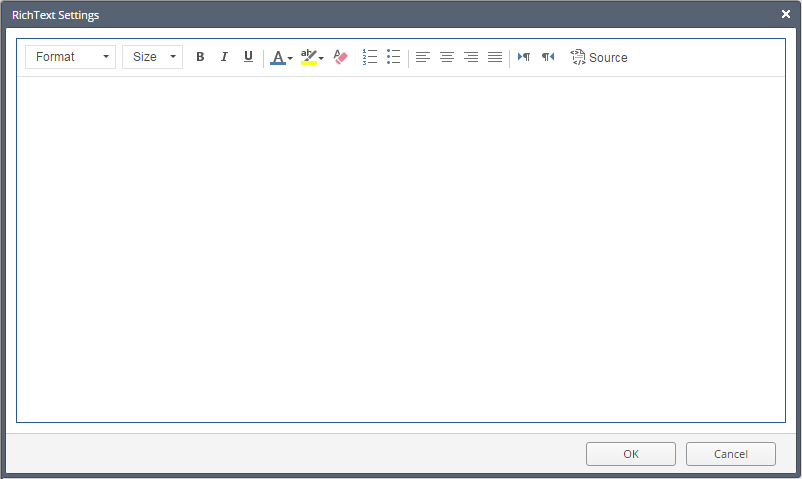
Use this window to add textual explanations to the View text box.
To customize a widget:
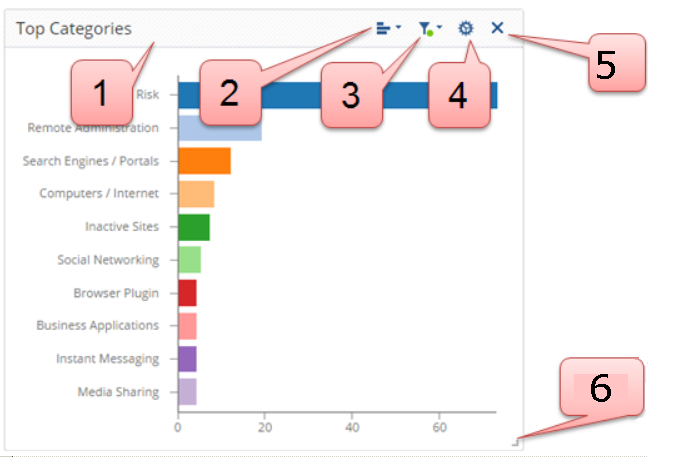
- Drag and drop the widget within the view.
- Select the graphic presentation that best fits the information you want to see.
- Select filters for the widget in addition to the inherited filters from the report and view layers. (See: Filters).
- Configure settings for the widget.
- Delete a widget.
- Resize widget.
Filters
The search bar is used to apply on-demand filters, but you can also save filters with the view / report definition.
There are different layers of filters:
- Filters to apply to the full report.
- Filters to apply to a view, or a specified page in a report and all widgets that this page includes.
- Filters to apply to the selected widget.
Edit View Filter
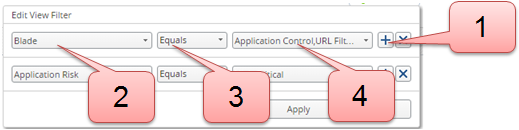
- Click the (plus) button to add a filter.
To delete a filter, click the X button. - Select a field.
To enable free text search, select Custom Filter. - Select a comparison method.
- Select or enter the value.
You can define multiple values, separated by a comma.


