


|
|
|
In This Section: |
The SmartEvent Software Blade is a unified security event management and analysis solution that delivers real-time, graphical threat management information. SmartConsole, SmartView Web Application, and the SmartEvent GUI client consolidate billions of logs and show them as prioritized security events so you can immediately respond to security incidents, and do the necessary actions to prevent more attacks. You can customize the views to monitor the events that are most important to you. You can move from a high level view to detailed forensic analysis in a few clicks. With the free-text search and suggestions, you can quickly run data analysis and identify critical security events.
An event is a record of a security incident. It is based on one or more logs, and on rules that are defined in the Event Policy.
An example of an event that is based on one log: A High Severity Anti-Bot event. One Anti-Bot log with a Severity of High causes the event to be recorded.
An example of an event that is based on more than one log: A Certificate Sharing event. Two login logs with the same certificate and a different user cause the event to be recorded.
SmartEvent automatically defines logs that are not Firewall, VPN, or HTTPS Inspection logs, as events.
Events that are based on a suspicious pattern of two or more logs, are created by the SmartEvent Correlation Unit. These correlated events are defined in the SmartEvent client GUI, in the Policy tab.
Most logs are Firewall, VPN and HTTPS inspection logs. Therefore, SmartEvent does not define them as events by default to avoid a performance impact on the SmartEvent Server. However, enabling consolidated events for Firewall saves disk space so and makes it possible to keep a longer event history. To create events for Firewall, in the SmartEvent Policy tab, enable Consolidated Sessions > Firewall Session.
To show an Internet browsing event:
The events of this time period show.
This is an example log of a High Risk event.
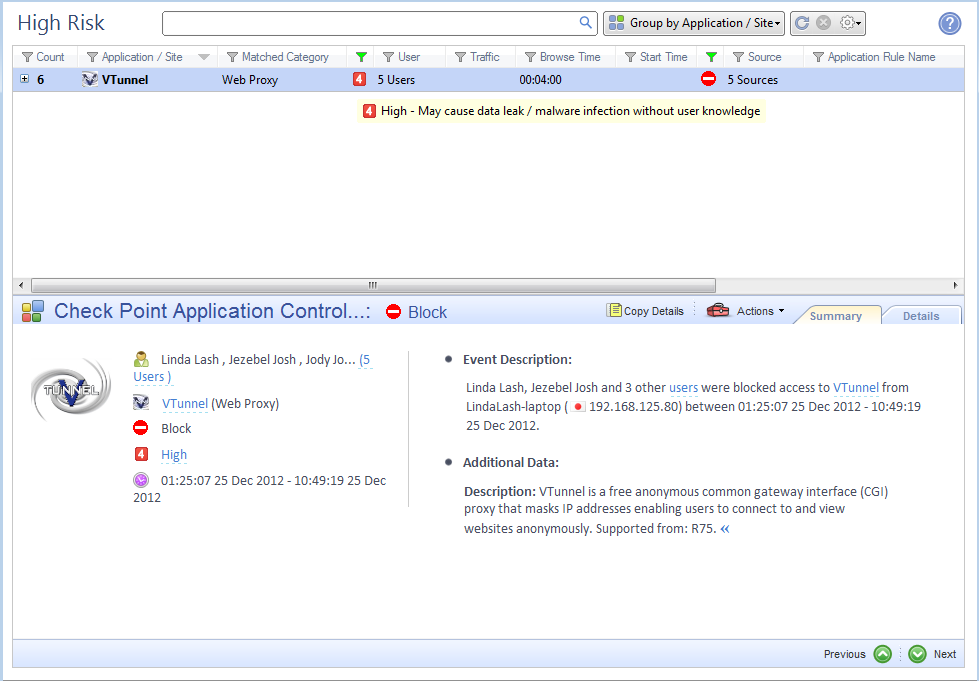
Information about the event:
In This Section: |
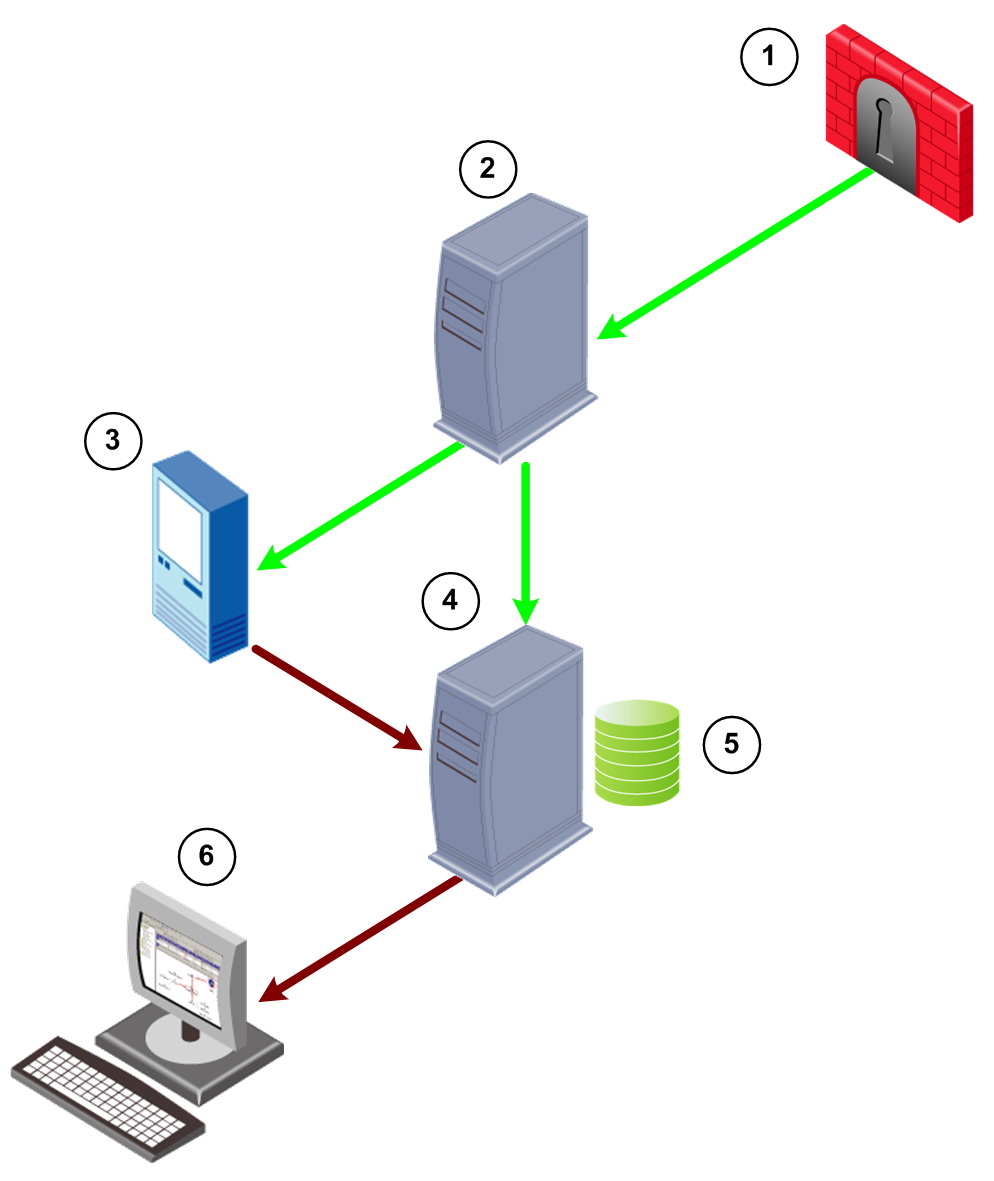
SmartEvent has some components that work together to help track down security threats and make your network more secure.
This is how they work together. The numbers refer to the diagram:
Item |
Description |
Purpose |
|---|---|---|
|
|
Log data flow |
|
|
Event data flow |
1 |
Check Point Security Gateway |
Sends logs to the Log Server. |
2 |
Log Server |
Stores logs. |
3 |
SmartEvent Correlation Unit |
Identifies events: Analyzes each log entry from a Log Server, and looks for patterns according to the installed Event Policy. The logs contain data from Check Point products and certain third-party devices. When a threat pattern is identified, the SmartEvent Correlation Unit forwards the event to the SmartEvent Server. |
4 |
SmartEvent Server |
Receives the items that are identified as events by the SmartEvent Correlation Unit. The SmartEvent Server does further analysis to determine the severity level of the event and what action to do. The event is stored in the system database. |
5 |
Events database |
Stores events. Located on the SmartEvent Server. |
6 |
SmartEvent client |
Shows the received events. Uses the clients to manage events (for example: to filter and close events), fine-tunes, and installs the Event Policy. The clients are:
|
The SmartEvent components can be installed on one computer (that is, a standalone deployment) or multiple computers and sites (a distributed deployment). To handle higher volumes of logging activity, we recommend a distributed deployment. You can install more than one SmartEvent Correlation Unit. Each SmartEvent Correlation Unit can analyze logs from more than one Log Server or Domain Log Server.
The SmartEvent Correlation Unit analyzes the log entries and identifies events from them. During analysis, the SmartEvent Correlation Unit does one of these actions:
The SmartEvent GUI is one of the SmartEvent clients that you can use to analyze events that occur in your environment.
Overviews:
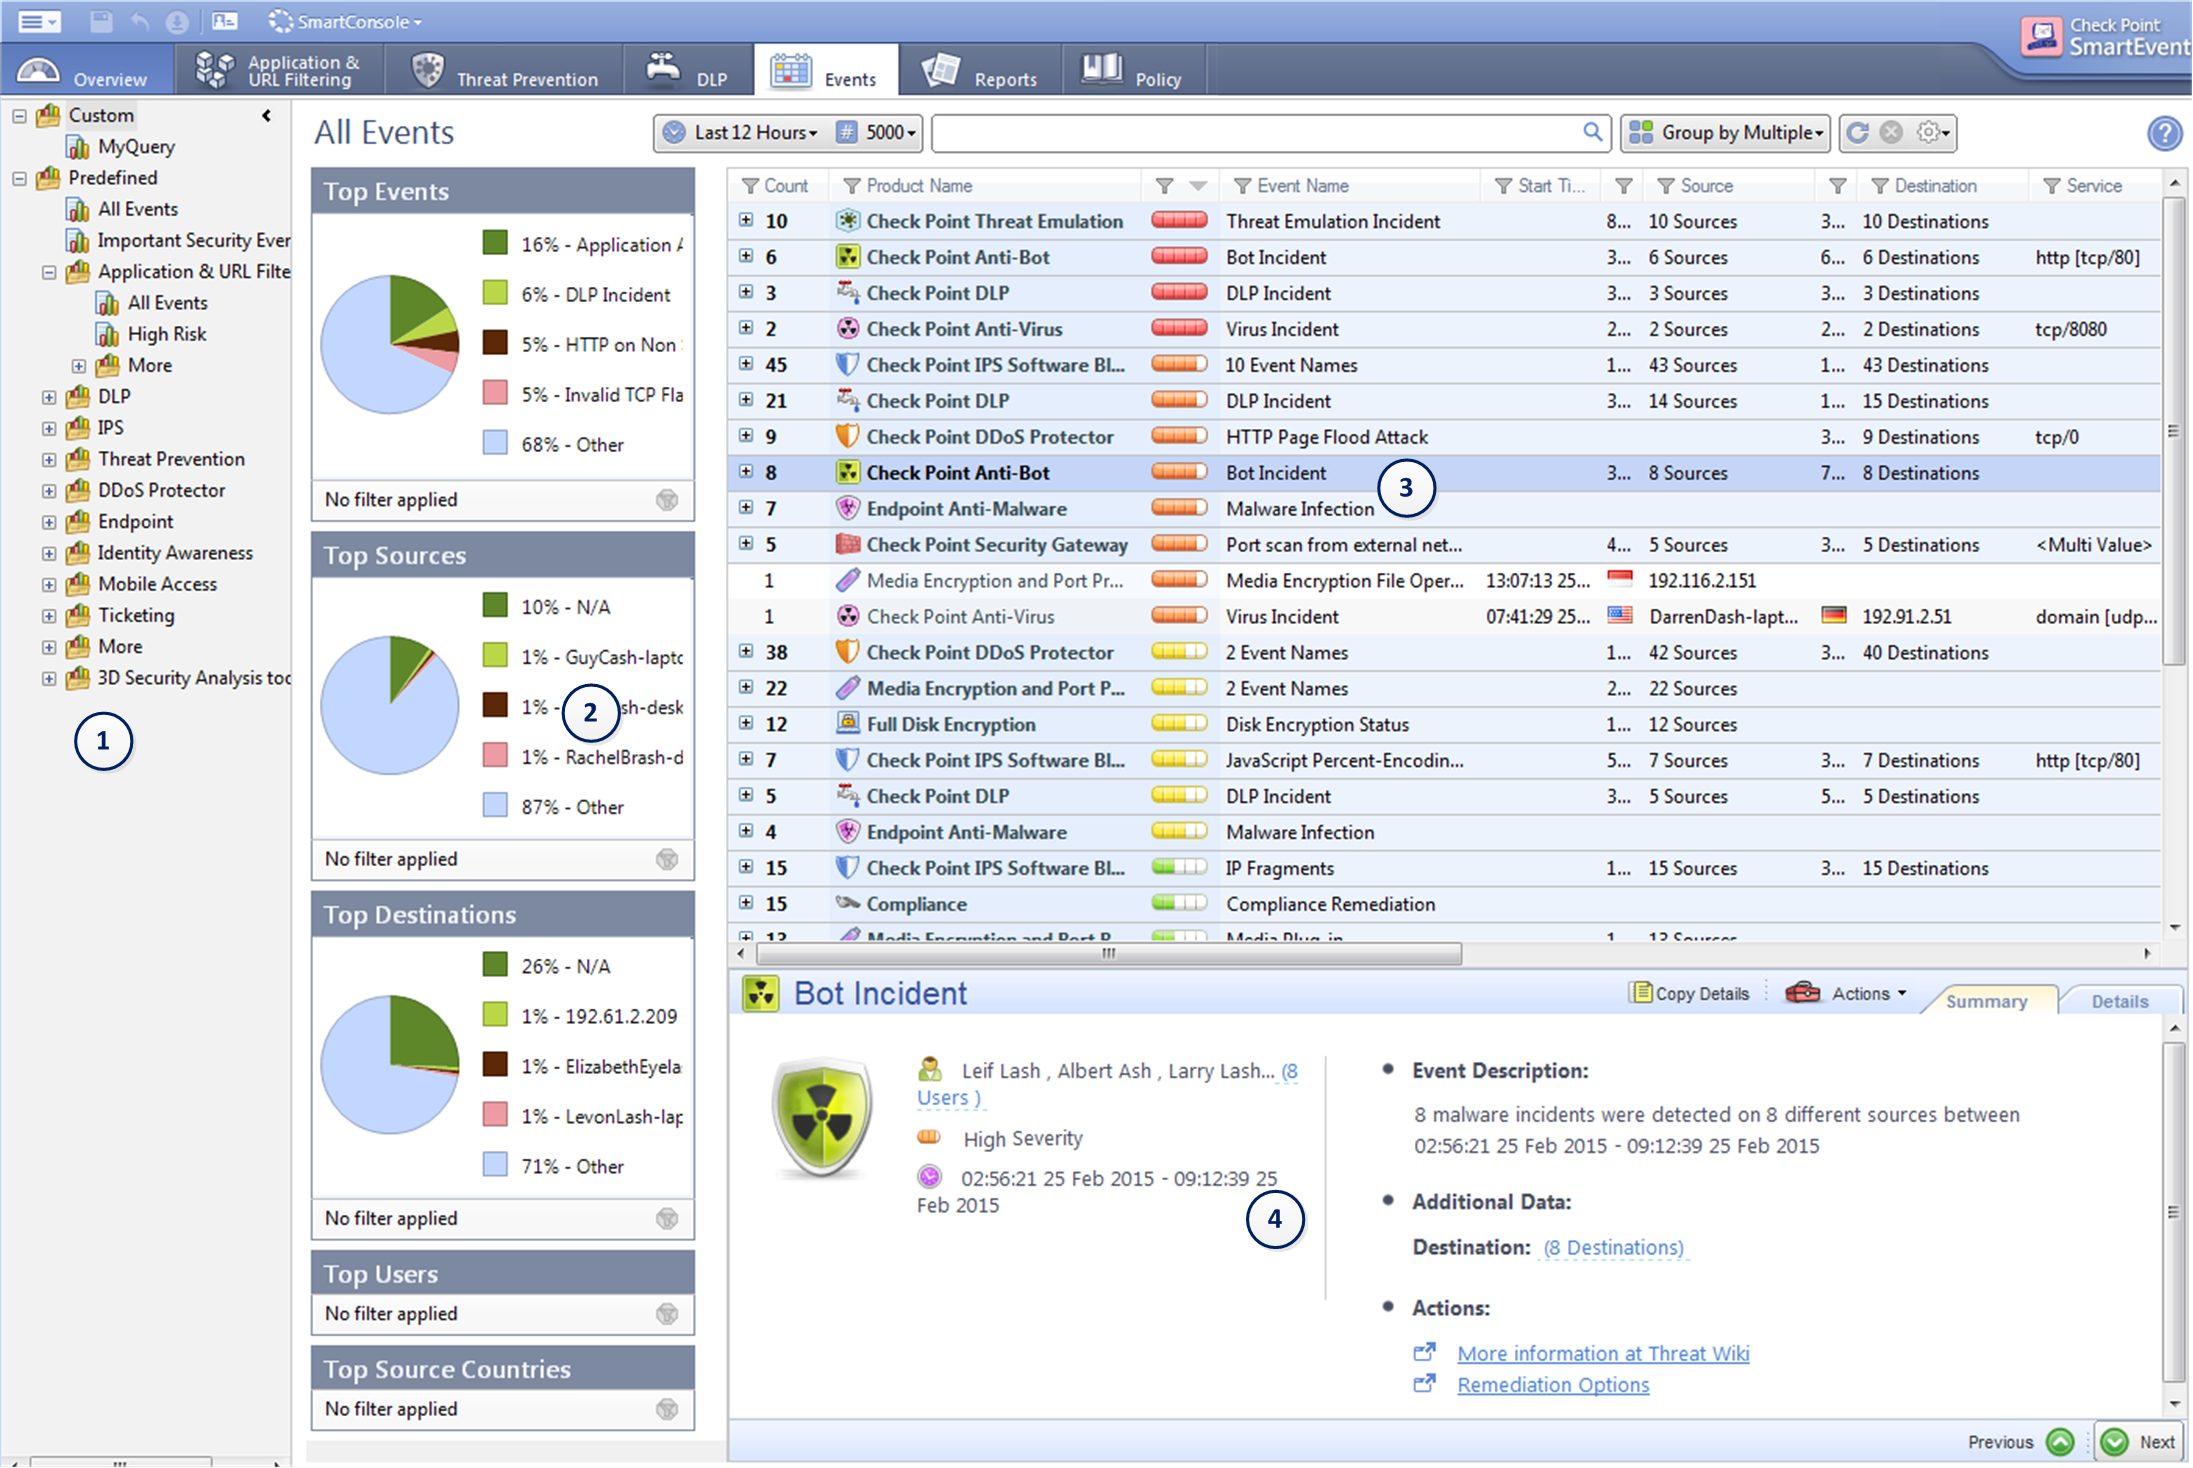
The Overview tab shows top events of all types. When you work with a protection type, you can go directly to the data for that area.
Click the tab for events filtered by Software Blade:
Drill down forensics:
Double-click a result in a pane (such as an IP address or a user name). The other Overview panes are filtered for the selection. The search bar shows the filter applied to the events. For example, if you click one of the Top Sources, the search bar shows: src:""
Quickly search the database of logs and events:
Use Search Suggestions and Recent Searches. Click in the search bar to see the search suggestions and your recent searches. The search is fast, and the results are from the event database.
For example, to see only important events from 192.168.2.15:
The data in all the panes is updated to match your search.
Filter for standard results:
Click Filters to select a standard filter option. For example, in Application and URL Filtering, you can filter to see only events of Application Control or only events of URL Filtering. You can filter for Action, to see events for Blocked or Allowed traffic.
Free-text search using the log search syntax:
For more sophisticated searching, you can do AND/OR searches with the Query Syntax.
The SmartView Web Application is one of the SmartEvent clients that you can use to analyze events that occur in your environment. Use the SmartView Web Application to see an overview of the security information for your environment. It has the same real-time event monitoring and analysis views as SmartConsole. The convenience is that you do not have to install a client.
To log in to SmartEvent using SmartView Web Application:
Browse to https:///smartview/
or https:///smartview/
Note - The URL is case sensitive.
In This Section: |
To open the SmartEvent GUI client:
SmartEvent uses filtered event views, called queries, to identify and show relevant events. Event window information, timelines, graphs, and reports are based on queries that identify potentially dangerous events and event patterns. You use this information to adjust your Security Policies and protection settings in response to detected threats.
SmartEvent uses filtered event views, called queries, to define the events to view. Located in the Queries Tree, these queries filter and organize event data for display in the Events, Charts and Maps tabs. Queries are defined by filter properties and charts properties. Filter properties allow you to define what type of events to display and how they should be organized. Charts properties allow you to define how the filtered event data should be displayed in chart form.
SmartEvent provides a thorough set of predefined queries, which are appropriate for many scenarios.
Queries are organized by combinations of event properties, for example:
SmartEvent gives you the flexibility to define custom queries that show the most related events and trends. After you define custom queries, you can organize them into folders. That way, they are easy to find and use.
Use your queries to:
You can work with queries in the Events windows. To learn about procedures and to work with report queries, see the Reports section.
To change query filter properties:
To clear filter values from a query:
This filter value changes into Any.
|
Note - If you clear the Show option for a criterion that does not have a filter applied, that criterion automatically moves to the Ignored list. This action is equivalent to the use of the Remove button. |
Optional: Define these additional query settings:
You can create a custom query from scratch in the Custom folder or based on an existing query.
To create a custom query based on the default query:
To create a custom query based on an existing query:
The Events tab is the primary part of SmartEvent.
These are the components of the Events tab:
Item |
Description |
|---|---|
1 |
Query Tree - Double-click a query to run the query. The results show in the event List. |
2 |
Event Statistics pane - Shows the top events, destinations, sources and users of the query results, either as a chart or in a tallied list. |
3 |
Event List - Shows events generated by a query. |
4 |
Event Preview Pane - Shows the details of the selected event |
The SmartEvent Event List in SmartConsole and in the SmartEvent GUI can show up to 100,000 events. The events shown are the result of a query that ran on the Event Database. To run a different query, double-click a query in the Selector tree. The Event List show the events that match the criteria of the query.
The Event List is where detected events can be filtered, sorted, grouped, sent for review, and exported to a file. This helps to understand your network security status. Event details, such as Start and End Time, Event Name and Severity, are shown in a grid. In the Status bar at the bottom of the SmartConsole and SmartEvent client window, Number of records in view shows a count of new events. Refresh retrieves the data from the database according the active query filter.
The details of an event provide important specifics about the event: Type of event, origin, service, and number of connections. To access event details, double-click the event or show the Event Preview Pane.
Queries are built with default settings that can be changed directly in the Events tab to provide more specified or more comprehensive results.
After you run a query, you can right-click a column and define the filter parameters to filter the event data. This temporarily includes the filter in the active query and runs the query again against the database to return the matching values.
A green filter icon at the top of a column indicates that a filter is applied to that field. To save the new set of filters as a custom query, select Save from the File menu. To discard the filters that was not saved, run the query again.
To use filters with query results:
Running a query can return thousands of matching events. To help you organize the events that have already been returned by the query, click a column header to sort these events
To look for events with specified values, enter values in the Search field. When you search for multiple values, with commas that separate the values, the events that contain the search values return. But the values can be in all event fields. The search can be made case-sensitive or can search data that does not show in columns.
One of the most powerful ways to analyze event data: To group the data based on the specified columns, and use the Group By button on the toolbar. Group the events by one or more columns. The Event List shows the number of matching events in those groups, presented in descending sequence.
To specify the default grouping that a query uses, mark fields as Grouped in the Events Query Properties window.
The top line of each group in the Event List shows a summary of the events that it contains. Hover over a field in the top line to see details of what data that field contains in this group events.
To group events by one or more fields:
To add a column for grouping: In the Event List, right-click the column to use to group events and select Add this Column to the Group.
To remove fields from the grouping:
Use event information to show a sign of a security attack or vulnerability that needs to be resolved. For example, another member of your security team can review an event as a sign of an attack. When you report events to Check Point it helps Check Point to improve the IPS technology to detect new threats in an ever-changing security environment. From the Event List: Send event details as an email with your default email client, or send the event details to Check Point over a secure SSL connection.
To send an event with an email:
A new email opens with your default email client. The event information is included in the body of the email.
To report an event to Check Point:
Only the event information is sent to Check Point over a secure SSL connection. The data is kept confidential. Check Point uses the information only to improve IPS.
The Event tab in the SmartEvent GUI can contain thousands of events. Export the events into a text file to review or manipulate the data with external applications. For example: A spreadsheet or text editor.
To export events to a comma-delimited (csv) file:
The Event List in the Events tab is accompanied by charts displaying the Top Events, Top Sources, Top Destinations and Top Users for the active query. These statistics are automatically updated as filters are applied to the Event List.
You can filter in or out any value in the Event Statistics Pane to focus the query results on the data that is most important to you. Filtering in the Event Statistics pane is also reflected in the Event List, and clearing filters from the Event Statistics Pane clears all filters that have been applied to the query.
To remove the extra conditions you have applied, click on the Clear Filter icon.
See the details of an event from the Preview Pane in the Events tab or by double-clicking on the event in the Event List. The Event Details window has two tabs with different data:
These options are available from the Event Details window:
The Details tab includes:
The Summary tab includes:
The Browse Time feature keeps track of the total time that users are connected to different sites and applications. R76 and later Security Gateways calculate the cumulative connection time for each session and periodically updates this value until the session is closed.
Browse time is calculated as follows:
After you arrange the events as you like in the Event List, you can investigate their details and evaluate if they represent a threat.
Events can be categorized and assigned to administrators to track their path through the workflow of resolving threats. When administrators review an event, they can assign it a status, such as Investigation in Progress, Resolved, or False Alarm; add comments that detail the actions that have been taken with respect to the event. This process is called Ticketing.
After administrators edit the ticket, they can use queries to track the actions taken to mitigate security threats and produce statistics based on those actions.
When you review events generated from the IPS blade, review the IPS protections and profiles to understand why an event was generated or attempt to change the way the traffic is handled by the IPS blade.
The IPS menu presents actions that are specific to IPS events. These actions include:
If a log has related packet captures, you can open a packet viewer to see the contents of the captured packet. To examine this more, save the packet capture to a file.
To use the Packet Capture feature, you must activate blades.
To activate blades:
To see a packet capture:
The Packet Capture Viewer Output window opens.
The options are:
The SmartEvent client provides a convenient way to run frequently used command line executables that help you to examine events. Right-click cells in the Event List that refer to an IP address to show the default list of commands in the context-sensitive menu.
These commands are available by default: ping, whois, nslookup and Telnet. The IP address of the active cell is used as the destination of the command when run. Therefore, the commands show by design only on cells that refer to IP addresses, because t
For example: Right-click a cell with an IP address and select the default ping command. A window opens and three ICMP packets are sent to that address. This behavior is configurable. You can add your own custom commands.
To add (or edit) custom commands:
Use the Policy tab of the SmartEvent GUI client to configure and customize the events that define the SmartEvent Event Policy.
Define the Event Policy in the Event Policy tab. Most configuration steps occur in the Policy tab. You define system components, such as SmartEvent Correlation Unit, lists of blocked IP addresses and other general settings.
The types of events that SmartEvent can detect are listed here, and sorted into a number of categories. To change each event, change the default thresholds and set Automated Responses. You can also disable events.
The Policy tab has these sections:
After the SmartEvent client starts to show events, do these procedures:
Modifications to the Event Policy do not take effect until saved on the SmartEvent server and installed to the SmartEvent Correlation Unit.
To enable changes made to the Event Policy:
You can undo changes to the Event Policy, if they were not saved.
To undo changes: click File > Revert Changes.
SmartEvent constantly takes data from your Log Servers, and searches for patterns in all the network chatter that enters your system.
Depending on the levels set in each Event Definition, the number of events detected can be high. But only a portion of those events can be meaningful. You can change the thresholds and other criteria of an event, to reduce the number of false alarms.
To change Event Definitions:The Selector tree is divided into two branches: Event Policy and General Settings. The events detectable by SmartEvent are organized by category in the Event Policy branch. Select an event definition to show its configurable properties in the Detail pane, and a description of the event in the Description pane. Clear the property to remove this event type from the Event Policy the next time the Event Policy is installed.
The General Settings branch contains Initial Settings. For example: To define SmartEvent Correlation Unit, which is typically used for the initial configuration. Click a General Settings item to show its configurable properties in the Detail pane.
For details on specified attacks or events, refer to the Event Definition Detail pane.
When an event definition is selected, its configurable elements appear in the Detail pane, and a description of the event is displayed in the Description pane. These are the usual types of configurable elements:
Not all of these elements appear for every Event Definition. After you install and run SmartEvent for a short time, you will discover which of these elements need to be fine-tuned per Event Definition.
For configuration information regarding most objects in General Settings, see System Administration.
The Event Threshold allows you to modify the limits that, when exceeded, indicates that an event has occurred. The limits typically are the number of connections, logs, or failures, and the period of time in which they occurred. It appears thus:
Detect the event when more than x connections/logs/failures (etc.) were detected over a period of y seconds.
To decreasing the number of false alarms based on a particular event, increase the number of connections, logs or failures and/or the period of time for them to occur.
An event severity affects in which queries (among those that filter for severity) this type of event will appear.
To modify the severity of an event, select a severity level from the drop-down list.
When detected, an event can activate an Automatic Reaction. The SmartEvent administrator can create and configure one Automatic Reaction, or many, according to the needs of the system.
For example: A Mail Reaction can be defined to tell the administrator of events to which it is applied. Multiple Automatic Mail Reactions can be created to tell a different responsible party for each type of event.
To create an automatic reaction:
These are the types of Automatic Reactions:
You can send event fields in the SNMP Trap message. The format for such an event field is [seam_event_table_field]
AdditionalInfo varchar(1024)
AutoReactionStatus varchar(1024)
Category varchar(1024)
DetectedBy integer
DetectionTime integer
Direction integer
DueDate integer
EndTime integer
EventNumber integer
FollowUp integer
IsLast integer
LastUpdateTime integer
MaxNumOfConnections integer
Name varchar(1024) ,NumOfAcceptedConnections integer
NumOfRejectedConnections integer
NumOfUpdates integer
ProductCategory varchar(1024)
ProductName varchar(1024)
Remarks varchar(1024)
RuleID varchar(48)
Severity integer
StartTime integer
State integer
TimeInterval integer
TotalNumOfConnections varchar(20)
User varchar(1024)
Uuid varchar(48)
aba_customer varchar(1024)
jobID varchar(48)
policyRuleID varchar(48)
These sections tell how to add an Automatic Reaction to an event:
You can create Automatic reaction from:
The first step for each of the next procedures assumes that you are at one of the starting points above.
Note - the Subject field has the default variables of [EventNumber] - [Severity] - [Name]. These variables automatically adds to the mail subject the event number, severity and name of the event that triggered this reaction. These variables can be removed at your discretion.
The command send_snmp$CPDIR/lib/snmp/
When the automatic reaction occurs, the SNMP Trap is sent as a 256 byte DisplayString
To add an External Script:
$RTDIR/binext_commandsmkdir $RTDIR/bin/ext_commands$RTDIR/bin/ext_commands/chmod +x <script_filename>$RTDIR/bin/ext_commands/$RTDIR/bin/ext_commands/Guidelines for creating the script
To refer to the event in the script, define this environment variable:
EVENT=$(cat)
and use $EVENT
Use line editor commands like awksed$EVENT
--------------------------------------------------------------------------------------------------
The format of the event content is a name-value set – a structured set of fields that have the form:
(name: value ;* );
where name is a string and value is either free text until a semicolon, or a nested name-value set.
The following is a sample event:
(Name: Check Point administrator credential guessing; RuleID: {F182D6BC-A0AA-444a-9F31-C0C22ACA2114}; Uuid: <42135c9c,00000000,2e1510ac,131c07b6>; NumOfUpdates: 0; IsLast: 0; StartTime: 16Feb2015 16:45:45; EndTime: Not Completed; DetectionTime: 16Feb2015 16:45:48; LastUpdateTime: 0; TimeInterval: 600; MaxNumOfConnections: 3; TotalNumOfConnections: 3; DetectedBy: 2886735150; Origin: (IP: 192.0.2.4; repetitions: 3; countryname: United States; hostname: theHost) ; ProductName: SmartDashboard; User: XYZ; Source: (hostname: theHost; repetitions: 3; IP: 192.0.2.4; countryname: United States) ; Severity: Critical; EventNumber: EN00000184; State: 0; NumOfRejectedConnections: 0; NumOfAcceptedConnections: 0) ;
--------------------------------------------------------------------------------------------------
If you need to refer to more fields, you can add them to the event:
You can add an Automatic Reaction for SmartEvent to run when this type of event is detected.
Working Hours are used to detect unauthorized attempts to access protected systems and other forbidden operations after-hours. To set the Regular Working Hours for an event, select a Time Object that you have configured from the drop-down list.
To create a Time Object:
To assign a Time Object to an event:
Exceptions allow an event to be independently configured for the sources or destinations that appear. For example, if the event Port Scan from Internal Network is set to detect an event when 30 port scans have occurred within 60 seconds, you can also define that two port scans detected from host A in 10 seconds of each other is also an event.
To manually add an exception, under the heading Apply the following exceptions, click Add and select the Source and/or Destination of the object to apply different criteria for this event.
|
Note - If you do not see the host object listed, you may need to create it in SmartEvent. |
To modify or delete existing exceptions, select Edit or Remove, respectively.
To create a user-defined event you must have knowledge of the method by which SmartEvent identifies events. This section starts with a high level overview of how logs are analyzed to conclude if an event occurs or occurred.
Events are detected by the SmartEvent Correlation Unit. The SmartEvent Correlation Unit scans logs for criteria that match an Event Definition.
SmartEvent uses these procedures to identify these events:
When the SmartEvent Correlation Unit reads a log, it first checks if the log matches all defined Global Exclusions. Global Exclusions (defined on the Policy tab > Event Policy > Global Exclusions) direct SmartEvent to ignore logs that are not expected to contribute to an event.
If the log matches a Global Exclusion, it is discarded by the system. If not, the SmartEvent Correlation Unit starts to match it against each Event Definition.
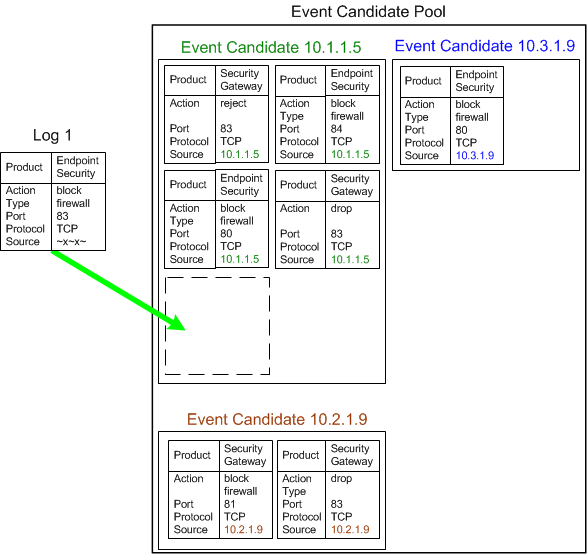
Each Event Definition contains a filter which is comprised of a number of criteria that must be found in all matching logs. The criteria are divided by product: The Event Definition can include a number of different products, but each product has its own criterion.
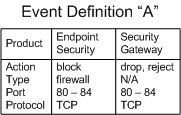
To match the Event Definition "A", a log from Endpoint Security must match the Action, Event Type, Port, and Protocol values listed in the Endpoint Security column. A log from a Security Gateway must match the values listed in its column.
SmartEvent divides this procedure into two steps. The SmartEvent Correlation Unit first checks if the Product value in the log matches one of the permitted Product values of an Event Definition.
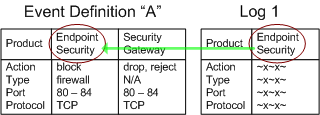
If Log 1 did not contain a permitted Product value, the SmartEvent Correlation Unit compares the log against Event Definition "B", and so on. If the log fails to match against an Event Definition, it is discarded.
The SmartEvent Correlation Unit checks if the log contains the Product-specific criteria to match the Event Definition. For example: The product Endpoint Security generates logs that involve the Firewall, Spyware, Malicious Code Protection, and others. The log contains this information in the field Event Type. If an event is defined to match on Endpoint Security logs with the event type Firewall, an Endpoint Security log with Event Type "Spyware" fails against the Event Definition filter. Other criteria can be specified to the Product.
In our example, Log 1 matched Event Definition "A" with a permitted product value. The SmartEvent Correlation Unit examines if the log contains the necessary criteria for an Endpoint Security log to match.
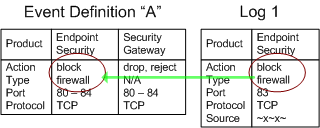
If the criteria do not match, the SmartEvent Correlation Unit continues to compare the log criteria to other event definitions.
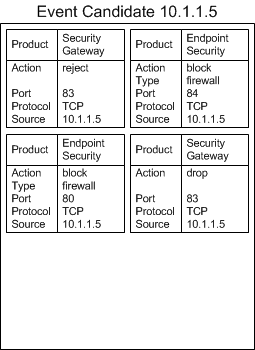
When a log matches the criteria, it is added to an Event Candidate. Event candidates let SmartEvent track logs until an event threshold is crossed, at which point an event is generated.
Notes -
Each Event Definition can have multiple event candidates, each of which keeps track of logs grouped by equivalent properties. In the figure above the logs that create the event candidate have a common source value. They were dropped, blocked or rejected by a Firewall. They are grouped together because the Event Definition is designed to detect this type of activity, that originates from one source.
When a log matches the event definition, but has properties different than those of the existing event candidates, a new event candidate is created. This event candidate is added to what can be thought of as the Event Candidate Pool.
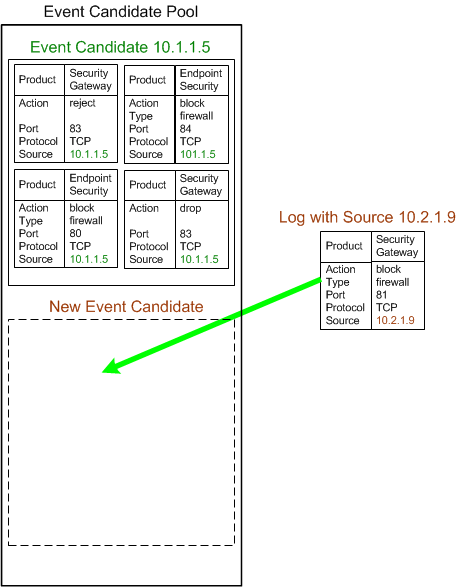
Note - SmartEvent creates a new event candidate for a log with a different source.
To illustrate more, an event defined detects a high rate of blocked connections. SmartEvent tracks the number of blocked connections for each Firewall, and the logs of the blocked traffic at each Firewall forms an event candidate. When the threshold of blocked connection logs from a Firewall is surpassed, that Firewall event candidate becomes an event. While this Event Definition creates one event candidate for each Firewall monitored, other Event Definitions can create many more.
The Event Candidate Pool is a dynamic environment, with new logs added and older logs discarded when they have exceeded an Event Definition time threshold.
When a candidate becomes an event, the SmartEvent Correlation Unit forwards the event to the Event Database. But to discover an event does not mean that SmartEvent stops to track logs related to it. The SmartEvent Correlation Unit adds matching logs to the event as long as they continue to arrive during the event threshold. To keep the event open condenses what can appear as many instances of the same event to one, and provides accurate, up-to-date information as to the start and end time of the event.
To create New Event Definitions, right-click an existing Event Definition, or use the Actions menu:
Right Click |
Actions Menu |
Description |
|---|---|---|
New |
New Custom Event |
Launches the Event Definition Wizard, which allows you to select how to base the event: on an existing Event Definition, or from scratch. |
Save As |
Save Event As |
Creates an Event Definition based on the properties of the highlighted Event Definition. When you select Save As, the system prompts you to save the selected Event Definition with a new name for later editing. Save As can also be accessed from the Properties window. |
All User Defined Events are saved at Policy tab > Event Policy > User Defined Events. When an Event Definition exists it can be modified through the Properties window, available by right-click and from the Actions menu.
To create a User Defined Event based on an existing event:
The Event Definition Wizard opens.
Click Next.
Click Next.
Click Next.
Select the field(s) by which distinct Event Candidates will be created allows you to set the field (or set of fields) that are used to differentiate between Event Candidates.
To edit a user-defined event:
This screen defines how SmartEvent counts logs related to this event.
When an event is generated, information about the event is presented in the Event Detail pane.
This screen lets you specify if the information will be added to the detailed pane and from which Log Field the information is taken.
You can clear it in the Display column. The Event Field will not be populated.
All events can be configured. This screen lets you select the configuration parameters that show.
This section shows you how to reduce false positives.
Some types of services are characterized by a high quantity of traffic that can be misidentified as events. These are examples of services and protocols that can potentially generate events:
The information in this table provides a list of server types where high activity is frequently used. To change the Event Policy, adjust event thresholds and add Exclusions for servers and services . You can decrease more the quantity of false positives detected.
Common events by service
Server Type |
Category |
Event Name |
Source |
Dest |
Service |
Reason |
|---|---|---|---|---|---|---|
SNMP |
Scans |
IP sweep from internal network |
Any |
Any |
SNMP-read |
Hosts that query other hosts |
DNS Servers |
Scans |
IP sweep from internal network |
DNS servers |
- |
DNS |
Inter-DNS servers updates |
|
Denial of Service (DoS) |
High connection rate on internal host on service |
Any |
DNS servers |
DNS |
DNS requests and inter-DNS servers updates |
|
Anomalies |
High connection rate from internal network |
Any |
Any |
DNS |
DNS requests and inter-DNS servers updates |
|
Anomalies |
High connection rate from internal network on service |
Any |
Any |
DNS |
DNS requests and inter-DNS servers updates |
|
Anomalies |
Abnormal activity on service |
Any |
Any |
DNS |
DNS requests and inter-DNS servers updates |
NIS Servers |
Scans |
Port scan from internal network |
NIS servers |
Any |
- |
Multiple NIS queries |
|
Denial of Service (DoS) |
High connection rate on internal host on service |
Any |
NIS servers |
NIS |
NIS queries |
|
Anomalies |
High connection rate from internal network |
Any |
Any |
NIS |
NIS queries |
|
Anomalies |
High connection rate from internal network on service |
Any |
Any |
NIS |
NIS queries |
|
Anomalies |
Abnormal activity on service |
Any |
Any |
NIS |
NIS queries |
LDAP Servers |
Denial of Service (DoS) |
High connection rate on internal host on service |
Any |
LDAP servers |
LDAP |
LDAP requests |
|
Anomalies |
High connection rate from internal network |
Any |
LDAP servers |
LDAP |
LDAP requests |
|
Anomalies |
High connection rate from internal network on service |
Any |
LDAP servers |
LDAP |
LDAP requests |
|
Anomalies |
Abnormal activity on service |
Any |
LDAP servers |
LDAP |
LDAP requests |
HTTP Proxy Servers - Hosts To Proxy Server |
Denial of Service (DoS) |
High connection rate on internal host on service |
Any |
Proxy servers |
HTTP:8080 |
Hosts connections to Proxy servers |
|
Anomalies |
High connection rate from internal network |
Any |
Proxy servers |
HTTP:8080 |
Hosts connections to Proxy servers |
|
Anomalies |
High connection rate from internal hosts on service |
Any |
Proxy servers |
HTTP:8080 |
Hosts connections to Proxy servers |
|
Anomalies |
Abnormal activity on service |
Any |
Proxy servers |
HTTP:8080 |
Hosts connections to Proxy servers |
HTTP Proxy Servers - Out to the Web |
Scans |
IP sweep from internal network |
Proxy servers |
Any |
HTTP/ HTTPS |
Proxy servers connections out to various sites |
|
Denial of Service (DoS) |
High connection rate on internal host on service |
Proxy servers |
Any |
HTTP/ HTTPS |
Proxy servers connections out to various sites |
|
Anomalies |
High connection rate from internal network |
Proxy servers |
Any |
HTTP/ HTTPS |
Proxy servers connections out to various sites |
|
|
High connection rate from internal hosts on service |
Proxy servers |
Any |
HTTP/ HTTPS |
Proxy servers connections out to various sites |
|
Anomalies |
Abnormal activity on service |
Proxy servers |
Any |
HTTP/ HTTPS |
Proxy servers connections out to various sites |
UFP Servers |
Denial of Service (DoS) |
High connection rate on internal host on service |
Any |
UFP servers |
Any/UFP by vendor |
Firewall connections to UFP servers |
|
Anomalies |
High connection rate from internal network |
Any |
UFP servers |
Any/UFP by vendor |
Firewall connections to UFP servers |
|
Anomalies |
High connection rate from internal hosts on service |
Any |
UFP servers |
Any/UFP by vendor |
Firewall connections to UFP servers |
|
Anomalies |
Abnormal activity on service |
Any |
UFP servers |
Any/UFP by vendor |
Firewall connections to UFP servers |
CVP Servers Request |
Denial of Service (DoS) |
High connection rate on internal host on service |
Any |
CVP servers |
Any/CVP by vendor |
Firewall connections to CVP servers |
|
Anomalies |
High connection rate from internal network |
Any |
CVP servers |
Any/CVP by vendor |
Firewall connections to CVP servers |
|
Anomalies |
High connection rate from internal hosts on service |
Any |
CVP servers |
Any/CVP by vendor |
Firewall connections to CVP servers |
|
Anomalies |
Abnormal activity on service |
Any |
CVP servers |
Any/CVP by vendor |
Firewall connections to CVP servers |
CVP Servers Replies |
Scans |
Port scans from internal network |
CVP servers |
Any |
- |
Multiple CVP replies to same GW |
|
Scans |
IP sweep from internal network |
CVP servers |
- |
CVP |
CVP replies to multiple GWs |
|
Denial of Service (DoS) |
High connection rate on internal host on service |
CVP servers |
Any |
Any/CVP by vendor |
CVP replies |
|
Anomalies |
High connection rate from internal network |
CVP servers |
Any |
Any/CVP by vendor |
CVP replies |
|
Anomalies |
High connection rate from internal hosts on service |
CVP servers |
Any |
Any/CVP by vendor |
CVP replies |
|
Anomalies |
Abnormal activity on service |
CVP servers |
Any |
Any/CVP by vendor |
CVP replies |
UA Server Request |
Denial of Service (DoS) |
High connection rate on internal host on service |
Any |
UA servers |
uas-port (TCP:19191 TCP:19194) |
Connections to UA servers |
|
Anomalies |
High connection rate from internal network |
Any |
UA servers |
(TCP:19191 TCP:19194) |
Connections to UA servers |
|
Anomalies |
High connection rate from internal hosts on service |
Any |
UA servers |
uas-port (TCP:19191 TCP:19194) |
Connections to UA servers |
|
Anomalies |
Abnormal activity on service |
Any |
UA servers |
uas-port (TCP:19191 TCP:19194) |
Connections to UA servers |
UA Servers Replies |
Scans |
Port scans from internal network |
UA servers |
Any |
- |
Multiple UA replies to the same computer |
|
Scans |
IP sweep from internal network |
UA servers |
Any |
uas-port (TCP:19191 TCP:19194) |
Multiple UA replies to multiple computers |
|
Denial of Service (DoS) |
High connection rate on internal host on service |
UA servers |
Any |
uas-port (TCP:19191 TCP:19194) |
UA replies |
|
Anomalies |
High connection rate from internal network |
UA servers |
Any |
uas-port (TCP:19191 TCP:19194) |
UA replies |
|
Anomalies |
High connection rate from internal hosts on service |
UA servers |
Any |
uas-port (TCP:19191 TCP:19194) |
UA replies |
|
Anomalies |
Abnormal activity on service |
UA servers |
Any |
uas-port (TCP:19191TCP:19194) |
UA replies |
SMTP Servers |
Scans |
IP sweep from internal network |
SMTP servers |
- |
SMTP |
SMTP servers connections out to various SMTP servers |
|
Denial of Service (DoS) |
High connection rate on internal host on service |
SMTP servers |
Any |
SMTP |
SMTP servers connections out to various SMTP servers |
|
Anomalies |
High connection rate from internal network |
SMTP servers |
Any |
SMTP |
SMTP servers connections out to various SMTP servers |
|
Anomalies |
High connection rate from internal hosts on service |
SMTP servers |
Any |
SMTP |
SMTP servers connections out to various SMTP servers |
|
Anomalies |
Abnormal activity on service |
SMTP servers |
Any |
SMTP |
SMTP servers connections out to various SMTP servers |
Anti-Virus Definition Servers |
Scans |
IP sweep from internal network |
AV_Defs servers |
- |
Any/AV by vendor |
Anti-Virus definitions updates deployment |
|
Denial of Service (DoS) |
High connection rate on internal host on service |
AV_Defs servers |
- |
Any/AV by vendor |
Anti-Virus definitions updates deployment |
|
Anomalies |
High connection rate from internal network |
AV_Defs servers |
- |
Any/AV by vendor |
Anti-Virus definitions updates deployment |
|
Anomalies |
High connection rate from internal hosts on service |
AV_Defs servers |
- |
Any/AV by vendor |
Anti-Virus definitions updates deployment |
|
Anomalies |
Abnormal activity on service |
AV_Defs servers |
- |
Any/AV by vendor |
Anti-Virus definitions updates deployment |
To maintain your SmartEvent system, you can do these tasks from the General Settings section of the Policy tab:
Modifications to the Event Policy do not take effect until saved on the SmartEvent server and installed to the SmartEvent Correlation Unit.
To enable changes made to the Event Policy:
You can undo changes to the Event Policy, if they were not saved.
To undo changes: click File > Revert Changes.
Certain objects from the Management server are added during the initial sync with the SmartEvent server and updated at a set interval. But it is useful (or necessary) to add other Network or Host objects, for these reasons:
These screens are locked until initial sync is complete:
You can make a device available to use in SmartEvent.
To make a device that is a host object available in SmartEvent:
To make a device that is a network object available in SmartEvent:
See Defining the Internal Network for information about how to add objects to the Internal Network definition.
To help SmartEvent conclude if events originated internally or externally, you must define the Internal Network. These are the options to calculate the traffic direction:
To define the Internal Network:
We recommend you add all internal Network objects, and not Host objects.
Some network objects are copied from the Management server to the SmartEvent Server during the initial sync and updated afterwards.
These screens are locked until initial sync is complete:
The SmartEvent database keeps a synchronized copy of management objects locally on the SmartEvent Server. This process, dbsync, allows SmartEvent to work independently of different management versions and different management servers in a High Availability environment.
Management High Availability capability exists for Security Management Servers, and in a Multi-Domain Security Management environment, dbsync
Dbsync initially connects to the management server with which SIC is established. It retrieves all the objects. After the initial synchronization it gets updates when an object is saved. Dbsync registers all the High Availability management machines and periodically tests the connectivity with the newest management server. If connectivity is lost, it attempts to connect to the other High Availability management servers until it finds an active one and connects to it.
If two management servers are active concurrently, dbsync stays connected to one management server. Dbsync does not get changes made on the other management server until a synchronization operation is done.
In SmartConsole, you can configure a Security Gateway, that when it fails to send its logs to one Log Server, it will send its logs to a secondary Log Server. To support this configuration, you can add Log Servers to a single SmartEvent Correlation Unit. In this way, the SmartEvent Correlation Unit gets an uninterrupted stream of logs from both servers and continues to correlate all logs.
Multiple correlation units can read logs from the same Log Servers. That way, the units provide redundancy if one of them fails. The events that the correlation units detect are duplicated in the SmartEvent database. But these events can be disambiguated if you filter them with the Detected By field in the Event Query definition. The Detected By field specifies which SmartEvent Correlation Unit detected the event.
If the SmartEvent Server becomes unavailable, the correlation units keep the events until it can reconnect with the SmartEvent Server and forward the events.

