|
|
|
In This Section: |
You can create rich and customizable views and reports for log and event monitoring. These inform key stakeholders about security activities.
Use these GUIs:
https://<Server IP>/smartview/<Server IP> is IP address of the Security Management Server or SmartEvent server.
To enable SmartEvent views and reports, you must install and configure a SmartEvent Server.
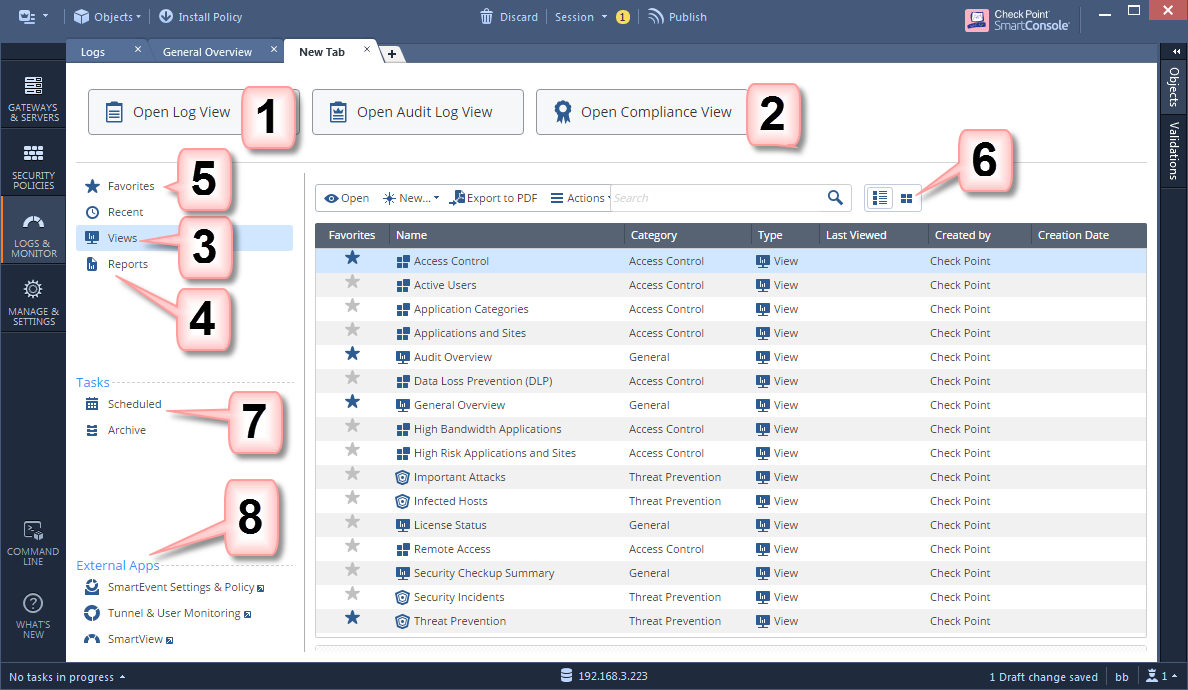
In the Logs & Monitor view, click the (+) tab to open a catalog of all views and reports, predefined and customized. Click a view or report to open it.
Item |
Description |
|---|---|
1 |
Open Log View - See and search through the logs from all Log Servers. You can also search the logs from a Log Server that you choose. Open Audit Logs View - See and search records of actions done by SmartConsole administrators. These views come from the Log Servers. Other views come from the SmartEvent Server. |
2 |
Compliance View - Optimize your security settings and ensure compliance with regulatory requirements. |
3 |
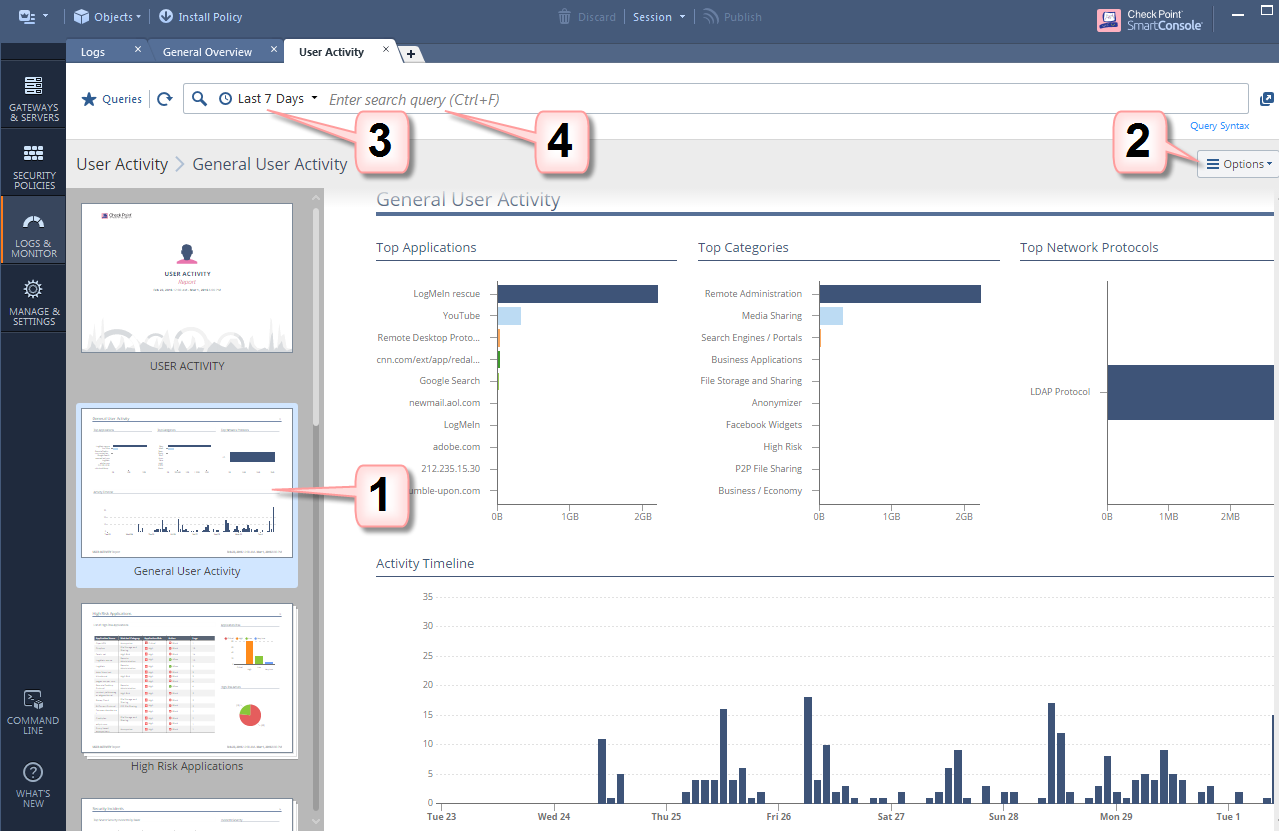
Views - The list of predefined and customized views. A view is an interactive dashboard made up of widgets. The view tells administrators and other stakeholders about security and network events. Each widget is the output of a query. Widgets can show the information as a chart, table, or some other format. To find out more about the events, double-click a widget to drill down to a more specific view or raw log files. |
4 |
Reports - The list of predefined and customized reports. A report has multiple pages, and applies to the time that the report is generated. There are several predefined reports, and you can create new reports. A reports gives more details than a view. Reports can be customized, filtered, generated and scheduled. You cannot drill down into a report. |
5 |
Favorites - Use this view to collect the views and reports you use the most. |
6 |
Switch to Table View or Thumbnails View - The Table view is the default for views and reports. The Thumbnails view is the default for the Favorites and Recent views and reports |
7 |
Scheduled Tasks - See and edit scheduled tasks. Archive - Completed and in-progress tasks for generating and exporting reports. |
8 |
External Apps
|
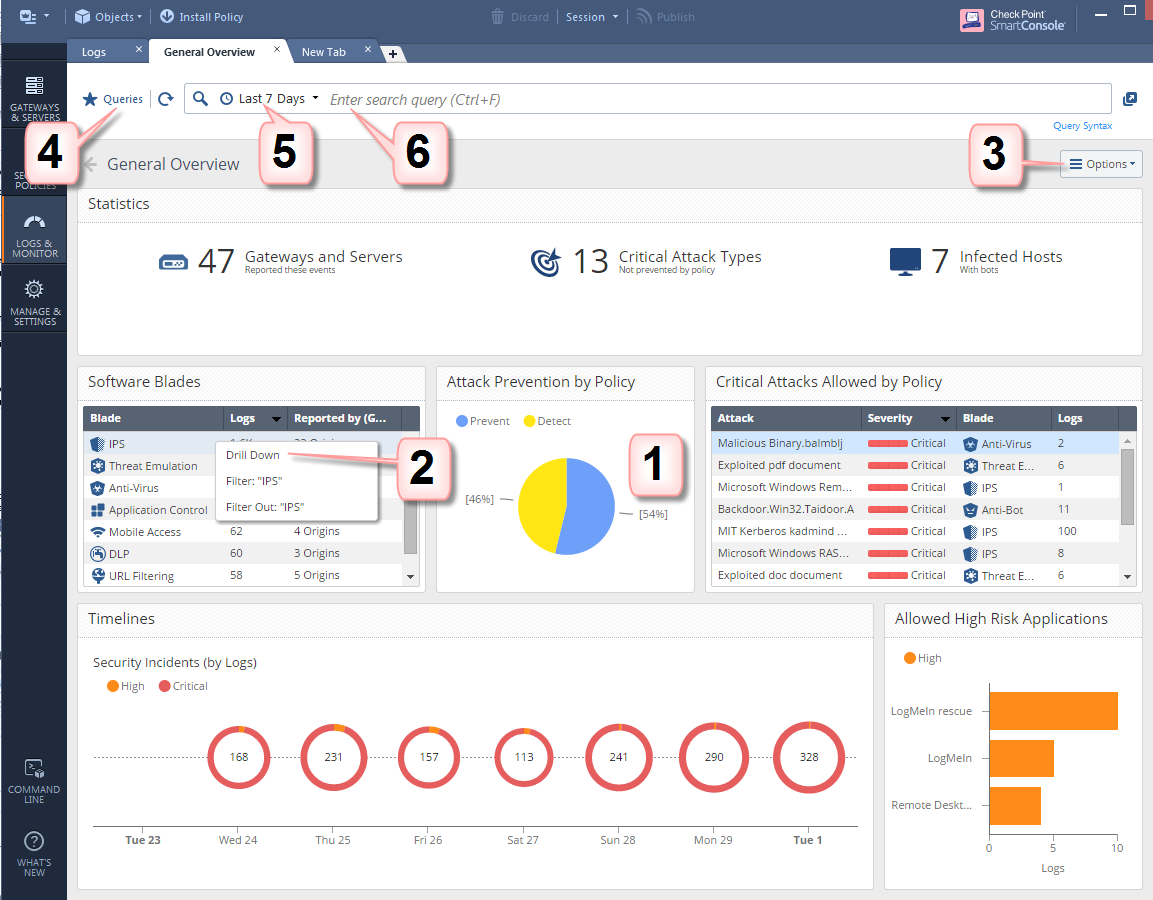
Views tells administrators and other stakeholders about security and network events. A view is an interactive dashboard made up of widgets. Each widget is the output of a query. A Widget can show information in different formats, for example, a chart or a table.
SmartConsole comes with several predefined views. You can create new views that match your needs, or you can customize an existing view.
In the Logs & Monitor view, clicking the (+) tab opens a catalog of all views and reports, predefined and customized. Double-click a view to open it.
Item |
Description |
|---|---|
1 |
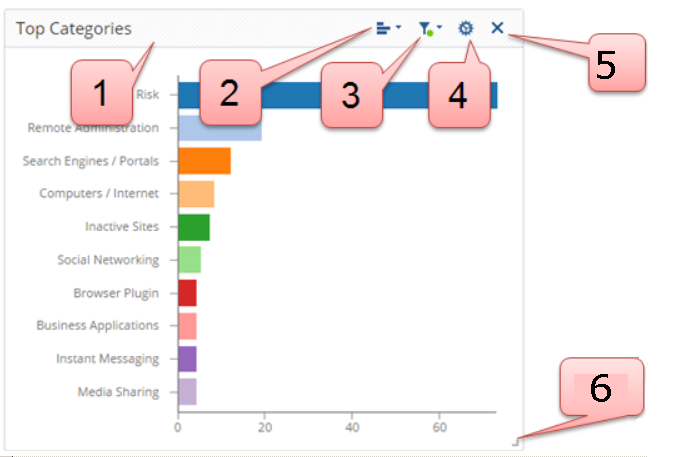
Widget- The output of a query. A Widget can show information in different formats, for example, a chart or a table. |
2 |
Drill Down - To find out more about the events, double-click a widget to drill down to a more specific view or raw log files. |
3 |
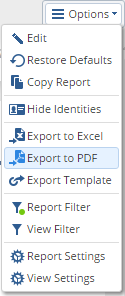
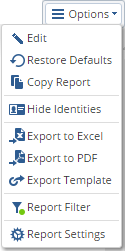
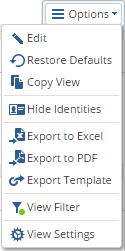
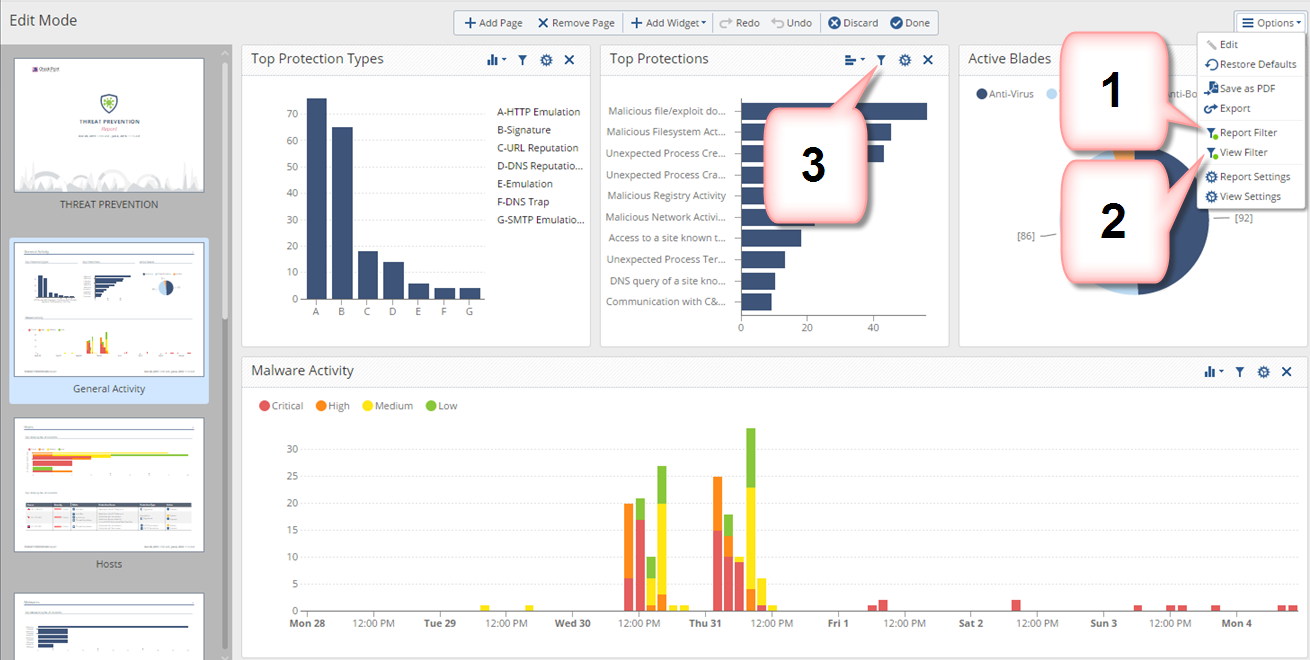
Options - Customize the view, restore defaults, Hide Identities, export. |
4 |
Queries - Predefined and favorite search queries |
5 |
Time Period - Specify the time periods for the view. |
6 |
Query search bar - Define custom queries using the GUI tools, or manually entering query criteria. Shows the query definition for the most recent query. |
A report has multiple pages, and applies to the time that the report is generated.
A page is an interactive dashboard made up of widgets. Each widget displays the output of a query.
There are several predefined reports, and you can create new reports. A report gives more details than a view. Reports can be customized, filtered, generated and scheduled. You cannot drill down into a report.
In the Logs & Monitor view, clicking the (+) tab opens a catalog of all views and reports, predefined and customized. Double-click a report to open it.
Item |
Description |
|---|---|
1 |
Preview bar - A report is divided onto pages, usually, one view on one page. Editing a report is done per page, in the same way as you edit a view. |
2 |
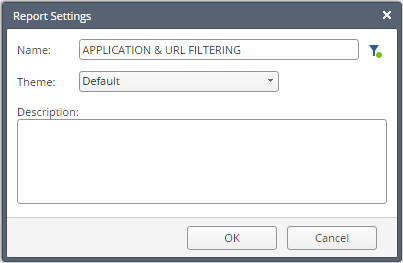
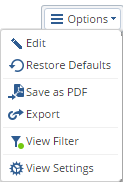
Options - Customize, and generate a report. |
3 |
Time Period - Specify the time periods for the report. |
4 |
Query Search bar - Define custom queries using the GUI tools, or manually entering query criteria. Shows the query definition for the most recent query. |
SmartEvent automatically downloads new predefined views and reports, and downloads updates to existing predefined ones. To allow this, make sure the management server has Internet connectivity to the Check Point Support Center.
Use the predefined graphical views and reports for the most frequently seen security issues. You can also customize the views and reports.
To open a view or report:
The Export to PDF and Export to Excel options save the current view or report as a PDF or Excel file, based on the defined filters and time frame.
To export a view or report to PDF or Excel:
Alternatively, click Open and from inside the view or report click Options > Export to PDF or Export to Excel.
To see your exported views and reports:
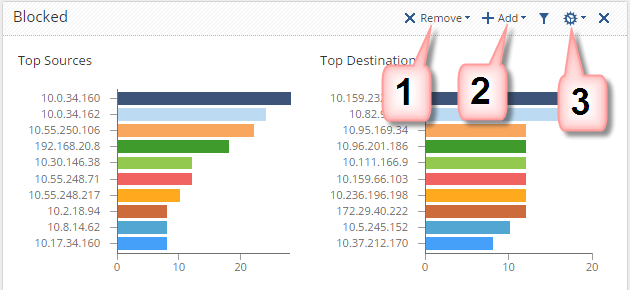
The Network Activity report shows important firewall connections. For example, top sources, destinations, and services. To create this report, SmartEvent must first index the firewall logs.
To enable the Network Activity Report for R80.10 and higher Gateways:
In SmartConsole, in the Access Control Policy rule, add per Session to the Track settings.
To enable the Network Activity Report for Pre-R80.10 Gateways:
Note - this configuration increases the number of events per day by about five times. To avoid a performance impact, make sure the hardware can handle the load.
To run the Network Activity Report:
You can export the view or report layout and widget definitions to a file. This is called a template. You can import the template from another server, or from another administrator.
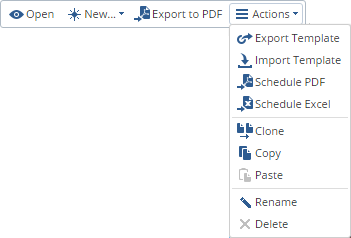
To export the view or report layout and widget definitions to a file, use the Export Template option
To import the file from another server, or from another administrator, use the Import Template option in the Catalog (new tab).
To schedule a view or report, you need to define and edit it in SmartConsole.
To schedule a report:
The Schedule page of the Export settings window opens.
To see your scheduled views and reports:
You can also add or remove pages by clicking one of these:
![]()
Note -
Views can be configured according to these options:
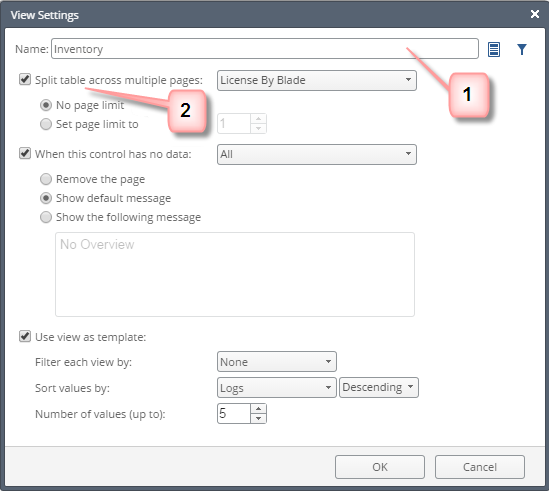
The No page limit option shows all the results for the selected table query, spread across as many pages as required.
Reports can be configured according to these options:
You can automatically send views and reports by email to specified recipients each time the view or report runs.
Mail server settings are shared for all email interactions. For each SmartConsole administrator, configure them one time.
To configure email server settings:
Define the email recipients every time you run the view or report, or one time for scheduled reports.
To configure email recipients:
You can configure reports to show your company logo on report cover pages. The Check Point logo shows on report cover pages.
To add a logo to your reports:
cover-company-logo.png.$RTDIR/smartview/conf directory on the SmartEvent server.Note: The best image dimensions are 152 pixels wide by 94 pixels high.
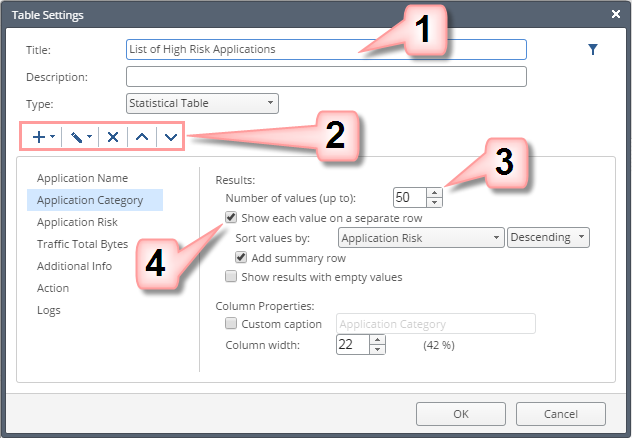
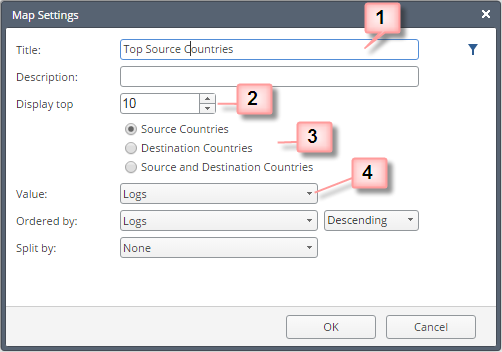
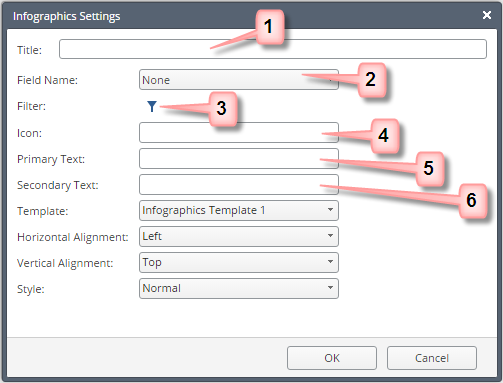
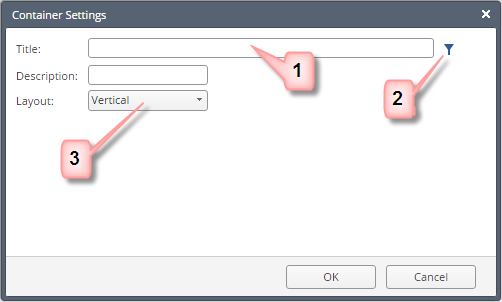
You can customize the widgets to optimize the visual display. To customize widgets, switch to edit mode. Click Options > Edit.
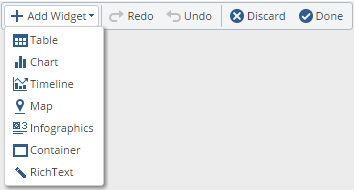
To add a Widget:
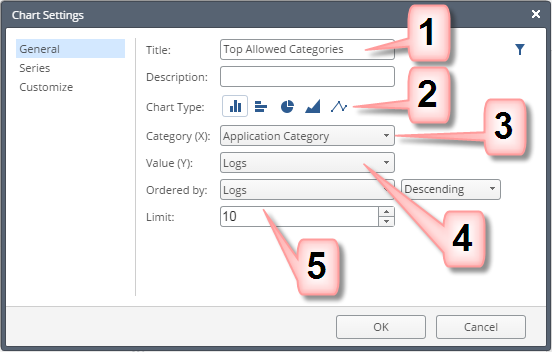
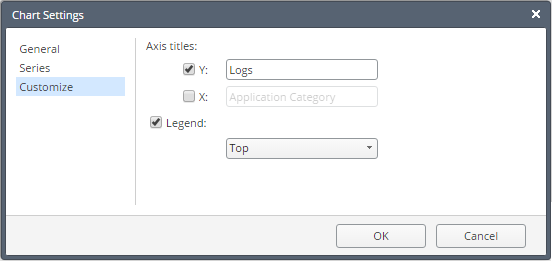
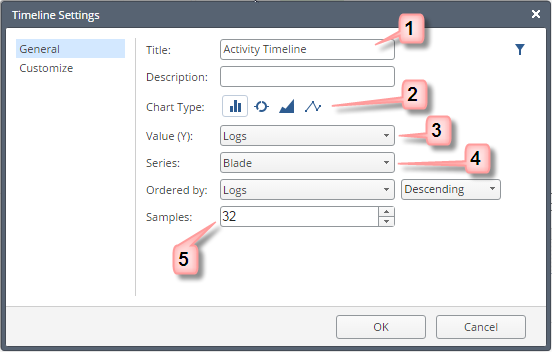
To customize a widget:
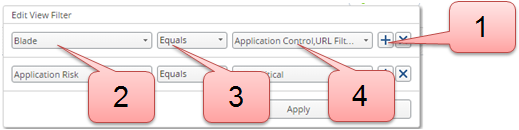
The search bar is used to apply on-demand filters, but you can also save filters with the view / report definition.
There are different layers of filters:
To edit the view filter:
You can filter reports, views and widgets for one or more Active Directory groups.