


|
|
|
In This Section: |
SmartConsole lets you transform log data into security intelligence. Search results are fast and immediately show the log records you need. The Security Gateways send logs to the Log Servers on the Security Management Server or on a dedicated server. Logs show on the SmartConsole Logs & Monitor Logs tab. You can:
This is a sample procedure that shows how to do an analysis of a log of a dropped connection.
To show a log of a dropped connection:
This shows the logs for connections that were dropped by the Rule Base.
The Log Details window opens.
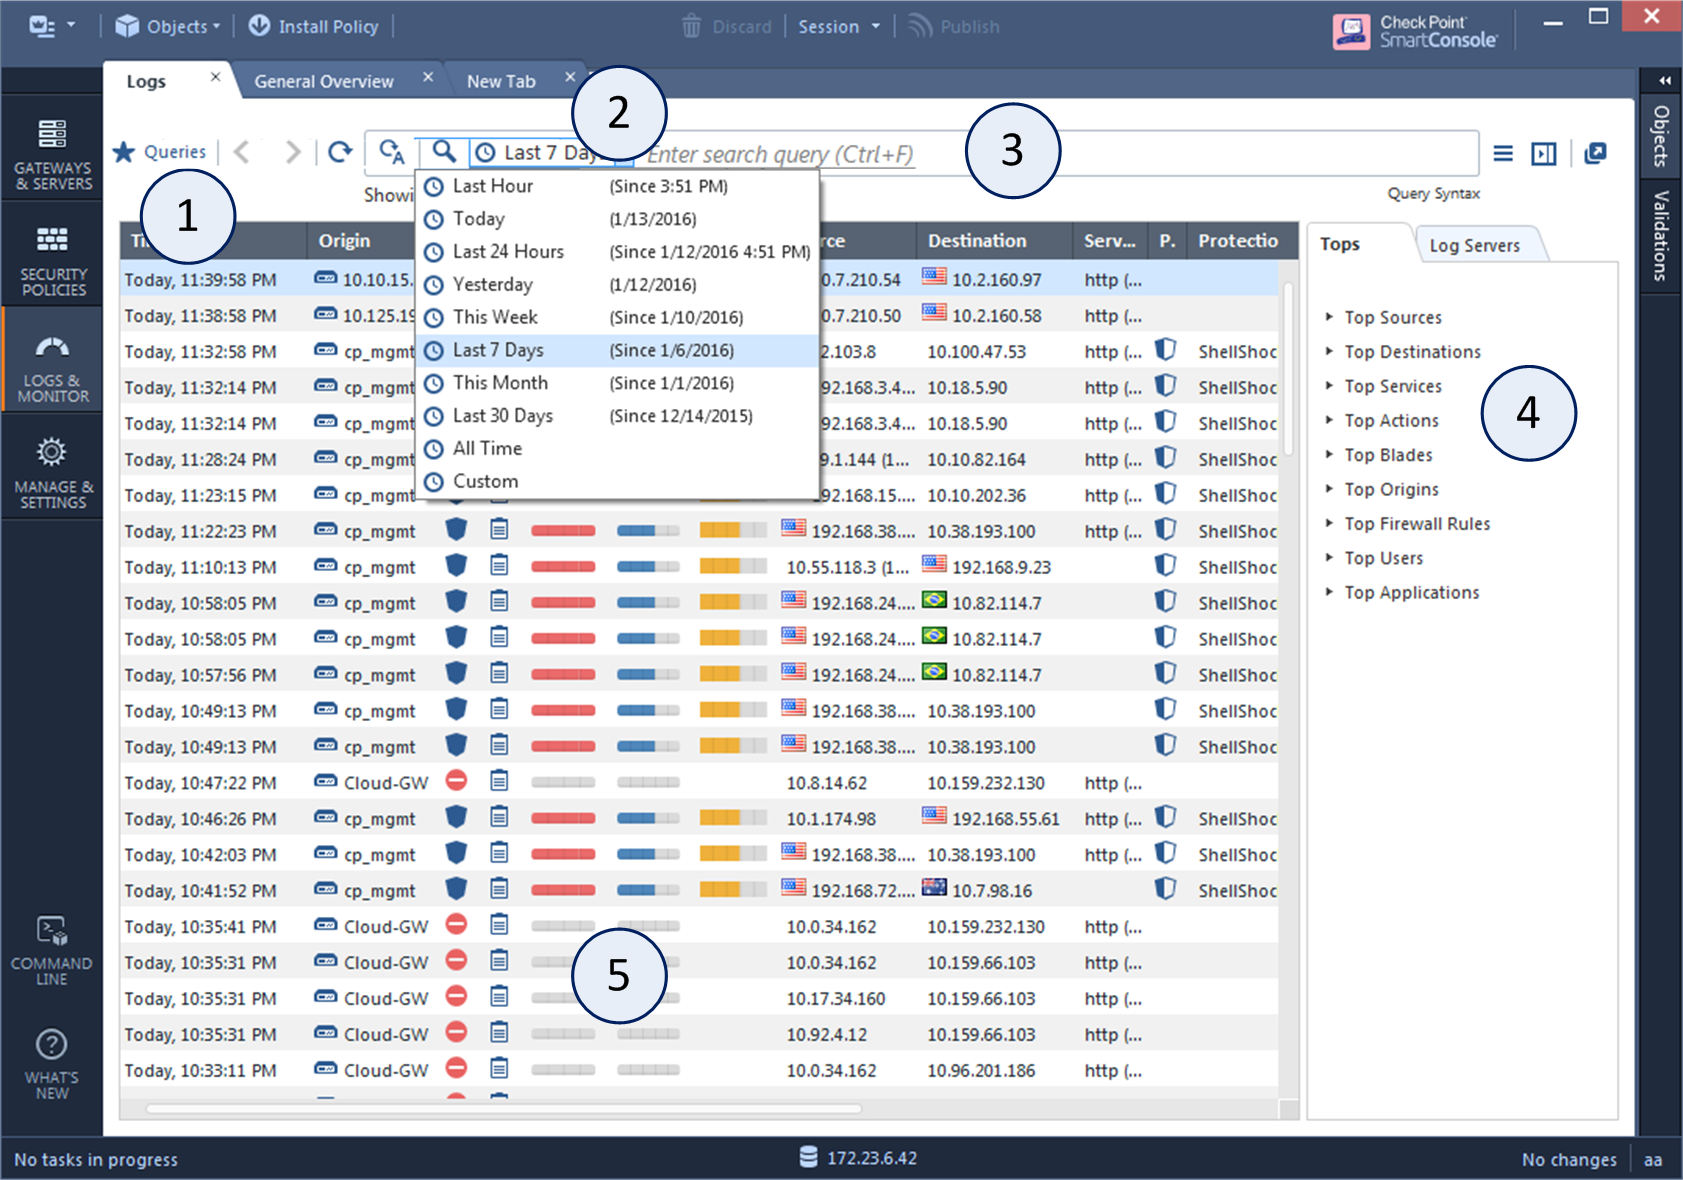
This is an example of the Log view.
Item |
Description |
|---|---|
1 |
Queries - Predefined and favorite search queries. |
2 |
Time Period - Search with predefined custom time periods. |
3 |
Query search bar - Define custom queries in this field. You can use the GUI tools or manually enter query criteria. Shows the query definition for the most recent query. |
4 |
Log statistics pane - Shows top results of the most recent query. |
5 |
Results pane - Shows log entries for the most recent query. |
In This Section: |
Logs are useful if they show the traffic patterns you are interested in. Make sure your Security Policy tracks all necessary rules. When you track multiple rules, the log file is large and requires more disk space and management operations.
To balance these requirements, track rules that can help you improve your cyber security, help you understand of user behavior, and are useful in reports.
To configure tracking in a rule:
Select these options in the Track column of a rule:
Note - When upgrading from R77.xx or from R80 versions to R80.10, there are changes to the names of the options in the Track column. To learn more see sk116580.
Advanced Track options
Detailed Log and Extended Log are only available if one or more of these Blades are enabled on the Layer: Applications & URL Filtering, Content Awareness, or Mobile Access.
Log Generation
Alert:
For each alert option, you can define a script in Menu > Global Properties > Log and Alert > Alerts.
A session is a user's activity at a specified site or with a specified application. The session starts when a user connects to an application or to a site. The Security Gateway includes all the activity that the user does in the session in one session log.
To search for log sessions:
In the Logs tab of the Logs & Monitor view, search for type:Session
To see details of the log session:
In the Logs tab of the Logs & Monitor view, select a session log.
In the bottom pane of the Logs tab, click the tabs to see details of the session log:
To see the session log for a connection that is part of a session:
To configure the session timeout:
By default, after a session continues for three hours, the Security Gateway starts a new session log. You can change this in SmartConsole from the Manage & Settings view, in Blades > Application & URL Filtering > Advanced Settings > General > Connection unification.
For sessions that are blocked by the Access Control Policy, the Security Gateway starts a new session log after 30 seconds. A blocked session log include all the connections that are blocked in this period.
You can search for the logs that are generated by a specific rule, from the Security Policy or from the Logs & Monitor > Logs tab.
To see logs generated by a rule (from the Security Policy):
To see logs generated by a rule (by Searching the Logs):
layer_uuid_rule_uuid:*_<UID>
For example, paste this into the query search bar and press Enter:
layer_uuid_rule_uuid:*_46f0ee3b-026d-45b0-b7f0-5d71f6d8eb10
You can capture network traffic. The content of the packet capture provides a greater insight into the traffic which generated the log. With this feature activated, the Security Gateway sends a packet capture file with the log to the log server. You can open the file, or save it to a file location to retrieve the information a later time.
The packet capture option is activated by default.
To deactivate packet capture:
To see a packet capture:
The Packet Capture Viewer Output window opens.
SmartConsole lets you quickly and easily search the logs with many predefined log queries, and an easy to use language for custom queries.
To create and run a query:
To manually refresh your query:
|
Click Refresh (F5). |
To continuously refresh your query (Auto-Refresh):
|
Click Auto-Refresh (F6). The icon is highlighted when Auto-Refresh is enabled. |
The query continues to update every five seconds while Auto-Refresh is enabled. If the number of logs exceeds 100 in a five-second period, the logs are aggregated, and the summary view shows. To see all logs aggregated in a specific time interval, click View.
Query results can include tens of thousands of log records. To prevent performance degradation, SmartConsole only shows the first set of results in the Results pane. Typically, this is a set of 50 results.
Scroll down to show more results. As you scroll down, SmartConsole extracts more records from the log index on the Security Management Server or Log Server, and adds them to the results set. See the number of results above the Results pane.
For example, on the first run of a query, you can see the first 50 results out of over 150,000 results. When you scroll down, you can see the first 100 results out of over 150,000.
By default, SmartConsole shows a predefined set of columns and information based on the selected blade in your query. This is known as the Column Profile. For example:
A column profile is assigned based on the blade that occurs most frequently in the query results. This is called Automatic Profile Selection, and is enabled by default.
The Column Profile defines which columns show in the Results Pane and in which sequence. You can change the Column Profile as necessary for your environment.
To use the default Column Profile assignments:
To manually assign Column Profile assignments by default:
To manually assign a different Column Profile:
To change a Column Profile:
The column is applicable to future sessions.
Queries can include one or more criteria. To create custom queries, use one or a combination of these basic procedures:
To create a new custom query, run an existing query, and use one of these procedures to change it. You can save the new query in the Favorites list.
When you create complex queries, the log search tool suggests, or automatically enters, an appropriate Boolean operator. This can be an implied AND operator, which does not explicitly show.
You can enter query criteria directly from the Query search bar.
To select field criteria:
You can use the column headings in the Grid view to select query criteria. This option is not available in the Table view.
To select query criteria from grid columns:
To enter more criteria, use this procedure or other procedures.
You can enter query criteria directly in the Query search bar. You can manually create a new query or make changes to an existing query that shows in the Query search bar.
As you enter text, the Search shows recently used query criteria or full queries. To use these search suggestions, select them from the drop-down list. If you make a syntax error in a query, the Search shows an error message that identifies the error and suggests a solution.
A powerful query language lets you show only selected records from the log files, according to your criteria. To create complex queries, use Boolean operators, wildcards, fields, and ranges. This section refers in detail to the query language.
When you use SmartConsole to create a query, the applicable criteria show in the Query search bar.
The basic query syntax is [<Field>:] <Filter Criterion>.
To put together many criteria in one query, use Boolean operators:
[<Field>:] <Filter Criterion> AND|OR|NOT [<Field>:] <Filter Criterion> ...
Most query keywords and filter criteria are not case sensitive, but there are some exceptions. For example, source:<X> is case sensitive (Source:<X> does not match). If your query results do not show the expected results, change the case of your query criteria, or try upper and lower case.
When you use queries with more than one criteria value, an AND is implied automatically, so there is no need to add it. Enter OR or other boolean operators if needed.
Criteria values are written as one or more text strings. You can enter one text string, such as a word, IP address, or URL, without delimiters. Phrases or text strings that contain more than one word must be surrounded by quotation marks.
One word string examples:
Phrase examples
"John Doe""Log Out""VPN-1 Embedded Connector"IPv4 and IPv6 addresses used in log queries are counted as one word. Enter IPv4 address with dotted decimal notation and IPv6 addresses with colons. You can also use the '*' wildcard character with IP addresses.
Example:
You can use NOT <field> values with field keywords in log queries to find logs for which the value of the field is not the value in the query.
Syntax
NOT <field>:<value>
Example
NOT src:10.0.4.10
You can use the standard wildcard characters (* and ?) in queries to match variable characters or strings in log records. You can use more than the wildcard character.
Wildcard syntax
Examples:
If your criteria value contains more than one word, you can use the wildcard in each word. For example, 'Jo* N*' shows Joe North, John Natt, Joshua Named, and so on.
The wildcard character is useful when used with IPv4 addresses. It is a best practice to put the wildcard character after an IP address delimiter.
Examples:
You can use predefined field names as keywords in filter criteria. The query result only shows log records that match the criteria in the specified field. If you do not use field names, the query result shows records that match the criteria in all fields.
This table shows the predefined field keywords. Some fields also support keyword aliases that you can type as alternatives to the primary keyword.
Keyword |
Keyword Alias |
Description |
|---|---|---|
|
|
Severity of the event |
|
|
Potential risk from the application, of the event |
|
|
Name of the protection |
|
|
Type of protection |
|
|
Level of confidence that an event is malicious |
|
|
Action taken by a security rule |
|
|
Software Blade |
|
|
Traffic destination IP address, DNS name or Check Point network object name |
|
|
Name of originating Security Gateway |
|
|
Service that generated the log entry |
|
|
Traffic source IP address, DNS name or Check Point network object name |
|
|
User name |
Syntax for a field name query:
<field name>:<values>
To search for rule number, use the Rule field name. For example:
rule:7.1
If you use the rule number as a filter, rules in all the Layers with that number are matched.
To search for a rule name, you must not use the Rule field. Use free text. For example:
"Block Credit Cards"
Best practice: Do a free text search for the rule name. Make sure rule names are unique and not reused in different Layers.
Examples:
source:192.168.2.1action:(Reject OR Block)You can use the OR Boolean operator in parentheses to include multiple criteria values.
Important - When you use fields with multiple values, you must:
You can use the Boolean operators AND, OR, and NOT to create filters with many different criteria. You can put multiple Boolean expressions in parentheses.
If you enter more than one criteria without a Boolean operator, the AND operator is implied. When you use multiple criteria without parentheses, the OR operator is applied before the AND operator.
Examples:
blade:"application control" AND action:block 192.168.2.133 10.19.136.101 192.168.2.133 OR 10.19.136.101 (blade:Firewall OR blade:IPS OR blade:VPN) AND NOT action:drop AND NOT criterion.source:(192.168.2.1 OR 192.168.2.2) AND destination:17.168.8.2 17.168.8.2. This example also shows how you can use Boolean operators with field criteria.
