Configuring SmartView Monitor
How SmartView Monitor Works
Data for the status of all gateways in the system is collected by the Security Management Server and viewed in SmartView Monitor. The data shows status for:
- Check Point Security Gateways
- OPSEC gateways
- Check Point Software Blades
Gateway Status is the SmartView Monitor view which displays all component status information. A Gateway Status view displays a snapshot of all Software Blades, such as VPN and ClusterXL, as well as third party products (for example, OPSEC-partner gateways).
Gateway Status is similar in operation to the SNMP daemon that also provides a mechanism to get data about gateways in the system.
SIC is initialized between Security Gateways (local and remote) and the Security Management Server. The Security Management Server then gets status data from the Software Blades with the (Application Monitoring)protocol. SmartView Monitor gets the data from the Security Management Server.
AMON
The Security Management Server acts as an AMON client. It collects data about installed Software Blades. Each Security Gateway, or any other OPSEC gateway which runs an AMON server, acts as the AMON server itself. The gateway requests status updates from other components, such as the Firewall kernel and network servers. Requests are fetched at a defined interval.
An alternate source for status collection can be any AMON client, such as an OPSEC partner, which uses the AMON protocol.
The AMON protocol is SIC- based. It can collect data only after SIC is initialized.
Defining Status Fetch Frequency
The Security Management Server collects status data from the Security Gateways on a defined interval. The default is 60 seconds.
To set the Status Fetching Interval:
- Open SmartDashboard.
- Open > > .
- Enter the number of seconds in .
System Alerts and Thresholds
You can set thresholds for selected gateways. When a threshold is passed, a system alert is sent.
To set System Alert thresholds:
- Open view.
- Right-click a network object and select Configure Thresholds.
The window opens.
- Set the thresholds for the selected object:
- - All objects get the same thresholds for system alerts.
- - The selected gateway object will not have thresholds for system alerts.
- - Change the thresholds for the selected object to be different than the global settings.
To change Global Threshold settings:
- In the window, click .
The window opens.
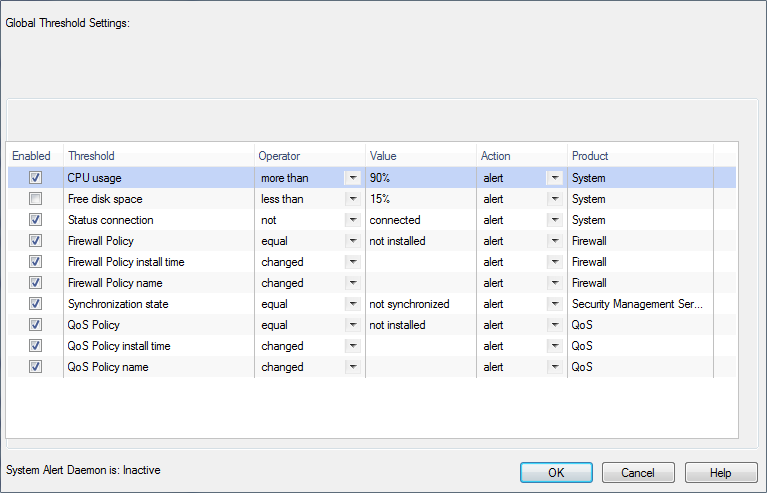
- Select thresholds to enable and set the operator and threshold value.
- In , select:
- - No alert.
- - Sends a log entry to the database.
- - Opens a pop-up window to your desktop.
- - Sends a mail alert to your Inbox.
- - Sends an SNMP alert.
- - Runs a script. Make sure a user-defined action is available. Go to SmartDashboard > Global Properties > Log and Alert > Alert Commands.
To change custom threshold settings:
- In the window, select .
The global threshold settings show in the same window.
- Select thresholds to enable for this gateway or cluster member, and set defining values.
SNMP Monitoring Thresholds
You can configure a variety of SNMP Thresholds that generate SNMP traps, or alerts. You can use the thresholds to monitor many system components automatically without requesting information from each object or device. The categories of thresholds that you can configure include:
- Hardware
- High Availability
- Networking
- Resources
- Log Server Connectivity
Some categories apply only to some machines or deployments.
In each category are many individual thresholds that you can set. For example, the hardware category includes alerts for the state of the RAID disk, the state of the temperature sensor, the state of the fan speed sensor, and others. For each individual threshold, you can configure:
- If it is enabled or disabled
- How frequently alerts are sent
- The severity of the alert
- The threshold point (if necessary)
- Where the alerts are sent to
You can also configure some settings globally, such as how often alerts are send and where they are sent to.
Types of Alerts
- Active alerts are sent when a threshold point is passed or the status of a monitored component is problematic.
- Clear alerts are sent when the problem is resolved and the component has returned to its normal value. Clear alerts look like active alerts but the severity is set to 0.
Configuring SNMP Monitoring
Configure the SNMP monitoring thresholds in the command line of the Security Management Server. When you install the policy on the gateways the SNMP monitoring thresholds are applied globally to all gateways.
Configuring in Multi-Domain Security Management
In a Multi-Domain Security Management environment, you can configure thresholds on the Multi-Domain Server and on each individual Domain Management Server. Thresholds that you configure on the Multi-Domain Server are for the Multi-Domain Server only. Thresholds that you configure for a Domain Management Server are for that Domain Management Server and its gateways. If a threshold applies to the Multi-Domain Server and the Domain Management Server gateways, set it on the Multi-Domain Server and Domain Management Server. However, in this situation you might only get alerts from the Multi-Domain Server if the threshold is passed.
For example, because the Multi-Domain Server and Domain Management Server are on the same machine, if the CPU threshold is passed, it applies to both of them. However, only the Multi-Domain Server generates alerts.
You can see the for each threshold with the threshold_config utility.
- If the Multi-Domain Security Management level for a threshold is , alerts are generated for the Multi-Domain Server when the threshold point is passed.
- If the Multi-Domain Security Management level for a threshold is , alerts are generated for the Multi-Domain Server and Domain Management Servers separately when the threshold point is passed.
Configuring a Local Gateway Policy
You can configure SNMP thresholds locally on a gateway with the same procedure that you do on a Security Management Server. However, each time you install a policy on the gateway, the local settings are erased and it reverts to the global SNMP threshold settings.
You can use the threshold_config utility to save the configuration file and load it again later. Or you can manually back up the configuration file so that you can copy the configuration to the gateway again after you install the policy.
On SecurePlatform and Linux, the configuration file that you can back up is: $FWDIR/conf/thresholds.conf
On Windows the configuration file that you can back up is: %FWDIR%\conf\thresholds.conf
Configuration Procedures
There is one primary command to configure the thresholds in the command line, threshold_config. You must be in expert mode to run it. After you run threshold_config, follow the on-screen instructions to make selections and configure the global settings and each threshold.
When you run threshold_config, you get these options:
- - Shows you the name configured for the threshold policy.
- - Lets you set a name for the threshold policy.
- - Lets you save the policy.
- - Lets you export the policy to a file.
- - Lets you import a threshold policy from a file.
- - Lets you configure global settings for how frequently alerts are sent and how many alerts are sent.
- - Lets you configure a location or locations where the SNMP alerts are sent.
- - Shows a list of all thresholds that you can set including: The category of the threshold, if it is active or disabled, the threshold point (if relevant), and a short description of what it monitors.
- - Open the list of threshold categories to let you select thresholds to configure.
Configure Global Alert Settings
If you select , you can configure global settings for how frequently alerts are sent and how many alerts are sent. You can also configure these settings for each threshold. If a threshold does not have its own alert settings, it uses the global settings by default.
You can configure these options:
- - How many alerts will be sent when an active alert is triggered. If you enter 0, alerts will be sent until the problem is fixed.
- - How long the system waits between sending active alerts.
- - How many clear alerts will be sent after a threshold returns to a normal value.
- - How long the system waits between sending clear alerts.
Configure Alert Destinations
If you select Configure Alert Destinations, you can add and remove destinations for where the alerts are sent. You can also see a list of the configured destinations. A destination is usually an NMS (Network Management System) or a Check Point log server.
After entering the details for a destination, the CLI asks if the destination should apply to all thresholds.
- If you enter , alerts for all thresholds are sent to that destination, unless you remove the destination from an individual threshold.
- If you enter , no alerts are sent to that destination by default. However, for each individual threshold, you can configure the destinations and you can add destinations that were not applied to all thresholds.
For each threshold, you can choose to which of the alert destinations its alerts are sent. If you do not define alert destination settings for a threshold, it sends alerts to all of the destinations that you applied to all thresholds.
For each alert destination enter:
- - An identifying name.
- - The IP address of the destination.
- - Through which port it is accessed
- - the version on SNMP that it uses
- - Some versions of SNMP require more data. Enter the data that is supplied for that SNMP version.
Configure Thresholds
If you select Configure thresholds, you see a list of the categories of thresholds, including:
- Hardware
- High Availability
- Networking
- Resources
- Log Server Connectivity
Some categories apply only to some machines or deployments. For example, Hardware applies only to Check Point appliances and High Availability applies only to clusters or high availability deployments.
Select a category to see the thresholds in it. Each threshold can have these options:
- - If the threshold is enabled, the system sends alerts when there is a problem. If it is disabled it does not generate alerts.
- - You can give each threshold a severity setting. The options are: Low, Medium, High, and Critical. The severity level shows in the alerts and in SmartView Monitor and lets you know quickly how important the alert is.
- - Set how frequently and how many alerts will be sent when the threshold is passed. If you do not configure this, it uses the global alert settings.
- - Enter the value that will cause active alerts when it is passed. Enter the number only, without a unit of measurement.
- - See all of the configured alert destinations. By default, active alerts and clear alerts are sent to the destinations. You can change this for each destination. Select the destination and you see these options:
- - If you select this, alerts for this threshold are not sent to the selected destination.
- - If you configured a destination in the global alert destinations but did not apply it to all thresholds, you can add it to the threshold.
- - If you select this, clear alerts for this threshold are not sent to the selected destination. Active alerts are sent.
Completing the Configuration
To complete threshold configuration and activate the settings:
- On the Security Management Server, install the policy on all Security Gateways.
- For a local Security Gateway threshold policy or a Multi-Domain Security Management Multi-Domain Server environment, restart the CPD process using the
cpwd_admin utility:- Run: cpwd_admin stop -name CPD -path "$CPDIR/bin/cpd_admin" -command "cpd_admin stop"
- Run: cpwd_admin start -name CPD -path "$CPDIR/bin/cpd" -command "cpd"
Monitoring SNMP Thresholds
You can see an overview of the SNMP thresholds that you configure in SmartView Monitor.
To see an overview of the SNMP thresholds:
- Open SmartView Monitor and select a Security Gateway.
- In the summary of the Security Gateway data that open in the bottom pane, click .
- In the new pane that opens, click .
- In the pane that opens, you can see these details:
- - A summary of the total SNMP Threshold policy.
- - The name that you set for the policy in the CLI.
- - If the policy is enabled or disabled.
- - How many thresholds are enabled.
- - How many thresholds are currently sending alerts.
- - How many thresholds went from not active to active since the policy was installed.
- - Details for the thresholds that are currently sending alerts.
- - The name of the alert (given in the CLI)
- - The category of the alert (given in the CLI), for example, Hardware or Resources.
- - The name of the object as recorded in the MIB file.
- - The value of the object when the threshold became active, as recorded in the MIB file.
- - The current state of the object, either active or clearing (passed the threshold but is returning to normal value.
- - The severity of that threshold, as you configured for it in the CLI.
- - When the alert was first sent.
- - A list of the destinations that alerts are sent to.
- - The name of the location.
- - The type of location, for example, a log server or NMS.
- - If logs are being sent from the gateway or Security Management Server to the destination machine.
- - How many alerts were sent to the destination from when the policy was started.
- - Shows thresholds that cannot be monitored. For example, the Security Gateway cannot monitor RAID sensors on a machine that does not have RAID sensors. Therefore it will show an error for the RAID Sensor Threshold.
- - The name of the threshold with an error.
- - A description of the error.
- - When the error first occurred.
Customizing Results
You can create Custom Views, to change the fields that show in the results.
Editing a Custom View
The changes you make to a view are not automatically be saved. To save the changes, you must Save To Tree and create a new view. You can use this procedure to save a predefined view as a new Custom view, if you want to a view that slightly different.
To save a new view with changes:
- Right-click the results of the view and select .
For some of the views, this option is or .
- Add or remove fields and other options for the view.
- Click .
For some of the views, then select the gateway.
- Click the button in the Results toolbar.
- In the window that opens, enter a name for the new view.
- Click .
Creating a Custom Gateway Status View
- In the , right-click and select .
The window opens.
- In , select the source of the data.
- In , double-click the data to add to SmartView Monitor.
- Open the tab to remove gateways from the results of this view.
- Click .
- Right-click the new view and select .
- Enter a name for the view.
Creating a Custom Traffic View
- In the , right-click and select .
The window opens.
- Select or .
- If you select , select what you want to see:
- Select the gateway.
- If you often need results for on gateway, select it in .
- If you have a small number of gateways, you can create a custom view for each one.
- Otherwise, select .
- Open the next tabs.
The tabs that show depend on the you selected.
- If you select , the next tab is , where you select the and type of report.
- If you select , the next tabs let you set services or objects to monitor, gateways or specified IP addresses to monitor, update interval, result type, and chart settings.
- Click .
- Right-click the new view and select .
- Enter a name for the view.
Creating a Custom Counters View
- In the , right-click and select .
The window opens.
- Select or .
- Select the gateway.
- If you often need results for on gateway, select it in .
- If you have a small number of gateways, you can create a custom view for each one.
- Otherwise, select .
- Open the tab.
- Select a category and then the counters to add.
You can add counters from different categories to one view.
- If the Query Type is , select the and click .
- If the Query Type is , open the tab and set the update interval and chart type.
- Click .
- Right-click the new view and select .
- Enter a name for the view.
Creating a Custom Tunnel View
- In the SmartView Monitor client, select File > New > Tunnels View.
The Query Properties window appears.
- Select Prompt on to generate a report about a specific Tunnel, Community or Gateway. Do not select Prompt on if your view is not specifically about one these three.
Prompt on signifies that you will be asked for the specific Tunnel, Community or Gateway on which to base your view, as soon as you decide to run the view.
- Select either Show one record per tunnel or Show two records per tunnel.
By selecting Show two records per tunnel a more accurate status is displayed since the report will provide the status for the tunnels in both directions.
- In the Show column, select the filter that should be associated with this view
- In the Filter column edit the selected filters by clicking the corresponding Any(*) link and selecting the relevant objects.
- Click the Advanced button and set a limit in the Records limitation window for the number of lines displayed in the report that will appear.
- Enter a record limitation and click OK.
- Click OK.
A Tunnels view appears in the Custom branch of the Tree View.
- Type the name of the new Tunnel view and press Enter.
Create a Custom Users View
- In SmartView Monitor, select File > New > Users View.
The Query Properties window appears.
- Select Prompt on to generate a Users report about a specific User or Gateway. Do not select Prompt on if your view is not specifically about one these two.
Prompt on signifies that you will be asked for the specific User DN or Gateway on which to base your view, as soon as you decide to run the view.
- In the Show column, select the filter that should be associated with this view and in the Filter column edit the selected filters by clicking the corresponding Any(*) link and selecting the relevant objects.
- Click the Advanced button to set a limit (in the Records limitation window) to the number of lines displayed in the report that will appear.
- Enter a record limitation and click OK.
- Click OK.
A Users view appears in the Custom branch of the Tree View.
- Type a name for the new Users view and press Enter.
Custom View Example
For example purposes, we will create a real-time Traffic view for Services.
- Double-click the view you would like to change and select the gateway for which you are creating the view.
- Select the View Properties button on the view toolbar. The Query Properties window appears.
- Select Real-Time.
Real-Time provides information about currently monitored traffic or system counters.
Select History for previously logged information.
- Select the topic about which you would like to create a Real-Time traffic view in the drop-down list provided. For example purposes select Services.

|
Note - The remaining tabs in the Query Properties window change according to the type of view you are creating and the selection you made in the Real-Time drop-down list.
|
- Select the Target of this Custom Traffic view.
The Target is the gateway for which you would like to monitor traffic.
- Click the Monitor by Services tab.
- Select Specific Services and the Services for which you would like to create a custom Traffic view.
- Click the Filter tab and make the relevant selections.
- Click the Settings tab and make the relevant selections.
- Click OK when you are done with your selections
The Select Gateway/Interface window appears.
- Select the gateway or interface for which you would like to create/run this new view.
- Click the Save to Tree button on the toolbar and enter a name for the new view.
- Click OK.
The new view is saved in the Custom branch.
Exporting a Custom View
You can back up a custom view before you install an upgrade. You can share a custom view with other SmartView Monitor GUI clients and other users.
To export a custom view:
- Right-click the view and select .
- In the window that opens, enter a pathname for the export file.
- Click Save.
A file with an svm_setting extension is created.
|
|
