Working with Queries
SmartEvent uses filtered event views, called queries, to identify and show relevant events. Event window information, timelines, graphs and reports are based on queries that identify potentially dangerous events and event patterns. You use this information to adjust your Security Policies and protection settings in response to detected threats.
Event Queries
SmartEvent uses filtered event views, called queries, to define the events to view. Located in the, these queries filter and organize event data for display in the Events, Charts and Maps tabs. Queries are defined by filter properties and charts properties. Filter properties allow you to define what type of events to display and how they should be organized. Charts properties allow you to define how the filtered event data should be displayed in chart form.
Predefined Queries
SmartEvent provides a thorough set of predefined queries, which are appropriate for many scenarios.
Queries are organized by combinations of event properties, for example:
Custom Queries
SmartEvent gives you the flexibility to define custom queries that show the most relevant events and trends. Once you have defined custom queries, you can organize them into folders so that they are easy to find and use.
You can use your queries to:
- Show an overview of events with specified characteristics in the tab
- Generate reports to analyze specified events and trends in the tab
- Show event counts and severity trends in the tab
- Show event data in easy to read charts in the tab
- Show events by source or destination country in the tab
Creating Custom Queries
You can create a custom query from scratch in the folder or based on an existing query.
To create a custom query based on the default query:
- In the , right-click on the folder.
- Select .
- Enter a name the custom query.
To create a custom query based on an existing query:
- Right-click an existing query and select .
- Enter a name for the new query.
You can save the query with the setting from the Events list by clicking and selecting the option.
- Click .
Customizing Query Filters
You can work with queries in the , , and windows. See the Reports section to learn about procedures for working with report queries.
To change query filter properties:
- In the tree, right-click the query.
- Select > from the options menu.
- In the window, do one or more of these tasks:
- Use the and buttons to select criteria fields to include in your query.
Selected criteria show in the list. Criteria not selected show in the list. You can enter text in the box to highlight matching text strings in criteria fields.
- Click the column to define filter criteria. Select or enter criteria values in the window that opens.
The window type and data entry procedures are different for each criterion type. The default value is .
- Optional: Clear the option to prevent a criterion column from showing in the pane.
In this case, the criterion filter applies to the query, but the column does not show. By default, the option is selected for all criteria.

|
Note - If you clear the option for a criterion that does not have a filter applied, that criterion automatically moves to the list. This action is the same as using the button.
|
- Optional: Select a field in the list and click .
This shows events with the same field value under a collapsible summary line. This option works best when you select only one criteria field.
- Use the and buttons to change the criteria column sequence in the .
- Optionally define these additional query settings:
To clear filter values from a query:
- In the tree, right-click the query.
- Select > from the options menu.
- In the list, right-click the value in the column.
- Select . This step changes the filter to the value .
Customizing Query Charts
To change the way your custom query will display as a chart:
- Right-click the new query and select > .
The window appears.
- Add fields to the column on the right side of the window to make them available in the menu on the chart. Selecting a field from the Split-By menu displays the event data divided according to the selected event characteristic.
- In , select the number of top values to show from the chosen Split-By field.
- Select to display the query by default as a or on a .
If you want to display on a using a pre-defined , choose the you want.
Organizing Queries in Folders
You can create custom folders to organize your custom queries, as well as subfolders nested within folders.
To create a custom folder:
- Right-click on (or any other custom folder you have created previously) and select .
- Name the folder.
When you create a new query, you can save it to this new folder by selecting it before selecting in the window.
Event Query Results
The tab is the heart of SmartEvent.
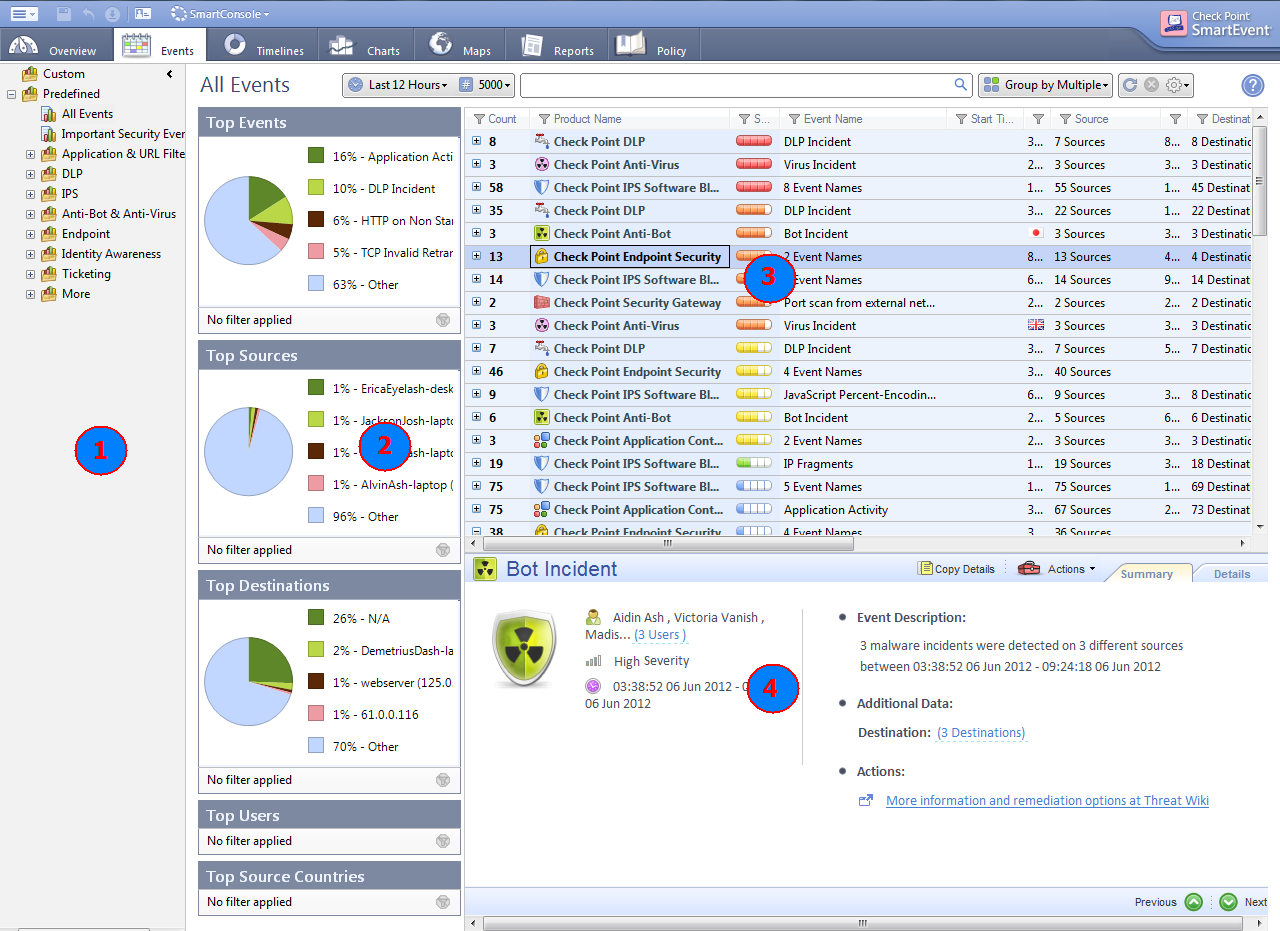
These are the components of the Events tab:
- Query Tree
- Event Statistics Pane
- Event Log
- Log entry detail pane
- Event Preview Pane
The tab is an that shows events generated by a query. In addition, the Events tab contains the , the and the .
Double-click a query in the to run that query. The results show in the . The top Events, Destinations, Sources and Users of the query results are displayed in the , either as a chart or in a tallied list. The details of the selected event are displayed in the .
Event Log
The SmartEvent can display up to 30,000 events. The events displayed are the result of a query having been run on the Event Database. To run a different query, double-click on a query in the. The will display the events that match the criteria of the query.
The is where detected events can be filtered, sorted, grouped, sent for review and exported to a file to allow you to understand your network security status. Event details, such as and , and , are displayed in a grid. In the bar at the bottom of the SmartEvent client window, displays a count of new events. retrieves the data from the database according the active query filter.
The details of an event provide important specifics about the event, including type of event, origin, service, and number of connections. You can access event details by double-clicking the event or by displaying the .
Queries are built with certain default settings that can be changed directly in the Events tab to provide more specific or more comprehensive results.

- The time frame selection lets you choose the period of time for which events should be displayed.
- The Event number selection sets the number of events that should be displayed from the query (default is 5,000 events). Up to 30,000 events can be displayed and managed at one time.
- The selection is particularly useful here to quickly divide the data by specific criteria and immediately show the number of events per grouping.
Filtering Events
After running a query, you can further filter the event data by right-clicking any column and defining the filter parameters. This will temporarily include the filter in the active query and run the query again against the database to return the matching values.
A green filter icon at the top of a column indicates that a filter is applied to that field. You can then choose to save the new set of filters as a custom query by selecting from the menu. Running the query again will discard the filters that have not been saved.
To use filters with query results:
- To change the filter criteria, right-click on a column header and select Edit Filter.
- To remove events that have any specific field value, right-click on the value and select .
- To include only events that have a specific field value, right-click on the value and select .
- To remove the extra conditions you have applied, right-click the filter and select Clear Filter.
Sorting and Searching Events
Running a query could return thousands of matching events. To help you organize the events that have already been returned by the query, you can sort them by clicking on any of the column headers.
You can also look for events which have specific values by entering values in the field. Searching for multiple values, using commas to separate the values, will return the events that contain all of the search values, although the values can be in any of the event fields. The search can be made case-sensitive or can look for data that is not displayed in columns.
Grouping Events
One of the most powerful ways to analyze event data is by grouping the data based on the specific columns using the button on the toolbar. Here you can group the events by one or more columns and the shows the number of matching events in those groups, presented in descending order.
You can also specify the default grouping that a query should use by marking fields as in the window.
The top line of each group in the Event Log shows a summary of the events that it contains. If you hover over a field in the top line, you can see details of what data that field contains in all of the events in the group.
To group events by one or more fields, perform one of the following:
- Click on in the toolbar and select the field to use for grouping events.
- Click on in the toolbar and select . Then in the window select one or more field to use for grouping events.
- Right-click on the column in the you want to use for grouping events and select .
Once you have already grouped by a column, you can add another column to use for grouping by right-clicking on the column in the you want to use for grouping events and select .
To remove fields from the grouping, perform one of the following:
- Click on in the toolbar to remove all grouping.
- Click on in the toolbar and select . Then in the window remove one or more field from grouping.
- Right-click on the column in the you want to remove from the grouping and select .
Sending an Event
In some circumstances, event information can be used to show evidence of a security attack or vulnerability that needs to be resolved. For example, you may decide that another member of your security team should review an event as evidence of an attack. Also, reporting events to Check Point can help Check Point improve the IPS technology to detect new threats in an ever-changing security environment. From the , you can choose to send event details as an email using your default email client, or you can choose to send the event details to Check Point over a secure SSL connection.
To send an event using email:
- Select the event in the .
- Right-click on the event and select .
A new email opens using your default email client and the event information is included in the body of the email.
To report an event to Check Point:
- Select the event in the .
- Right-click on the event, select and choose whether you want to include just the Event Details or to also include the Packet Capture associated with the event.
Only the event information will be sent to Check Point over a secure SSL connection. The data is kept confidential and Check Point only uses the information to improve IPS.
Exporting Events to a File
The can contain thousands of events. You can export the events from the SmartEvent client into a text file to allow you to review or manipulate the data using external applications, such as a spreadsheet or text editor.
You can export events from the tab, tab or . When exported, the list of events will be saved exactly as it appears in the , including the visible columns and any sorting, filtering or grouping that is applied to the events.
To export events to a comma-delimited (csv) file:
- In the tab, tab or window, organize the events as you would like them to be saved.
- Hide/show columns to display the information you want to save.
- Apply sorting, filtering and grouping to produce a list of events in the format you want.
- From the File menu, select .
- Name the file, navigate to the location where you want the file saved and click .
Examining Client Vulnerability
To maintain a high level of security, organizations must install the latest security patches on network computers. Many of the security patches are designed to prevent threats from exploiting known vulnerabilities. If you are consistent with implementing software patches, your network computers will not be vulnerable to some of the attacks that are identified by SmartEvent. SmartEvent ClientInfo helps you determine whether an attack related to Microsoft software is likely to affect the target machine. If the target machine is patched, you can stop the events from being generated by choosing to exclude the target machine from the event definition or from the specific IPS protection.
SmartEvent ClientInfo connects to the computer whose IP address is listed in the event. After you enter credentials with administrator privileges on the target computer, SmartEvent ClientInfo reads the list of Microsoft patches installed on the computer as well as other information about the installed hardware and software. SmartEvent ClientInfo also retrieves the Microsoft Knowledge Base article related to the vulnerability reported in the event and checks to see if the patches listed in the article are installed on the target computer. If SmartEvent ClientInfo finds that the matching patch is installed, it is likely that the attack will have no effect on the target computer and you can choose to create an exception so that IPS or SmartEvent stops recognizing the attack as a threat.
Once the computer information is loaded in SmartEvent ClientInfo, you can perform the following functions:
Icon
|
Action
|

|
Save the information in the active tab to a .csv file
|

|
Enter new credentials for accessing the computer information
|

|
Copy the contents of the selected cell
|

|
Run Google.com search using the contents of the selected cell
|
Search field
|
Filter the contents of the active tab for rows containing the search text
|

|
Filter the contents of the active tab for rows containing the KB number
|

|
Connect to the specified IP address to gather the computer information
|
To make sure that a computer is not vulnerable to an attack:
- In the tab, right-click on the event you want to investigate and select .
- Enter user credentials that allow administrator privileges on the target computer or select to login with your current credentials. You can also save your credentials to avoid having to enter them again.
SmartEvent ClientInfo retrieves the software and hardware information from the target computer, as well as the details of the Knowledge Base article associated with the vulnerability identified in the event.
- Check the result. SmartEvent ClientInfo returns one of the following results:
- - In this instance, SmartEvent ClientInfo found that the patch recommended by Microsoft for protecting against the vulnerability is installed on the target computer.
Based on this, you can decide to modify the associated IPS protection or event definitions to prevent these events from displaying in the future.
- -In this instance, SmartEvent ClientInfo found that a patch is installed that is related to the Security Bulletin, but found that the main patch that is recommended by Microsoft for protecting against the vulnerability is not installed on the target computer. The installed fix may not cover all of the affected software.
Click on the KB numbers specified to open the associated Knowledge Base articles. Review the recommended remediation steps, which may include installing a patch on the target computer.
- - In this instance, SmartEvent ClientInfo found that the patch recommended by Microsoft for protecting against the vulnerability is not installed on the target computer.
Click on the KB number specified to open the associated Knowledge Base article. Review the recommended remediation steps, which may include installing a patch on the target computer.
|
Note - If SmartEvent ClientInfo finds that the patch in the KB article is not installed on the remote computer, it may indicate one of the following:
- The vulnerability does not affect or is not relevant to the target computer’s Operating System OR Service Pack version. If so, the computer is not vulnerable.
- The article is relatively old and you may have installed Service Pack that includes the patch for the vulnerability. If so, you should check the installed Service Pack to see if it was released after KB article and may include the associated patch.
|
Event Statistics Pane
The is accompanied by charts displaying the Top Events, Top Sources, Top Destinations and Top Users for the active query. These statistics are automatically updated as filters are applied to the .
You can toggle between viewing the statistics as a chart or a list by clicking on the arrow in the top-right corner of each of the boxes and selecting
You can filter in or out any value in the to focus the query results on the data that is most important to you. Filtering in the is also reflected in the , and clearing filters from the clears all filters that have been applied to the query.
- To remove events that have any specific field value, right-click on the value and select .
- To include only events that have a specific field value, right-click on the value and select .
- To remove the extra conditions you have applied, click on the icon.
Event Details
See the details of an event from the in the tab or by double-clicking on the event in the . The window has two tabs with different data:
- - Shows a brief summary of the event in a user-friendly format.
- - Shows the full, technical details of the event.
These options are available from the Event Details window:
- Copy - Copies the event details to the Windows Clipboard.
- Actions - Actions that you can do that are related to this log. They include:
- Event Raw Logs - Launches SmartView Tracker and displays the log entries upon which the event is based.
- Edit Ticket - Lets you set the state of the event, assign an owner, and add a comment.
- Add Comment - Lets you add a quick comment about the event without changing the state or owner.
- View History - Lets you view the ticket activity on the event, including changes to the state, owner, or comments.
- Blade Specific Menu - For example, IPS or Application Control. This menu has different options depending on the Software Blade that is related to the event.
- Previous displays the event that appears before the current event in the Event Log.
- Next displays the event that appears after the current event in the Event Log.
Summary Tab
The tab includes:
- The source of the activity. If Identity Awareness is enabled, this can be the user name.
- A brief description of the event.
- The action taken on the event.
- The time of the event.
- Other important data related to the event.
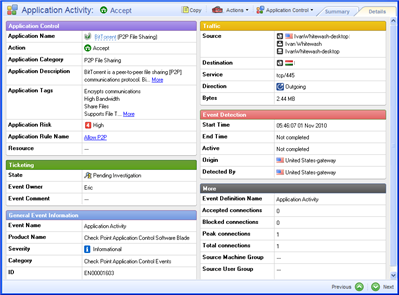
Details Tab
The tab includes:
- Details about the Software Blade and rule that caused the event.
- Ticketing information for the event - Use this to track activity related to the event.
- General Event Information - Includes the severity for the event and a unique ID.
- Traffic Information - Where the event originated, its destination, and the size of the data in bytes.
- Event Detection - How and when the event was detected and by which Security Gateway.
- More - Additional information related to the connections involved in the event and the source.
Browse Time
The feature keeps track of the total time that users are connected to different sites and applications. R76 and later Security Gateways calculate the cumulative connection time for each session and periodically updates this value until the session is closed.
Browse time is calculated as follows:
- Total browse time is calculated for each site from the first HTTP request to the last HTTP response. Idle time of more than two minutes is not included in the browse time.
- The minimum calculated time is two minutes. Any connection of less than two minutes is rounded up to two minutes. However, browse time for each user does not include time spent at more than one site simultaneously. For example, if a user connects to google.com and facebook.com at the same time, only one site is included in the browse time calculation.
Event Data Analysis
SmartEvent includes a many different tools to let you analyze events that occur in your environment. You can get access to these tools using one of the tabs in the SmartEvent GUI.
Overview Tab
The SmartEvent tab shows critical security status information for your environment. Its main focus is presenting a quick view of the recent events data using the Timeline View, Recent Critical Events, and Top tables and chart. These interactive sections report on the events based on the Time Frame setting to allow you to display event data from a specific latest period of time.
Double-click on data in any of the sections in the Overview tab to open the associated list of events so that you can continue investigating issues all the way down to the individual event level.
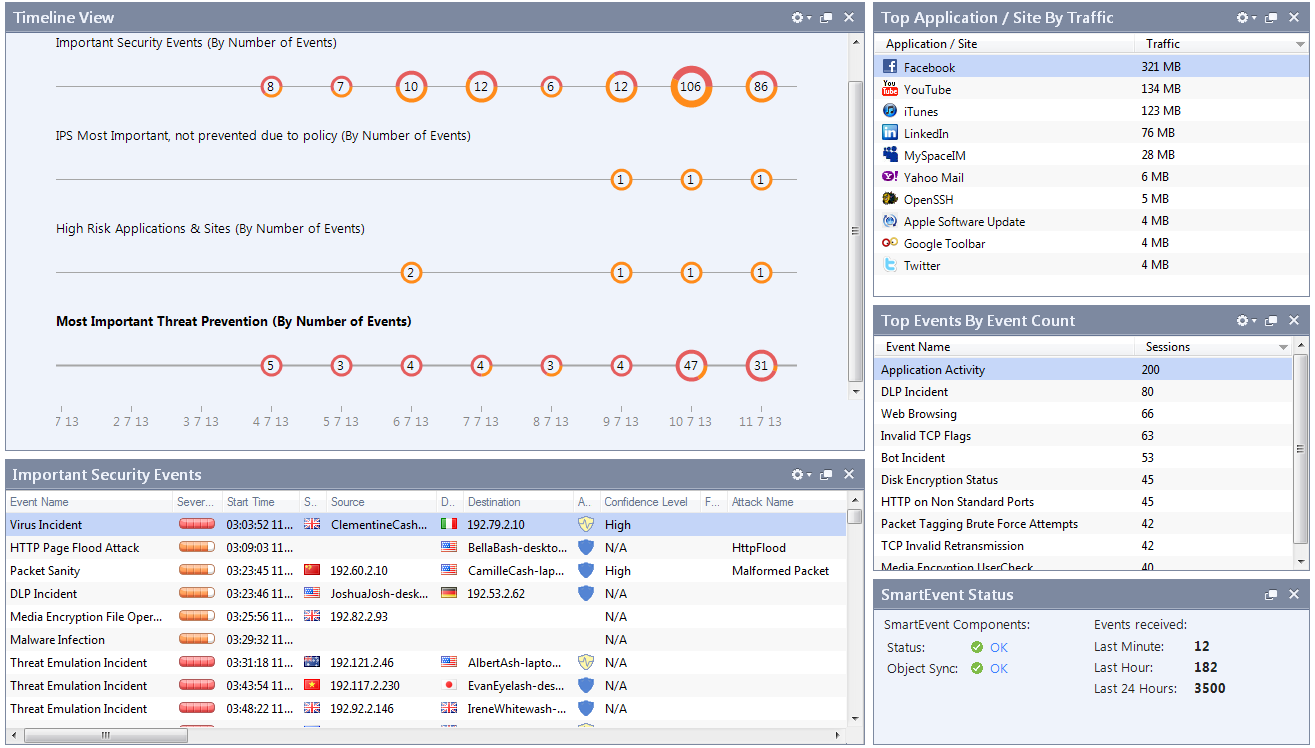
By default, the tab includes these sections:
- Timeline View - Timelines let you see specified recent events in a linear format. The number of events is shown inside a circle at each defined time interval. The circle itself is color coded to show the severity of the different events. You can add, modify or remove timelines from this view just as you would in the Timeline Tab.
- Events Query - This section shows events from a user-selected query. This is useful for examining important events that occurred during the specified Time Frame. To select a query to show in this pane:
- Click the cogwheel button in the pane.
- Select one of these options from the menu:
- Set Query - Select a predefined query from Set Query window.
- Show Newly Detected Applications table - Show applications seen for the first time during the specified Time Frame.
You can search, sort, filter and group events using the same methods as in the Events tab. Click the arrow to select a different query to show here.
 How do I view the details of an event? How do I view the details of an event?
See the details of an event from the in the tab or by double-clicking on the event in the . The window has two tabs with different data:
- - Shows a brief summary of the event in a user-friendly format.
- - Shows the full, technical details of the event.
These options are available from the Event Details window:
- Copy - Copies the event details to the Windows Clipboard.
- Actions - Actions that you can do that are related to this log. They include:
- Event Raw Logs - Launches SmartView Tracker and displays the log entries upon which the event is based.
- Edit Ticket - Lets you set the state of the event, assign an owner, and add a comment.
- Add Comment - Lets you add a quick comment about the event without changing the state or owner.
- View History - Lets you view the ticket activity on the event, including changes to the state, owner, or comments.
- Blade Specific Menu - For example, IPS or Application Control. This menu has different options depending on the Software Blade that is related to the event.
- Previous displays the event that appears before the current event in the Event Log.
- Next displays the event that appears after the current event in the Event Log.
How do I search in the query results?
The field at the top of the allows you to filter the query results based on criteria that you choose. The search function returns all events that contain the search term in any of the event fields. You can choose to treat the search term as case-sensitive or choose to only search in the visible columns by selecting those options in the menu.
To search for values in the events, enter your search terms in the field and press Enter or click . Multiple search terms can be entered by separating them by a comma (,), and partial terms can be found by entering the partial term following by an asterisk (*).
How do I filter the query results?
- To change the filter criteria, right-click on a column header and select Edit Filter.
- To remove events that have any specific field value, right-click on the value and select .
- To include only events that have a specific field value, right-click on the value and select .
- To remove the extra conditions you have applied, right-click the filter and select Clear Filter.
How do I sort the query results?
The allows you to change the order in which events are displayed. By clicking on a column header, you can sort the events according to that column criteria. If you click on the same column header again, you reverse the order by which the events are listed (earliest/latest, or A-Z/Z-A).
How do I group events?
You can choose to group events together based on a particular field and display group together events that share certain specific values. Grouping also provides a quick method of counting the number of events with specific values. For example, grouping events by Event Name will display the events by name and the number of events that match each event name.
You can also group events by multiple fields. For example, grouping events by Event Name and Source Country will display the events that have matching Event Names and Source Country as well as a count of how many events are in each group. From this information you can quickly determine which country is the most common source of a particular event name.
To group events by one or more fields, perform one of the following:
- Click on in the toolbar and select the field to use for grouping events.
- Click on in the toolbar and select . Then in the window select one or more field to use for grouping events.
- Right-click on the column in the you want to use for grouping events and select .
Once you have already grouped by a column, you can add another column to use for grouping by right-clicking on the column in the you want to use for grouping events and select .
To remove fields from the grouping, perform one of the following:
- Click on in the toolbar to remove all grouping.
- Click on in the toolbar and select . Then in the window remove one or more field from grouping.
- Right-click on the column in the you want to remove from the grouping and select .
How do I send an event to Check Point or to an email recipient?
In some circumstances, event information can be used to show evidence of a security attack or vulnerability that needs to be resolved. For example, you may decide that another member of your security team should review an event as evidence of an attack. Also, reporting events to Check Point can help Check Point improve the IPS technology to detect new threats in an ever-changing security environment. From the , you can choose to send event details as an email using your default email client, or you can choose to send the event details to Check Point over a secure SSL connection.
To send an event using email:
- Select the event in the .
- Right-click on the event and select .
A new email opens using your default email client and the event information is included in the body of the email.
To report an event to Check Point:
- Select the event in the .
- Right-click on the event, select and choose whether you want to include just the Event Details or to also include the Packet Capture associated with the event.
Only the event information will be sent to Check Point over a secure SSL connection. The data is kept confidential and Check Point only uses the information to improve IPS.
How do I export a list of events to a tab-delimited (csv) file?
The can contain thousands of events. You can export the events from the SmartEvent client into a text file to allow you to review or manipulate the data using external applications, such as a spreadsheet or text editor.
You can export events from the tab, tab or . When exported, the list of events will be saved exactly as it appears in the , including the visible columns and any sorting, filtering or grouping that is applied to the events.
To export events to a comma-delimited (csv) file:
- In the tab, tab or window, organize the events as you would like them to be saved.
- Hide/show columns to display the information you want to save.
- Apply sorting, filtering and grouping to produce a list of events in the format you want.
- From the File menu, select .
- Name the file, navigate to the location where you want the file saved and click .
- 'Top' Panes - The and panes show the most frequent occurrences during the specified Time Frame according to user-selected categories. You can show events according to traffic volume or the quantity of events. To show the top events:
- Click the cogwheel button in the pane.
- Select one of these criteria:
- Sources
- Users
- Destinations
- Malwares
- Malware involved hosts
- Malicious activities
- Application / Site
- Application Categories
- Select a metric:
- Show Data by Event Count - Quantity of events during the specified Time Frame
- Show Data by Traffic - Traffic volume in MBs
- SmartEvent Status - The Status section contains system information including:
- Status - This indicator reports the current status of the Event Analysis system, including problems connectivity to Correlation Units and Log servers and when the allocated disk space is full. Click on the link for more information.
- Object Sync - This indicator reports on the synchronization of objects between the management servers (either Security Management or Domain Management Server) and the SmartEvent server. Click on the link for more information.
- Config - This indicator will appear if components are not configured, including Internal Network settings and Correlation Units. Click on the link for more information.
- Events received in the - These statistics show the number of events received by the SmartEvent server in the last minute, hour and 24-hour period. This information gives a quick glance at the traffic load on the SmartEvent server. Unusual data in these fields may indicate connectivity problems between the components of the Event Analysis system.
Timeline Tab
Timelines let you see specified recent events in a linear format. The number of events is shown inside a circle at each defined time interval. The circle itself is color coded to show the severity of the different events.
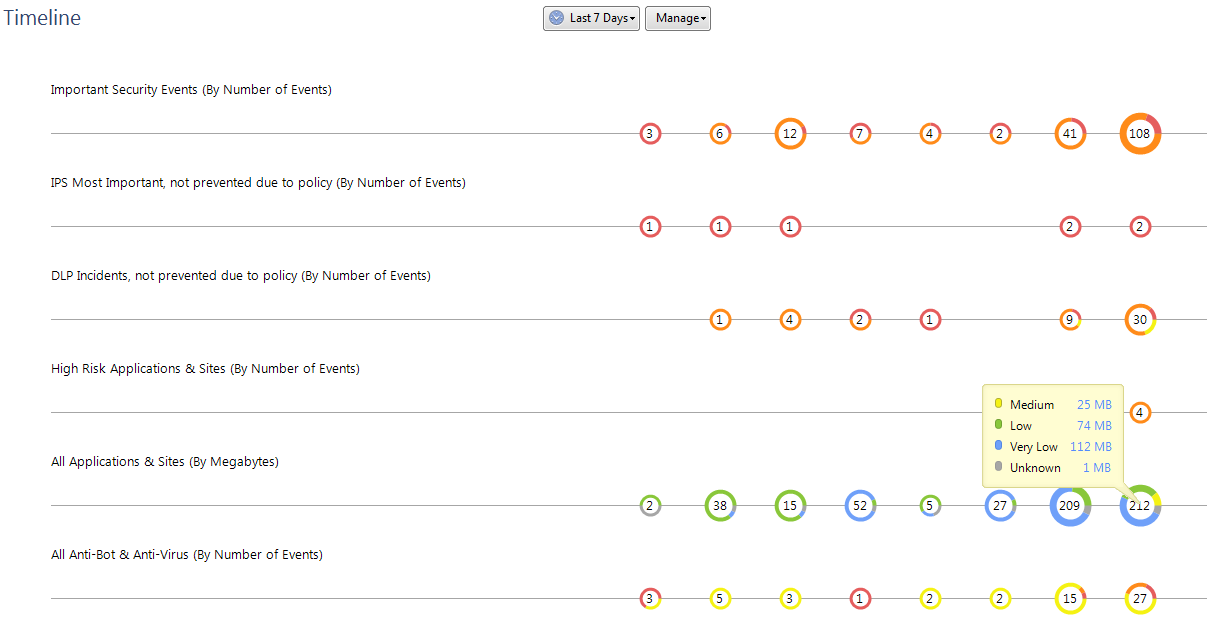
|
Note - Because timeline circles use colors to show event severity, timelines for queries without filters (such as a query by source IP address) are identical to those of the query.
|
You can modify these timelines or add new timelines for predefined and custom queries. You can also rename timelines and move them up or down the in the window.
To add a new timeline:
- Select > .
- In the window, do one of the following:
- : Select an existing query and click .
- :
- Select an existing query and click .
- In the Events Query properties window, configure the query to filter for the events that you want to track and click .
- Enter a name for the new custom query. You can choose to save the time frame for the query.
- Click .
- C:
- Click to create a custom query which you can use for the new timeline.
- In the Events Query properties window, configure the query to filter for the events that you want to track and click .
- In the window, enter a name for the custom query.
- In the window, click .
You can now see the configured timelines and you can modify the and to help you analyze the event data.
To modify an existing timeline:
- Select a timeline and select > .
- In the Events Query properties window, configure the query to filter for the events that you want to track.
- Click .
The selected timeline now displays the event data based on the modified query.
Charts Tab
Charts display query results in a graphical format which you can configure to divide the events data based in any event characteristic. You can then drill down into any segment of the chart to display a list of those events in a new Events window.
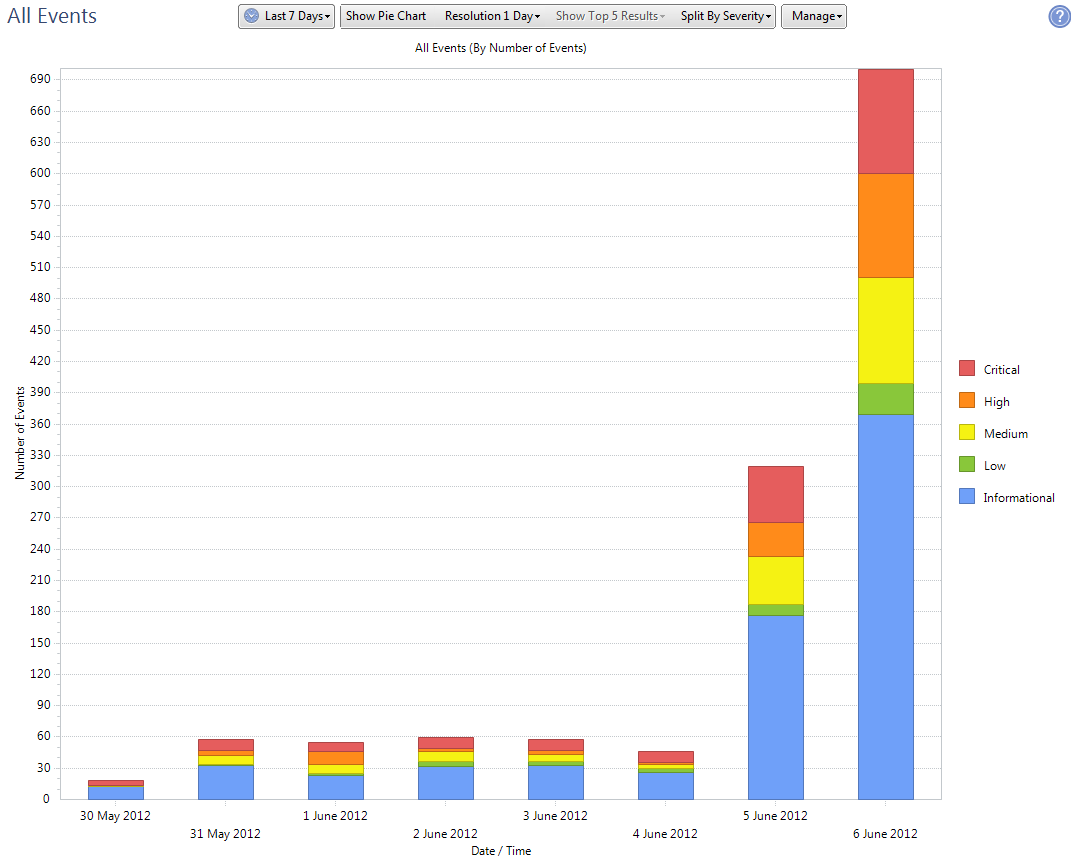
Event queries can be shown with a Time Axis or as a Pie Chart. The query’s chart properties define which type of chart will be shown by default but you can change the chart type to display at any time by selecting from the options in the upper-left corner.
- The Time Axis display shows the query results over time based on a configured Time Resolution. This method focuses attention on how the event data differs over time.
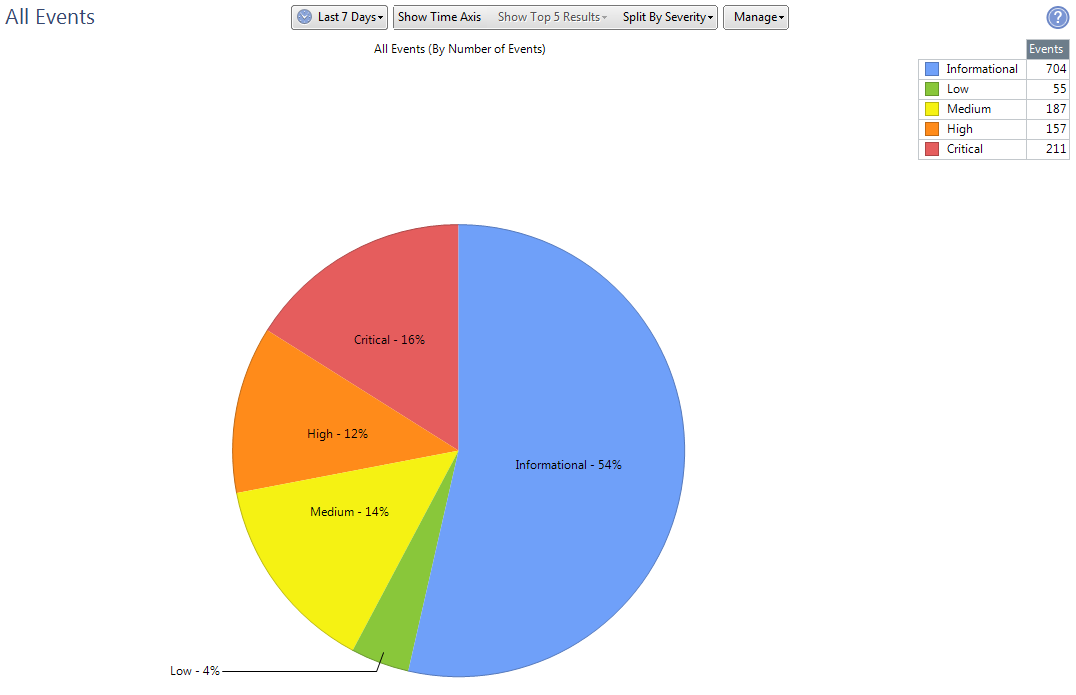
- The Pie Chart is the best way to show Top N data such as By Source (top sources), By Destination (top destinations), and By Service (top services). This method focuses attention on the number of events with specific properties.
Event Data Options
The following are settings that can be set from the Toolbar to change the event data that is displayed in the chart:
- - Select a specific time frame for which events are displayed. For example, you can choose to show only events during the last 24 hours, the last 30 days, or a custom time frame.
- - This field determines how events are grouped in charts and timelines. For example, when the time frame is set to one hour, all events that match the query filter properties and occurred within the period of one hour will be displayed together. The colors of the time wheel indicate the breakdown of events by category within the selected period of time.
- - This field determines which dimension will be used to analyze the events. In the query Chart Properties, you can choose which dimensions to make available for displaying in the charts.
- - This field determines how many of dimensions results will be displayed in the chart. In the query Chart Properties, you can set the default number.
You can also set a particular chart to be displayed by default in the Charts tab by right-clicking on the query and selecting Run on Start.
Manage Options
The following are options that can be changed from the Toolbar to present the chart data in a more informative and appealing manner:
- - By default, the scale of the number of events will change based on the results displayed in the chart. By selecting , you can choose for the scale of the number of events to remain constant as you scroll through the chart.
- - You can choose to show a data grid next to the chart. The data grid provides a table which shows a summary of all of the data points in the query. When you move the cursor over any part of the chart or grid, the associated data will be highlighted in the other area.
- Copy to Clipboard - Select the option to access the options for copying the event statistics to your computer Clipboard for external use. You can copy the image itself, or you can the copy raw event counts represented by the image that is currently displayed and then paste that data into another application.
- - To copy the image that is currently displayed.
- - To copy the raw event counts represented by the image that is currently displayed.
- Print - Select to print the image that is currently displayed.
- - Select to choose if to display the chart as flat (2D) or with depth (3D).
- - Select to show the pie chart as a bar, doughnut, or pie chart.
The following are elements of the chart display that can be changed by right-clicking on the chart to customize the presentation of the chart:
- - You can choose to show a data grid next to the chart. The data grid provides a table which shows a summary of all of the data points in the query. When you move the cursor over any part of the chart or grid, the associated data will be highlighted in the other area.
- - You can choose to show or hide the Legend Box. The Legend Box is a key which indicates what the colors of the chart represent. Change the location and font of the Legend Box by right-clicking on it.
- - You can select a background color for the chart.
You can modify the display options for the data grid, legend box, axis labels or axis scales. Right-clicking any of the elements allows you to change the font, text color, display location and other graphical options.
To view a chart:
- Run a query by double-clicking the query in the Query Tree.
You can also open your chart in a new window by right-clicking the query and selecting Run in New Window. This allows you to keep multiple charts open at the same time.
- Decide whether you want the chart to be based on time (Time Axis) or based on other event properties (Pie Chart).
- When using Time Axis, choose a Chart Time Resolution to group the events by a specific time range.
- The chart will display all events. You can choose to show only a number of the top query results by selecting a number from the Show Top menu.
Maps Tab
Source and Destination information are frequently critical when determining the potential threat of traffic. Some companies need to block traffic from certain countries based on security, political, or legal reasons whereas other companies may see identifying traffic by country of origin or destination simply as a way to limit the traffic passing through the network.
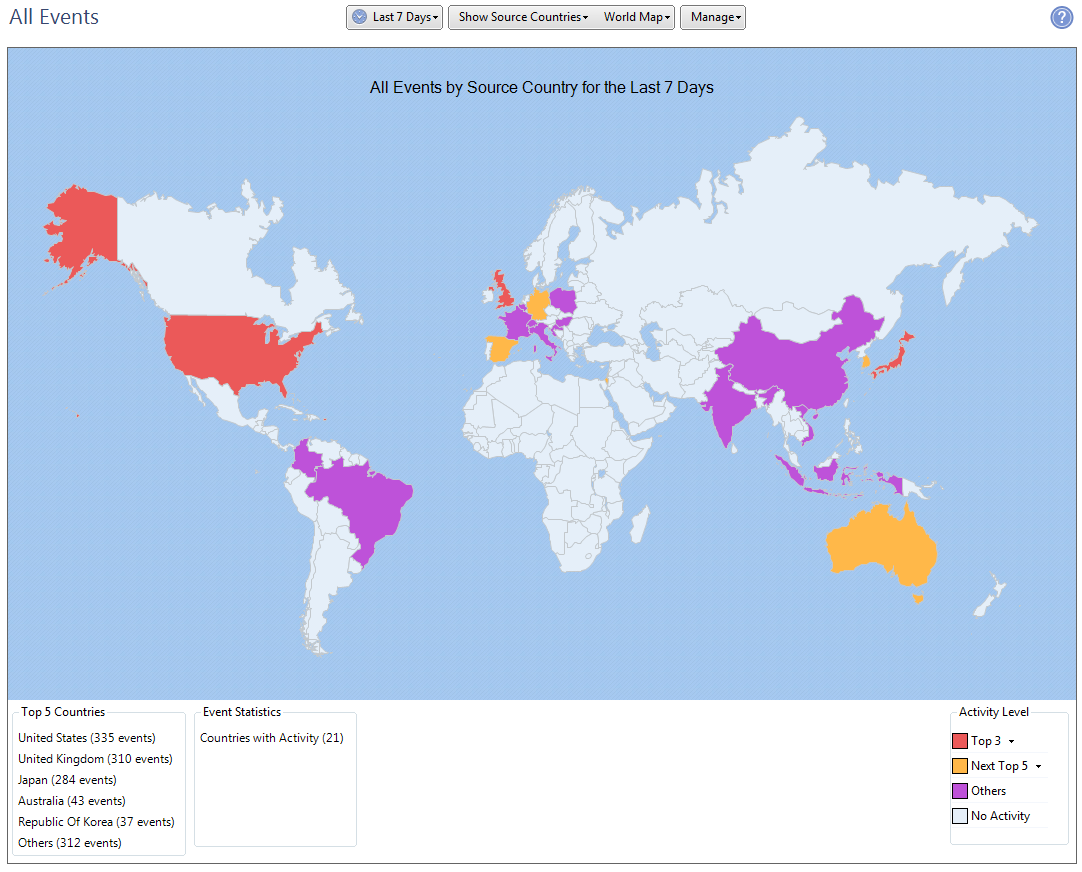
In the tab, SmartEvent presents source and destination countries for the active query on an interactive world map. Countries are color-coded to indicate levels of event activity. You can define the number of countries to include in the top tier of countries () and in the second tier of countries () to change how countries are grouped in the map.
By double-clicking on a country, you can drill-down to see a detailed list of events for that country. By default the map shows the results of the query; however, you can populate the map with information from any of the available queries by double-clicking on a query in the Query Tree. You can also choose to view continents individually in order to see countries more clearly.
Statistics information about the active query is displayed below the interactive map. The five countries with the highest number of events matching the query filter are shown with the number of events for each, as well as the total number of countries matching the query.
Interact with the map using the following actions:
- To see the number of events that correspond to a country, move the mouse over that country.
- To view query results for a country in an Events window, double-click on the country.
- To change between viewing the entire world map and viewing maps for individual continents, choose from the menu.
- Activity Level - In the bottom right corner of the map is the Activity Level key. Countries are colored according to four tiers:
- Top - By default, the Top 3 countries are colored Red. Choose the number of countries to include in the top tier by changing this setting.
- Next Top - By default, the Next Top 5 countries are colored Yellow. Choose the number of countries to include in the second tier by changing this setting.
- Others - All countries with events, but are not included in the Top or Next Top tiers, are colored Blue.
- No Activity - All countries without events are colored White.
Moving the mouse over a tier in the Activity Level key will highlight the Countries in that tier.
In addition, in the bottom left corner of the map is a summary of event statistics which includes the number of events for the top 5 countries and the total number of countries with events.
Reports Tab
Use the tab to see, manage and generate reports that show a summary of events identified by SmartEvent. You can generate report for these supported blades:
- Application and URL Filtering events
- Data Loss Prevention events
- IPS events
- Anti-Bot and Anti-Virus events
- - Tabular list of all events, including events not related to these supported blades
- Each supported blade has its own filter criteria and format that for presenting the information.
Administrator Permission Profiles - Events and Reports
SmartEvent enables you to provide an administrator with a Permission Profile for the SmartEvent database. A Permission Profile is a permission ID card that is assigned to administrators or administrator groups.
The administrator and his Permission Profile are verified during login. When an administrator logs into SmartEvent his user name and password are verified by the SmartEvent server. If the administrator is not defined on the SmartEvent server, the server will attempt the login process with the credentials that are defined on the Security Management Server or Multi-Domain Server connected with SIC to the SmartEvent server.
|
Note - If you do not want to centrally manage administrators, and you only use the local administrator defined for the SmartEvent server:
From the SmartEvent server command line, invoke:
cpprod_util CPPROD_SetValue FW1 REMOTE_LOGIN 4 1 1
|
The Permission Profile types for the SmartEvent Events tab are set in the SmartDashboard or SmartDomain Manager (SmartDashboard > Manage > Permissions Profiles > New / Edit).
The following are the three types of Permission Profiles:
- No Access indicates that the administrator cannot view the SmartEvent Events and Reports tabs.
- Read Only enables the administrator to view SmartEvent Events and Reports tabs.
- Read/Write enables the administrator to modify the SmartEvent Events and Reports tabs using the Change State option.
These permissions are available for Events and Reports:
- SmartReporter Policy - Configure Global Properties for SmartReporter.
- SmartReporter - Configure SmartReporter.
- SmartEvent Events Database - View and manage the Events tab of SmartEvent.
- SmartEvent Policy - View and manage the events correlation on the Policy tab of SmartEvent.
- SmartEvent Reports - Users only see the tab.
- All Blades - This setting applies to all blades.
- Application and URL Filtering Blades - Applies only to the Application Control and URL Filtering blades.
Multi-Domain Security Management
When working with Multi-Domain Security Management, SmartEvent is Domain oriented. That is, each Event and Report is associated with a Domain.
The administrator can view Events and Reports about Domains to which he has permissions. Only locally defined administrators on the SmartEvent server or the Multi-Domain Server Super User can view all events including cross-Domain events.
|
|
