Customizing a Report
Workflow for Customizing a Report
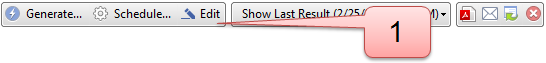
- Select a report and click .
If it is a predefined report, confirm to save it as a new customized report. Predefined reports cannot be changed.
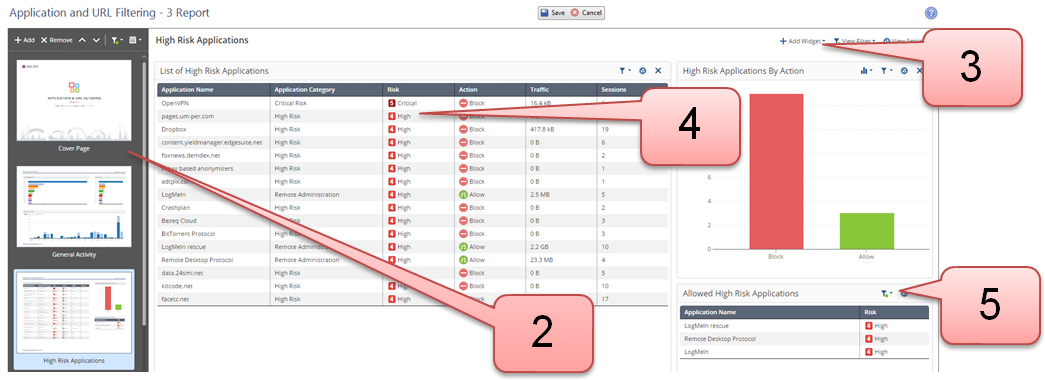
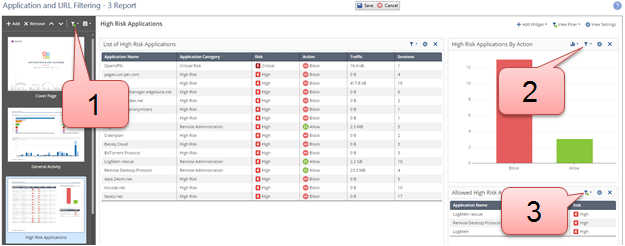
- Select the page to edit.
- Add a widget.
- Arrange widgets in the view: Drag & Drop or expand
- Customize the widgets.
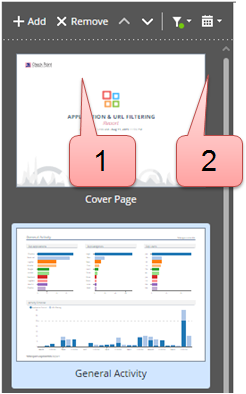
Pages and Timeframes
- Add, remove, or change the order of pages.
- Select the Timeframe of events to see during the report customization.
The timeframe is not saved in the report definition. In this window, use the timeframe to see what the report will look like.
To generate a report for a timeframe, select the timeframe when you generate the report.
|
|
Filters
There are different layers of report filters:
- Filters to apply to the full report
- Filters to apply to a view and all widgets that it includes
- Filters to apply to the selected widget
Note: To set filters for a one-time report (for example, to generate the User Activity report filtered for a specific User), see the run-time filters in Generate Report on Demand.
Click the Filter button for the full report (see Filters, number 1).
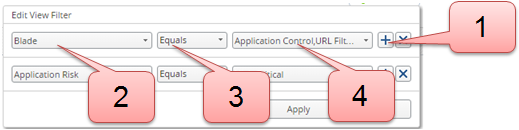
- Click the (plus) button to add a filter.
To delete a filter, click the X button. - Select a field.
To enable free text search, select Custom Filter. - Select a comparison method.
- Select or enter the value.
You can define multiple values, separated by a comma.
View Settings
Click the Filter button for the View (see Filters, number 2).
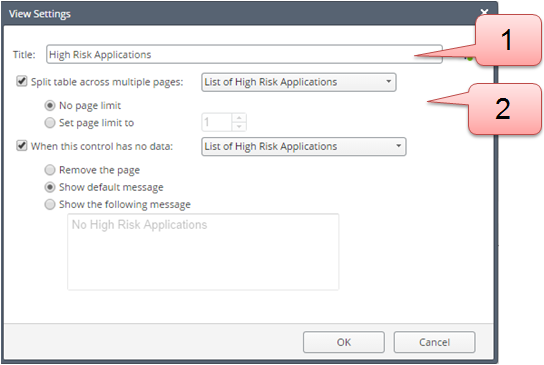
- Enter a title.
- Optional: Select a table and set to . The table will use several pages, to show more results.
Widgets
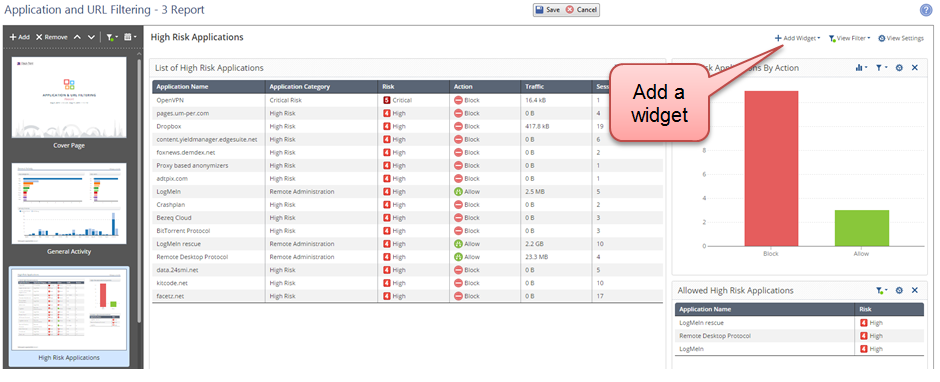
To add a Widget:
- Add a widget
- Select a widget type:
- Chart
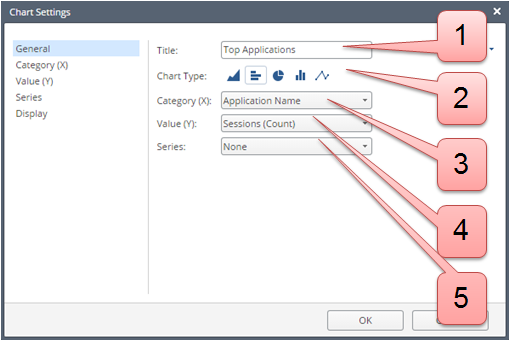
- Enter a title.
- Select a chart type: area, horizontal bar, pie, vertical bar, line
- Select a data category for the X axis.
- Define how the Top Values are calculated (such as number of sessions or traffic).
- Advanced option: Split the results into colored groups, with different values for the Series field.
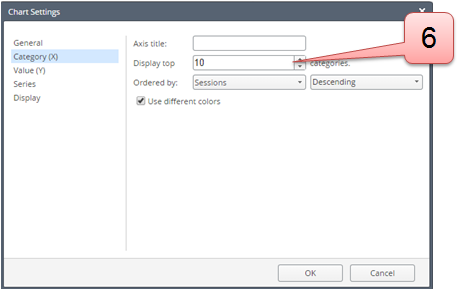
- Click Category (X). Enter the number of Top Values to show.
- Timeline
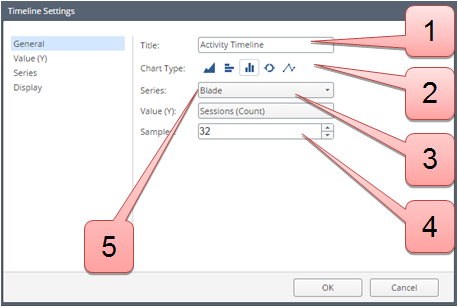
- Enter a title.
- Select a timeline graphical presentation: area, horizontal bar, vertical bar, doughnut, line
- Select the data to count.
- Define the time granularity. Enter the number of bars or doughnuts to show.
- Advanced option: Split the results into colored groups, with different values for the field.
- Table
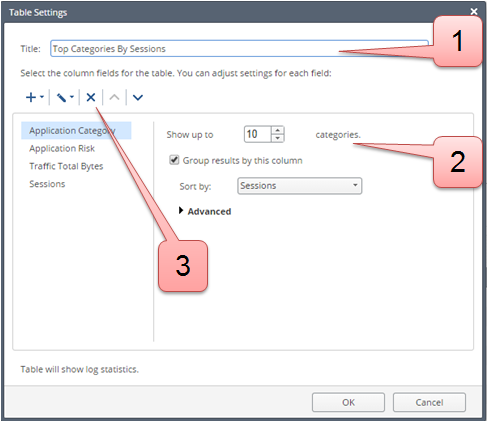
- Enter a title.
- Select a column on the left and define its settings:
- Manage columns: add, remove, and change the order.
- Map
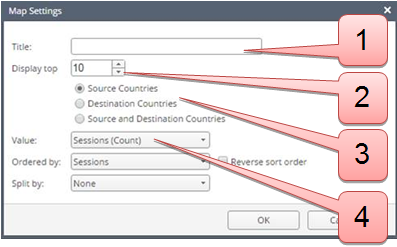
- Enter a title.
- Enter the number of Top Countries to show.
- Select to show Source Countries, Destination Countries, or both.
- Define how to find the Top Countries (for example, by number of sessions or by traffic).
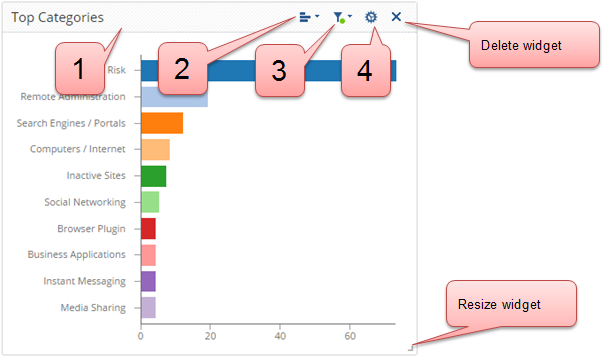
To customize a widget:
- Drag and drop the widget to the view.
- Select the graphic presentation that best fits the information you want to see.
- Select filters for the widget.
- Select settings for the widget.