Chart
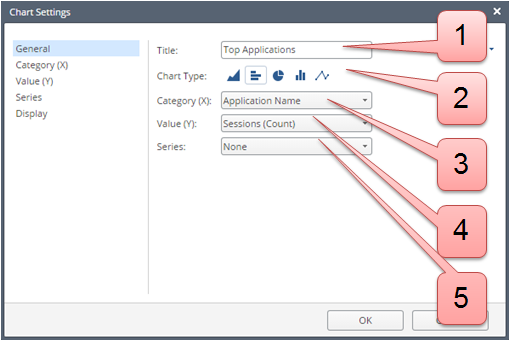
- Enter a title.
- Select a chart type: area, horizontal bar, pie, vertical bar, line
- Select a data category for the X axis.
- Define how the Top Values are calculated (such as number of sessions or traffic).
- Advanced option: Split the results into colored groups, with different values for the Series field.
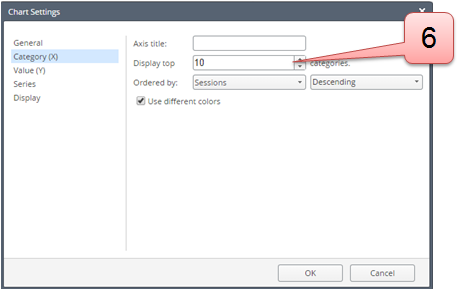
- Click Category (X). Enter the number of Top Values to show.