Alerts
Infinity XDR![]() Extended Detection & Response/XPR
Extended Detection & Response/XPR![]() Extended Prevention & Response processes and triage all received alerts, and those that match one of the detection rules are considered as Alerts. The Alerts page provides you a summary of all alerts across the system. Extensive filtering capabilities on this page allows you to narrow the search within the Alerts table contents. You can also view additional details for an alert by selecting a record in the Alerts table.
Extended Prevention & Response processes and triage all received alerts, and those that match one of the detection rules are considered as Alerts. The Alerts page provides you a summary of all alerts across the system. Extensive filtering capabilities on this page allows you to narrow the search within the Alerts table contents. You can also view additional details for an alert by selecting a record in the Alerts table.
To view the Alerts page, access the Infinity XDR/XPR Administrator Portal and click Incidents > Alerts.
|
Legend |
Item |
Description |
|---|---|---|
|
1 |
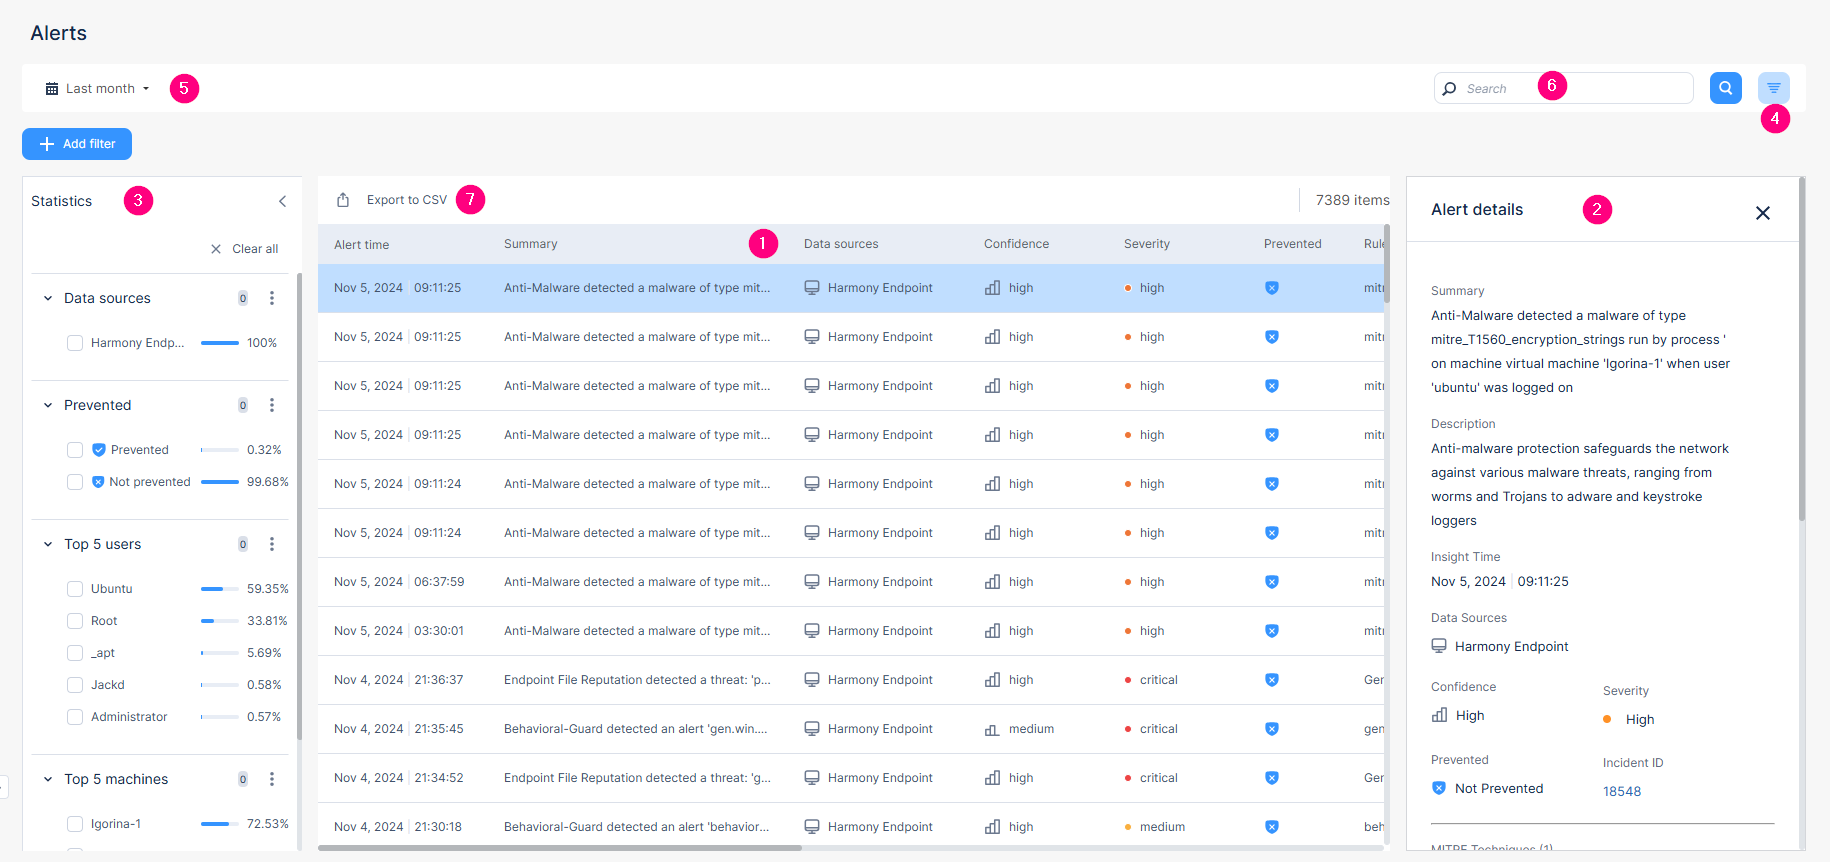
Alerts table |
Shows alerts from all the incidents. For more information, see Alerts Table. |
|
2 |
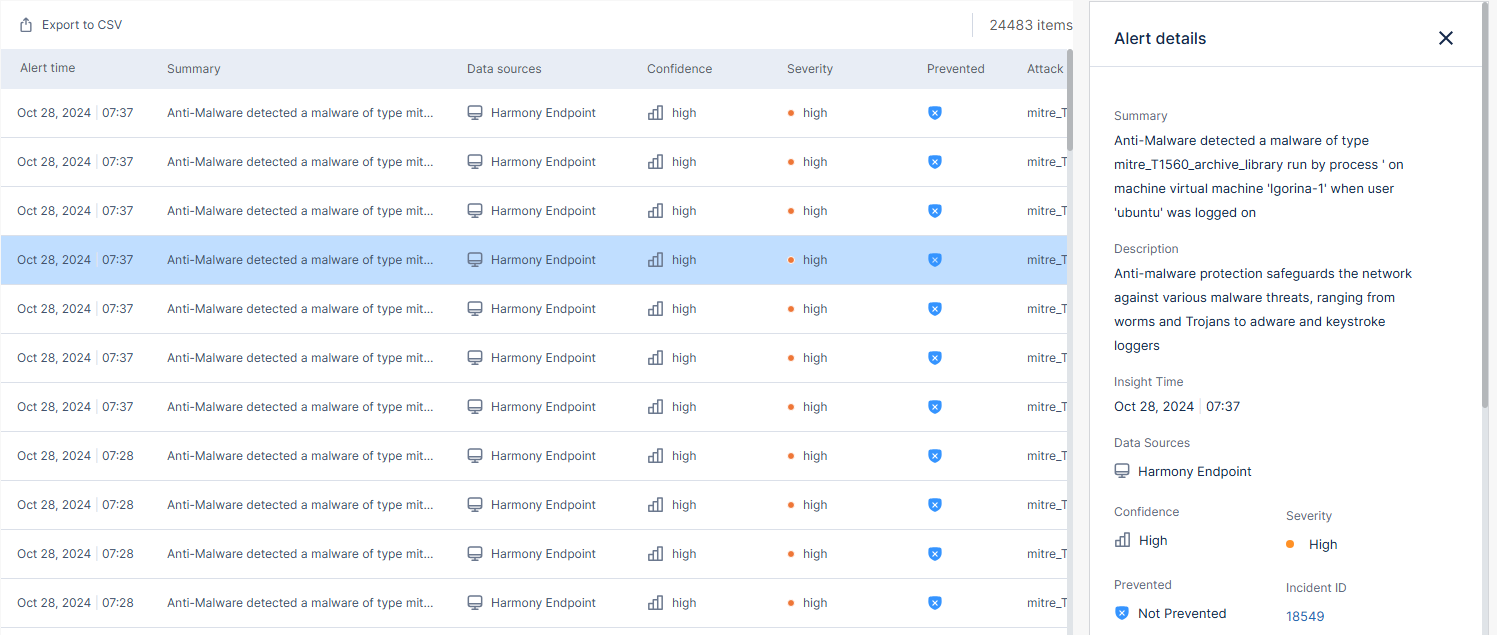
Alert details |
Shows additional information about the alert. |
|
3 |
Statistics |
Shows different filters that you can apply on the Alerts table. For more information, see Statistics. |
|
4 |
Add filter icon |
Adds a new filter to the Alerts table. For more information, see Adding a New Filter. |
|
5 |
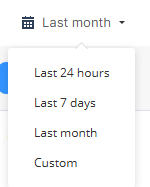
Time period |
Shows the time period selected for the Alerts table. By default, the table shows the alerts generated in the previous month. To view alerts during a specific time period, select the required option from the list.
|
|
6 |
Search |
Enter the search text to search for any alert data. |
|
7 |
Export to CSV |
Click Export to CSV to export the Alerts table data to a CSV file. The system downloads a CSV file with the alerts data. |
Alerts Table
The Alerts table shows:
|
Column |
Description |
|---|---|
|
Alert time |
Date and time when the alert was generated. |
|
Summary |
Summary of the alert. |
|
Data sources |
Application from which the alert was generated. |
|
Confidence |
Confidence level of alert detection. |
|
Severity |
Severity level of the alert. |
|
Prevented |
Shows whether the attack was prevented:
|
|
Name of the attack that generated the alert. |
|
|
MITRE Techniques |
MITRE ATT&CK technique used in the attack. |
|
Indicators name |
Name of the indicators related to the alert. |
|
Asset name |
Asset related to the alert. |
|
Process name |
Name of the process related to the alert. |
|
Artifacts |
Artifacts related to the alert. |
|
Files |
Files related to the alert. |
|
Email subject |
Subject(s) in the email that triggered the original detection. |
|
ID of the incident related to the alert. To view the incident details, click the ID. The Incidents - Overview page appears. |
 - Attack was prevented.
 - Attack was not prevented.
To view details of a specific alert, click the alert row. The system shows the Alert details tab on the right side.
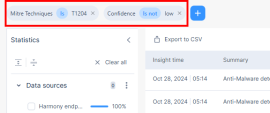
You can filter the Alerts table by either including (Filter) or excluding (Filter out) specific fields. To do that, hover over the field and click the  icon and then select the required option.

Statistics
The Statistics panel allows you to filter the Alerts table. By default, these primary filters are available:
-
Data sources
-
Prevented
-
Top 5 users
-
Top 5 machines
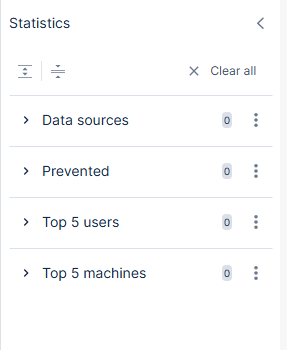
To apply these filters on the Alerts table data, expand the required filter and select the parameters.
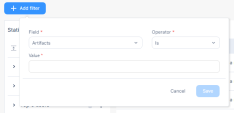
Adding a New Filter
You can add new filters in addition to the primary filters.
To add a new filter:
-
Click the
 icon at the top-right corner.
 -
Click Add filter above the Statistics panel.
-
Enter these details:
-
Field - Select the alert field.
-
Operator - Select the operator to be applied.
-
Value - Enter the value of the alert field.
-
-
Click Save.
The system adds the filter and applies it on the Alerts table.