Appendix D - Using MS-DHCP as the IoT Discovery Engine (Logs Read from Splunk)
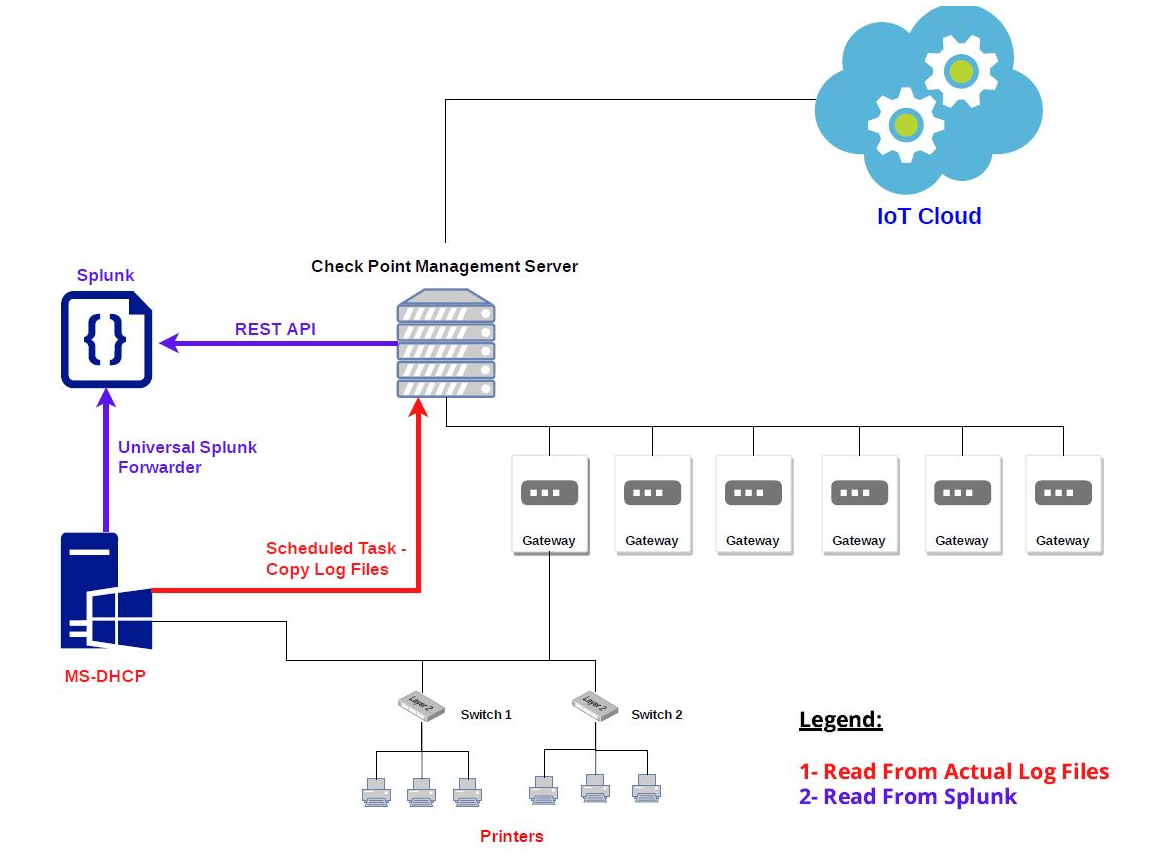
You can set up an IoT discovery engine on the Check Point Management Server to discover IoT assets in your network. The IoT discovery engine uses the network devices in the network, such as switches, routers, gateways, or Network Access Control (NAC) devices to discover IoT assets.
You can use the Microsoft Dynamic Host Configuration Protocol (MS-DHCP) server to discover IoT assets. It maintains a pool of IP addresses and provides (leases) an IP address to every new DHCP-enabled client. MS-DHCP integration is based on events log files created by the MS-DHCP server. The events may include the MAC address of the device (DHCP-enabled client) and the leased IP address.
MS-DHCP server reads the DHCP events by one of these methods:
-
The event logs from the MS-DHCP server are copied to a local directory and the logs are read from this local directory.
-
The event logs from the MS-DHCP server are forwarded to the Splunk server and the logs are read from the Splunk server.
This appendix describes the MS-DHCP integration when the MS-DHCP event logs are read from the Splunk server.
Setting Up MS-DHCP as the IoT Discovery Engine (Logs Read from Splunk)
-
Set the Splunk server to index DHCP event logs created by the MS-DHCP server.
-
To forward the logs to Splunk, install Splunk Universal Forwarder on the MS-DHCP server. To install the Splunk Universal Forwarder, see Splunk Universal Forwarder.
-
To parse the MS-DHCP logs, install the Splunk Add-on for Microsoft Windows on the Splunk server. To install Splunk Add-on for Microsoft Windows, see Splunk Add-on for Microsoft Windows.
-
Create a Custom Index for MS-DHCP logs (DHCP). To create a Custom Index, see Create Custom Indexes.
-
-
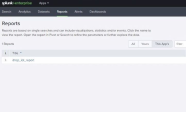
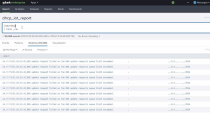
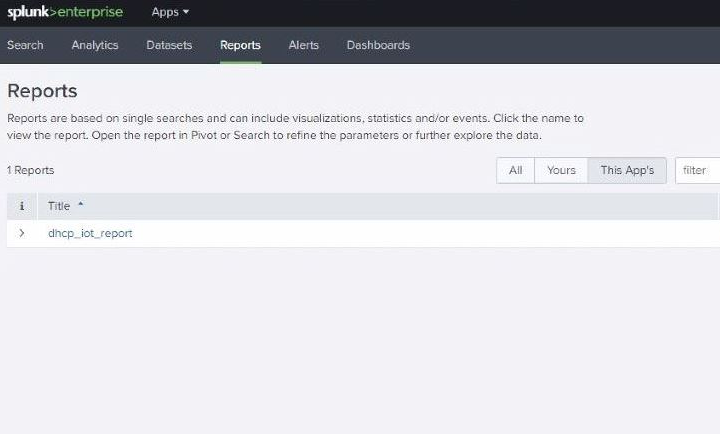
Create a scheduled report of the MS-DHCP event logs on the Splunk server. To create a scheduled report, see Creating Scheduled Reports in Splunk.
-
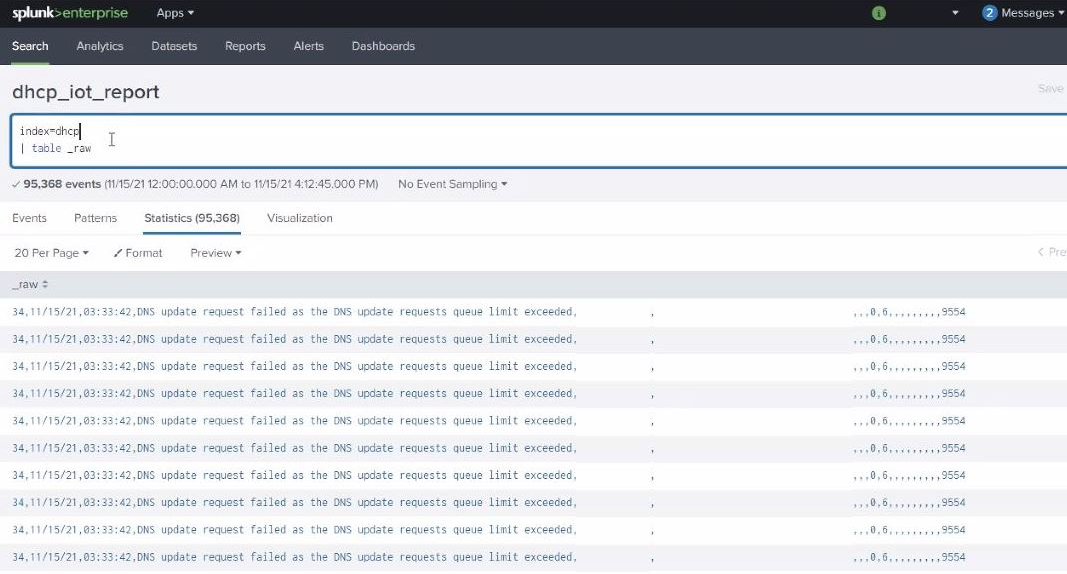
In the report created, search for the keyword index*dhcp.
-
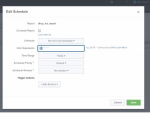
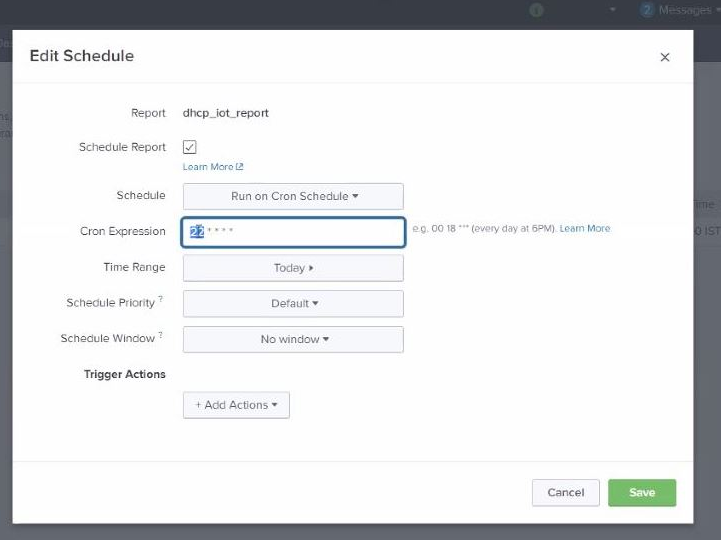
Edit the schedule for the report.
-
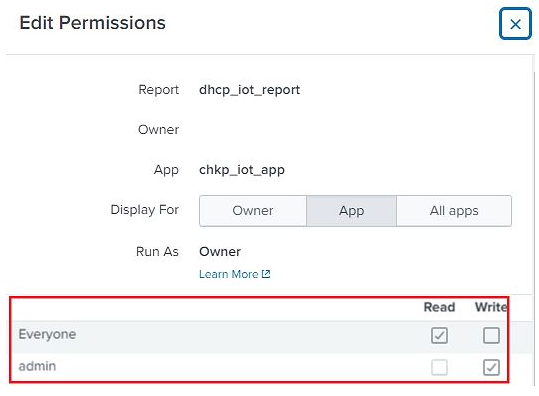
Set Read permission for the report created.

-
Create an authentication token to securely access Splunk REST API to read MS-DHCP event logs (Reading from Splunk).
-
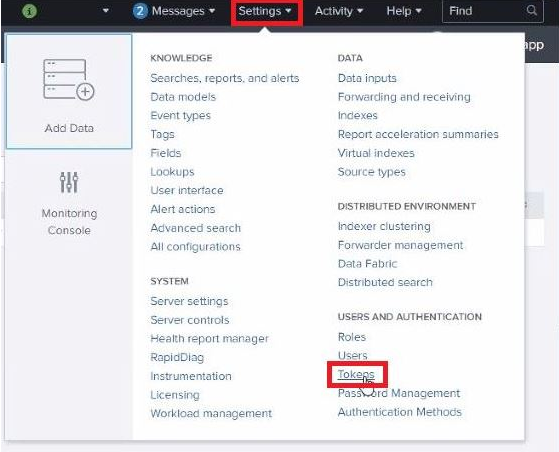
In the Splunk server, go to Settings > Tokens.
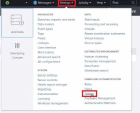
-
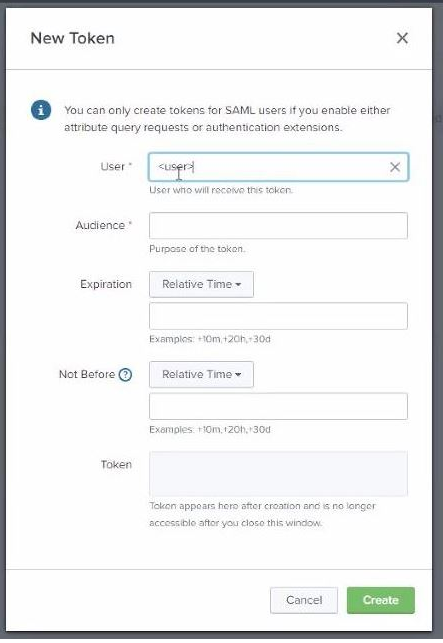
Click New Token.
-
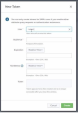
In the New Token window, enter this information:
-
User - The Splunk platform user that you want to create the token for.
-
Audience - A short description on the purpose of the token.
-
(Optional) Expiration- Select Absolute Time or Relative Time.
-
(Optional) Not Before - Select Absolute Time or Relative Time.
-
Click Create.
The New Token window updates the Token field to display the generated token.
-
-
-
Enable access to Splunk REST API in the Access Control policy (Reading from Splunk).
Set the relevant access rules in the Access Control policy on the relevant gateway to allow the Management Server to access the Splunk REST API.
Splunk REST API uses port 8089 (over TCP).
-
Set MS-DHCP as the IoT discovery engine in Quantum IoT Protect.
-
Log in to Check Point Infinity Portal.
-
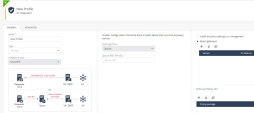
Under Quantum, go to IoT Protect > IoT > Profiles.
-
Set Integration type to MS DHCP.
-
Set Read logs from to Splunk.
-
Click Enforce.
-
-
Set local configuration on the Management Server (When using Splunk).
MS-DHCP built-in discovery integration can access the Splunk REST API to read the MS-DHCP event logs. To securely access the Splunk REST API, set an authentication token locally on the Management Server.
To set the authentication token:
-
Set the integration in Quantum IoT Protect.
-
Access (SSH) the Management Server.
-
Run this bash script:
/etc/cp/scripts/iot/msDhcp/set-local-configuration.sh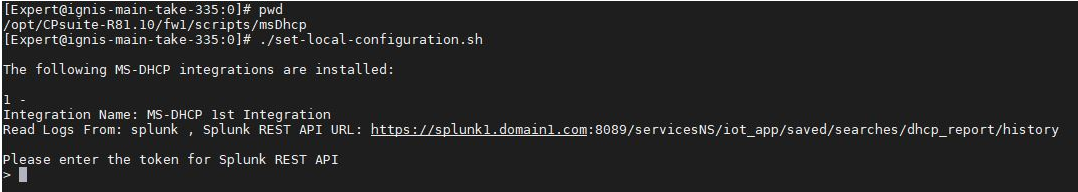
-

Configuring integration installed on a cluster gateway
-
Access each gateway through SSH and log in to Expert mode.
-
Change each gateway to active mode. For more information, see Initiating Manual Cluster Failover.
-
Run this bash script:
/etc/cp/scripts/iot/msDhcp/set-local-configuration.sh
Configuring integration installed on a Management Server with HA or on MDS with HA
-
Access each gateway through SSH and log in to Expert mode.
-
Change the gateway to active mode. For more information, see Changing a Server to Active or Standby.
-
Run the command
/etc/cp/scripts/iot/msDhcp/set-local-configuration.sh
Testing the MS-DHCP - IoT Discovery Engine
-
Connect to the command line on the Check Point Security Gateway / Management Server (over SSH or console).
-
Log in to the Expert mode.
-
Run:
cpnano -s
Note - The output for this command may take time to appear depending on how long the system takes to enforce the profile. If you do not see the output, then verify whether you have selected the correct Security Gateway / Management Server in the Profiles setting.
-
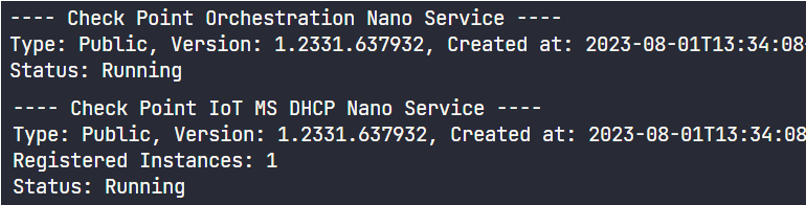
These nano services must be running:
-
Check Point Orchestration -
Check Point IoT MS DHCP
Output:
-
Troubleshooting MS-DHCP IoT Discovery Engine (Logs Read from Splunk)
-
Access the Check Point Management Server through SSH and log in to the Expert mode.
-
Run these commands to ensure that the network and access control rules have enabled the Check Point Management Server access to Splunk REST API:
-
ping <Splunk server's IP Address> -
ping <Splunk server's FQDN> -
telnet <Splunk server's FQDN> 8089
-