Alerts
The Alerts page shows the alerts received for the monitored assets.
To view the Alerts page, access the Events & AIOps Administrator Portal and go to AIOps > Alerts.
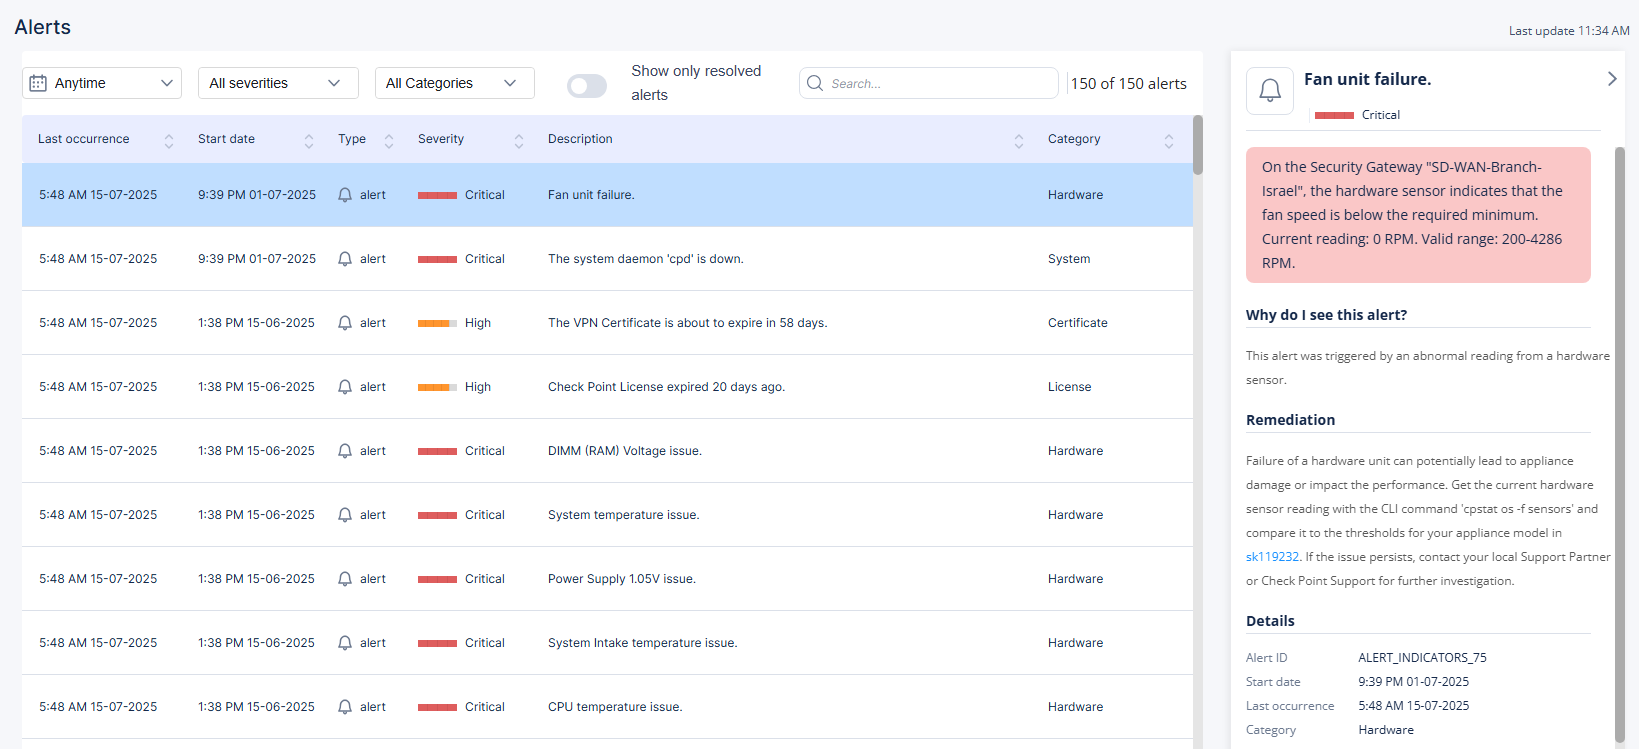
The Alerts table shows:
| Item | Description |
|---|---|
| Last occurrence | Date and time when the alert most recently occurred. |
| Start date | Date and time when the alert started. |
| Type | Type of the alert:
|
| Severity | Severity of the alert:
|
| Description |
Details of the alert or insight. To view more information, click the row. A panel opens on the right side and displays additional details. |
| Category | Category of the alert. |
| Object name | Assets name from the Management Server. |
| Hostname | Host name defined by the user. |
| Originator | Component from which the alert originated. |
You can filter the Alerts table by:
Time frame
Severity
Category
Resolved alerts
The Last update shows the time when the Alerts page was last updated.
To search for a specific alert/insight, enter the value in the Search field.
For information on AIOps alerts and their descriptions, see Appendix A - AIOps Alerts.