AIOps - Overview
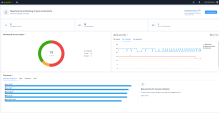
The Overview page under AIOps provides an overview of the monitored assets.
To view the Overview page, access Infinity Events and go to AIOps > Overview.
The top banner shows the number of connected and monitored assets. To connect more assets, click Add more assets. The Gateways & Servers page appears where you can add the assets.

|
|
Note - This banner appears only when there are unconnected assets. |
The number of physical assets connected in each asset type are shown below the banner.
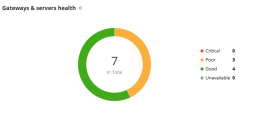
Gateways and Servers Health
The Gateways & servers health widget shows the number of physical and virtual assets connected and their health status according to the severity of alerts:
-
Good
-
Poor
-
Critical
-
Unavailable
|
|
Note - The pie chart shows the health status over the past five seconds. |
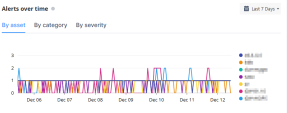
Alerts Over Time
The Alerts over time widget shows the statistics and trends of alerts received over a specific time period. You can select the time period from the top-right corner and filter the alerts by:
-
Asset
-
Category
-
Severity
Top Assets
The Top assets widget shows the top five assets in these categories and provides the best practices to reduce resource utilization:
-
Memory utilization - Top five assets with the highest memory utilization (RAM).
-
Disk - Top five assets with the highest disk space utilization.
-
Network - Top five assets that received the highest traffic.
-
CPU - Top five assets with the highest CPU usage.


