Customize the Analytics dashboard using Infinity AI Copilot
-
Enter your prompt and click
 .
.
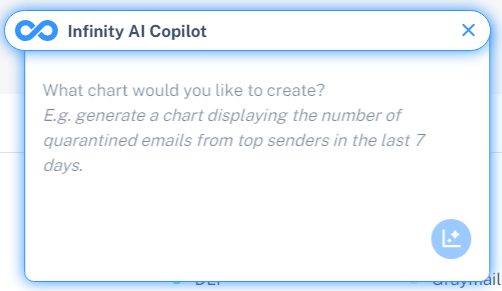
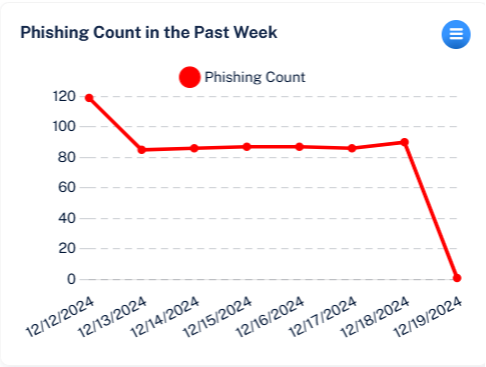
The system generates actionable data insights and analytics such as charts, tables, and other visualizations, in response to the provided GenAI prompt.
-
To make changes to the analytics generated using GenAI prompts, click the
 icon from the top left corner of the chart.

-
To change the title of the chart, click Edit title, make the necessary changes, and click Save.
-
To modify the prompt for the chart, click Edit chart, make the necessary changes, and then click
at the bottom of the chart.Note:Until the chart is published, it remains visible only to you. To make the chart visible for all users, click Publish chart.
After publishing the chart, all users of the Avanan Administrator Portal in your organization can see them.
-
To move the chart to the desired location in the dashboard:
Click Drag chart.
Move the chart to the desired location.
Click Stop Drag Mode from the top left corner of the chart.
Note:This option is available only when there are multiple analytics created using Infinity AI Copilot.
You cannot change the position of the default analytics widgets.
To copy the chart, click Copy chart.
To download the chart as a PNG file, click Download (PNG).
To reload the chart, click Refresh.
To delete the chart, click Delete.
To return to the options and generated chart, click
 .
.
-