Timeline
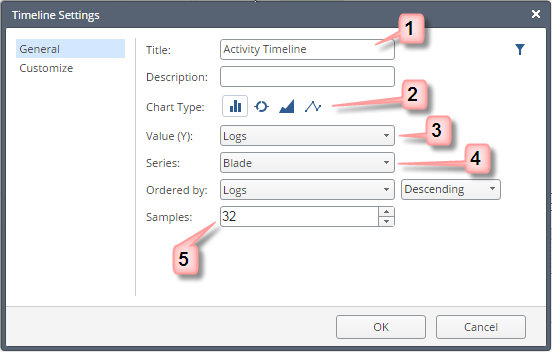
- Enter a title.
- Select a timeline graphical presentation: vertical bar, doughnut, area or line.
- Select the data to count.
- Advanced - split the results into colored groups, with different values for the .
- Define the time-granularity. Enter the number of bars or doughnuts to show.


