

The infographic widget shows large meaningful values. For example:

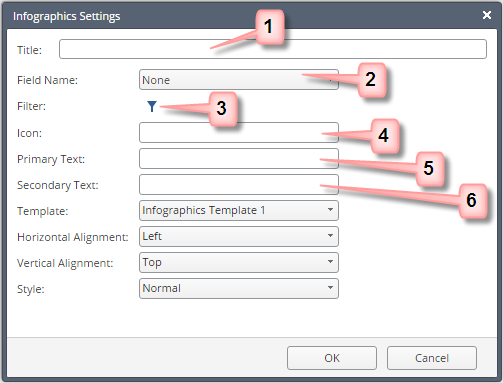
Configure an infographic using these settings:

This critieria is in addition to the inherited filters for the report and view layers.
For more, see Filters.
Select a name from the list below. Pay attention to upper and lower case letters and the use of hyphens.
Icon |
Used for |
|---|---|
apps |
|
attacks |
|
hosts |
|
Gateway |
|
traffic |
|
usercheck |
|
users |
|
new |
Audit Logs |
add |
Audit Logs |
remove |
Audit logs |
modify |
Audit logs |
install-policy |
|
publish |
|
ips |
|
anti-bot |
|
anti-virus |
|
threat-emulation |
|