

To enable SmartEvent views and reports, you must install and configure a SmartEvent Server.
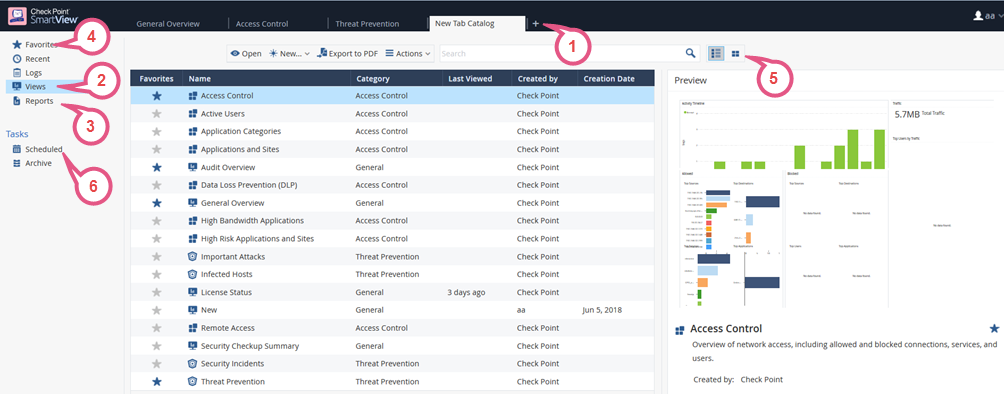
In the Logs & Monitor view, click the (+) tab to open a catalog of all views and reports, predefined and customized. Click a view or report to open it.

Item |
Description |
|---|---|
1 |
Open Log View - See and search through the logs from all Log Servers. You can also search the logs from a Log Server that you choose. Open Audit Logs View - See and search records of actions done by SmartConsole administrators. These views come from the Log Servers. All other Views/Reports (except the Compliance View) come from the SmartEvent Server. |
2 |
Views - The list of predefined and customized views. A view is an interactive dashboard made up of widgets. The view tells administrators and other stakeholders about security and network events. Each widget is the output of a query. Widgets can show the information as a chart, table, or some other format. To find out more about the events, double-click a widget to drill down to a more specific view or raw log files. Compliance View - Optimize your security settings and ensure compliance with regulatory requirements. |
3 |
Reports - The list of predefined and customized reports. A report has multiple pages, and applies to the time that the report is generated. There are several predefined reports, and you can create new reports. A reports gives more details than a view. Reports can be customized, filtered, generated and scheduled. You cannot drill down into a report. |
4 |
Favorites - Use this view to collect the views and reports you use the most. |
5 |
Switch to Table View or Thumbnails View - The Table view is the default for views and reports. The Thumbnails view is the default for the Favorites, Recent and Logs views and reports. |
6 |
Scheduled Tasks - See and edit scheduled tasks. Archive - Completed and in-progress tasks for generating and exporting views, reports, logs and templates. |
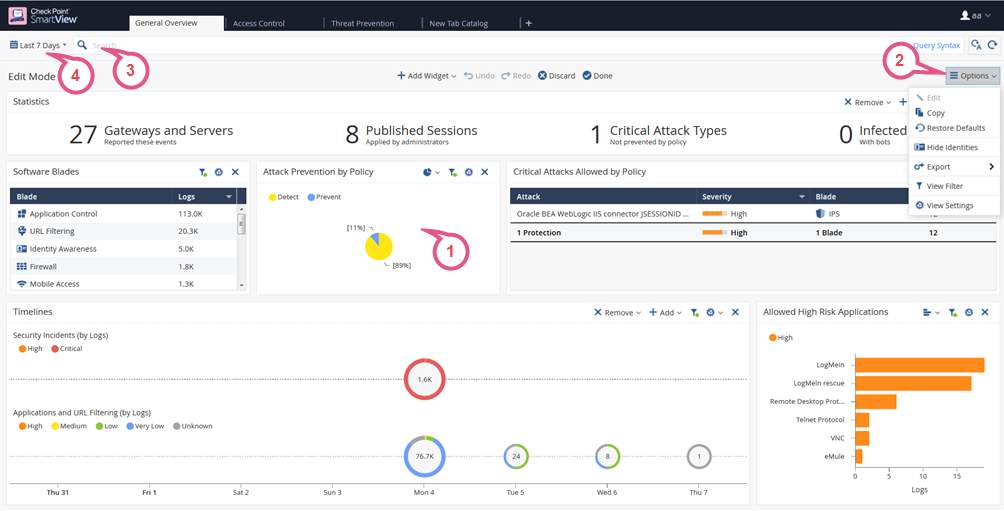
Views window tells administrators and other stakeholders about security and network events. A View window is an interactive dashboard made up of widgets. Each widget is the output of a query. A Widget pane can show information in different formats, for example, a chart or a table.
SmartConsole comes with several predefined views. You can create new views that match your needs, or you can customize an existing view. Views are accurate to the time they were generated or refreshed.
In the Logs & Monitor view, clicking the (+) tab opens a catalog of all views and reports, predefined and customized. To open a view, double-click the view or select the desired view and click Open from the action bar.

Item |
Description |
|---|---|
1 |
Widget- The output of a query. A Widget can show information in different formats, for example, a chart or a table. To find out more about the events, you can double-click most widgets to drill down to a more specific view or raw log files. |
2 |
Options - Customize the view, restore defaults, Hide Identities, export. |
3 |
Query search bar - Define custom queries using the GUI tools, or manually entering query criteria. Shows the query definition for the most recent query. |
4 |
Time Period - Specify the time periods for the view. |