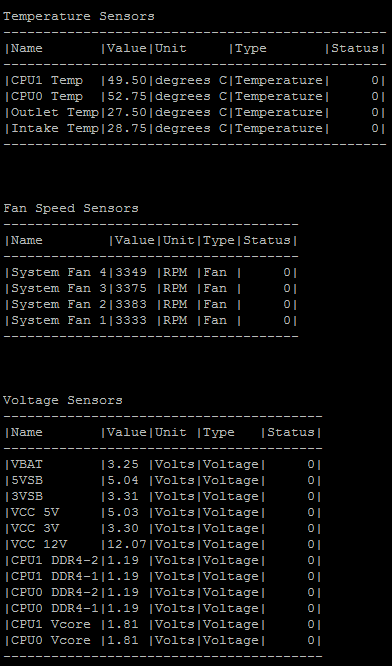


You can monitor these hardware elements:
In addition, see sk119232 - Hardware sensors thresholds on Check Point appliances.
Note - The Hardware Health page appears only on supported hardware.
In the navigation tree, click Maintenance > Hardware Health.
You can see the status of the machine fans, system temperature, the voltages, and (for supported hardware only) the power supply.
For each component sensor, the table shows the value of its operation, and the status: OK, Low, or High.
Description
These commands display the status for various system hardware components. Components, for which the status can be shown, include BIOS, cooling fans, , power supplies, temperature, and voltages.
The command returns information only for installed hardware components and only on supported hardware.
Syntax
show sysenv all bios fans ps temp volt |
Parameters
Parameter |
Description |
|
Shows all system/hardware information. |
|
Shows BIOS information. |
|
Shows speed of cooling fans. |
|
Shows voltages and states of power supplies. |
|
Shows information from temperature sensors. |
|
Shows voltages information. |
Example
gaia> show sysenv all
Hardware Information
Name Value unit type status Maximum Minimum +12V 29.44 Volt Voltage 0 12.6 11.4 +5V 6.02 Volt Voltage 0 5.3 4.75 VBat 3.23 Volt Voltage 0 3.47 2.7 gaia> |
You can see information about the hardware, on which Gaia is installed using these commands:
Command |
Description |
|---|---|
|
You can run it in Gaia Clish only. |
|
You can run it in Gaia Clish, or Expert mode. |
In addition, see sk119232 - Hardware sensors thresholds on Check Point appliances.
Description
Shows information about the hardware, on which Gaia is installed. You can run it in Gaia Clish only.
The information shown depends on the type of hardware. Common types of information shown are:
Syntax
show asset<SPACE><TAB> |
show asset all |
show asset <Category Name> |
Parameters
Parameter |
Description |
<SPACE><TAB> |
Shows a list of asset categories, such as The available categories depend on the type of hardware. |
|
Shows all available hardware information. The information shown depends on the type of hardware. |
|
Shows available information for a specified category. |
Example 1
gaia> show asset<SPACE><TAB> system all gaia> |
Example 2
gaia> show asset system Platform: Check Point 5800 Serial Number: XXX CPU Model: Intel(R) Xeon(R) E3-1285Lv4 CPU Frequency: 3400 Disk Size: 500GB Number of Cores: 8 CPU Hyperthreading: Enabled gaia> |
Description
Shows information from supported hardware sensors. You can run it in Gaia Clish, or Expert mode.
Syntax
cpstat os -f sensors |
Example
