


|
|
|
In This Section: |
SmartView Monitor gives you a complete picture of network and security performance. Use it to respond quickly and efficiently to changes in gateways, tunnels, remote users and traffic flow patterns or security activities.
SmartView Monitor is a high-performance network and security analysis system. This system helps you to establish work habits based on learned system resource patterns. Based on Check Point Security Management Architecture, SmartView Monitor provides a single, central interface, to monitor network activity and performance of Check Point Software Blades.
SmartView Monitor allows administrators to easily configure and monitor different aspects of network activities. You can see graphical from an integrated, intuitive interface.
Defined views include the most frequently used traffic, counter, tunnel, gateway, and remote user information. For example, Check Point System Counters collect information on the status and activities of Check Point products (for example, VPN or NAT). With custom or defined views, administrators can drill-down the status of a specified gateway and/or a segment of traffic. That way, administrators identify top bandwidth hosts that can influence network performance. If suspicious activity is detected, administrators can immediately apply a Firewall rule to the applicable Security Gateway to block that activity. These Firewall rules can be created dynamically through the graphical interface and be set to expire in a specified time period.
You can generate Real-time and historical graphical reports of monitored events. This provides a comprehensive view of gateways, tunnels, remote users, network, security, and performance over time.
The monitoring views show real-time and historical graphical views of:
In SmartView Monitor you can create customized monitoring view.
Examples of scenarios for which SmartView Monitor can help:
To open the monitoring views in SmartConsole:
To open SmartView Monitor:
If the status shows an issue, you can act on that network object.
For example:
To monitor a Gateway in the Logs & Monitor view of SmartConsole, or in SmartView Monitor:
No other deployment steps are necessary.
Alerts provide real-time information about possible security threats, and how to avoid, minimize, or recover from the damage. The administrator can define alerts to be sent for different gateways and for certain policies or properties.
The gateways send alerts to the Security Management Server. The Security Management Server forwards these alerts to SmartView Monitor. By default, an alert is sent as a pop-up message to the administrator desktop when a new alert arrives to SmartView Monitor.
You can set global alert parameters for all gateways in the system, or specify an action to send an alert for a particular gateway.
Alerts are sent when:
System Alerts are sent for predefined system events or for important situation updates. For example, if free disk space is less than 10%, or if a security policy is changed. System Alerts can also be defined for each product. For example, you can define System Alerts for Unified Package and other System Alerts for Check Point QoS.
Alert commands are set in SmartConsole > Global Properties > Log and Alert > Alerts page. The Alerts in this window apply only to Security Gateways.
To see alerts:
The Alerts window opens.
The Check Point Security Management Server System Alert monitoring mechanism uses the defined System Alert thresholds. If a threshold is reached, it activates the defined action.
To activate System Alert monitoring:
Go to Tools > Start System Alert Daemon.
To stop the System Alert monitoring:
Go to Tools > Stop System Alert Daemon.
Description
This tool executes SAM (Suspicious Activity Monitoring) actions according to information received through standard input. This tool is for executing SAM actions with the user defined alerts mechanism.
Syntax
sam_alert [-o] [-v] [-s <sam_server>] [-t <timeout>] [-f <fw_host1> <fw_host2>...] [-C] [-n|-i|-I -src|-dst|-any|-srv]
Parameter |
Description |
|---|---|
|
Prints the input of this tool to the standard output (for pipes). |
|
Turns on verbose mode of the |
|
The SAM server to be contacted. Localhost is the default. |
|
The time period, in seconds, for which the action will be enforced. The default is forever. |
|
Identifies the firewalls to run the operation on. Default is |
|
Cancels the specified operation. |
|
Notify every time a connection that matches the specified criteria passes the Firewall. |
|
Inhibit connections that match the specified criteria. |
|
Inhibit connections that match the specified criteria and close all existing connections that match the criteria. |
|
Match the source address of connections. |
|
Match the destination address of connections. |
|
Match either the source or destination address of the connection. |
|
Match specific source, destination, protocol and service. |
Suspicious Activity Monitoring (SAM) is a utility integrated in SmartView Monitor. It blocks activities that you see in the SmartView Monitor results and that appear to be suspicious. For example, you can block a user who tries several times to gain unauthorized access to a network or Internet resource.
A Security Gateway with SAM enabled has Firewall rules to block suspicious connections that are not restricted by the security policy. These rules are applied immediately (Install Policy not required).
Connections between enterprise and public networks are a security challenge as they leave the network and its applications open to attack. You must be able to inspect and identify all inbound and outbound network activity and decide if it is suspicious.
SAM rules use CPU resources. Therefore, set an expiration time so you can inspect traffic but not negatively affect performance.
If you confirm that an activity is risky, edit the Security Policy, educate users, or handle the risk.
You can block suspicious activity based on source, destination, or service.
To block an activity:
The Enforced Suspicious Activity Rules window opens.
The Block Suspicious Activity window opens.
Any.Any.To create an activity rule based on TCP or UDP use:
The Select Service window opens.
To define SmartView Monitor actions on rule match:
The Advanced window opens.
If you monitor traffic, and see a suspicious result, you can create an SAM rule immediately from the results.
Note - You can only create a Suspicious Activity rule for Traffic views with data about the Source or Destination (Top Sources, Top P2P Users, and so on).
To create an SAM rule:
The Select Gateway / Interface window opens.
The Block Suspicious Activity window opens.
For example:
Your corporate policy does not allow to share peer2peer file, and you see it in the Traffic > Top P2P Users results.
The SAM rule is set up automatically with the user IP address and the P2P_File_Sharing_Applications service.
The Enforced Suspicious Activity Rules window shows the currently enforced rules. If you add a rule that conflicts with another rule, the conflicting rule remains hidden. For example, if you define a rule to drop http traffic, and a rule exists to reject http traffic, only the drop rule shows.
Data for the status of all gateways in the system is collected by the Security Management Server and viewed in SmartView Monitor. The data shows status for:
Gateway Status is the SmartView Monitor view which shows all component status information. A Gateway Status view shows a snapshot of all Software Blades, such as VPN and ClusterXL, and third party products (for example, OPSEC-partner gateways).
Gateway Status is similar in operation to the SNMP daemon that provides a mechanism to get data about gateways in the system.
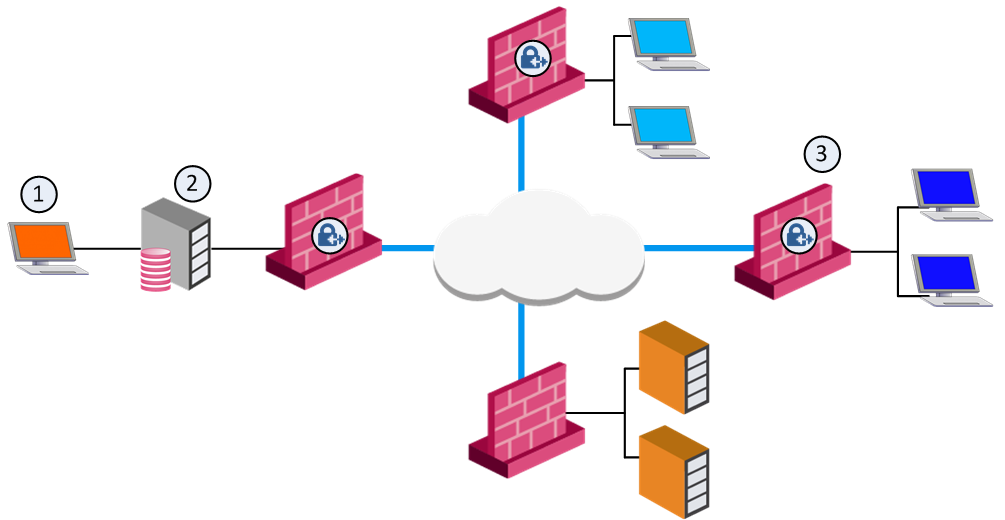
SIC is initialized between Security Gateways (3) (local and remote), and the Security Management Server (2). The Security Management Server then gets status data from the Software Blades with the AMON (Application Monitoring) protocol. SmartView Monitor (1) gets the data from the Security Management Server.
The Security Management Server acts as an AMON client. It collects data about installed Software Blades. Each Security Gateway, or any other OPSEC gateway which runs an AMON server, acts as the AMON server itself. The gateway requests status updates from other components, such as the Firewall kernel and network servers. Requests are fetched at a defined interval.
An alternate source for status collection can be any AMON client, such as an OPSEC partner, which uses the AMON protocol.
The AMON protocol is SIC- based. It can collect data only after SIC is initialized.
The Security Management Server collects status data from the Security Gateways on a defined interval. The default is 60 seconds.
To set the Status Fetching Interval:
You can set thresholds for selected gateways. When a threshold is passed, a system alert is sent.
To set System Alert thresholds:
The Threshold Settings window opens.
To change Global Threshold settings:
The Global Threshold Settings window opens.
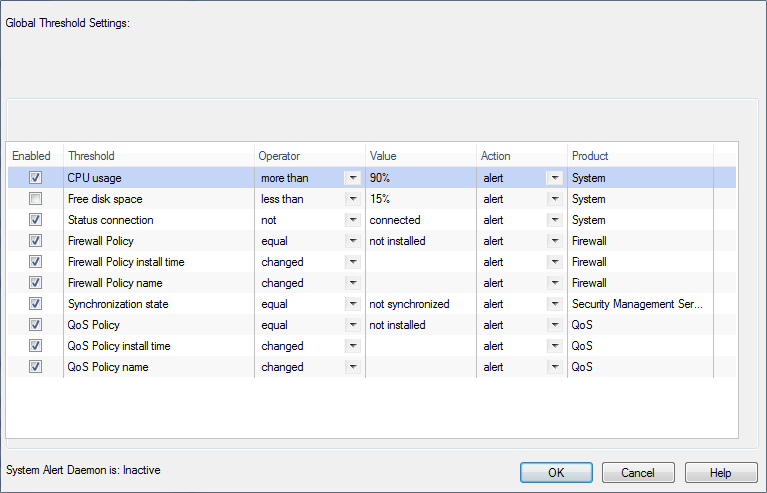
To change custom threshold settings:
The global threshold settings show.
You can configure a variety of different SNMP thresholds that generate SNMP traps, or alerts. You can use these thresholds to monitor many system components automatically without requesting information from each object or device. The categories of thresholds that you can configure include:
Some categories apply only to some machines or deployments.
Note - SNMP monitoring thresholds are supported from R75.20, R71.30, and higher.
In each category there are many individual thresholds that you can set. For example, the hardware category includes alerts for the state of the RAID disk, the state of the temperature sensor, the state of the fan speed sensor, and others. For each individual threshold, you can configure:
You can also configure some settings globally, such as how often alerts are send and where they are sent to.
Configure the SNMP monitoring thresholds in the command line of the Security Management Server. When you install the policy on the gateways the SNMP monitoring thresholds are applied globally to all gateways.
Configuring in Multi-Domain Security Management
In a Multi-Domain Security Management environment, you can configure thresholds on the Multi-Domain Server and on each individual Domain Server. Thresholds that you configure on the Multi-Domain Server are for the Multi-Domain Server only. Thresholds that you configure for a Domain Server are for that Domain Server and its gateways. If a threshold applies to the Multi-Domain Server and the Domain Server gateways, set it on the Multi-Domain Server and Domain Server. But in this situation you can only get alerts from the Multi-Domain Server if the threshold passed.
For example, because the Multi-Domain Server and Domain Server are on the same machine, if the CPU threshold is passed, it applies to both of them. But only the Multi-Domain Server generates alerts.
You can see the Multi-Domain Security Management level for each threshold with the threshold_config utility.
Configuring a Local Gateway Policy
You can configure SNMP thresholds locally on a gateway with the same procedure that you do on a Security Management Server. But each time you install a policy on the gateway, the local settings are erased and it reverts to the global SNMP threshold settings.
You can use the threshold_config utility to save the configuration file and load it again later.
On SecurePlatform and Linux, the configuration file that you can back up is: $FWDIR/conf/thresholds.conf
On Windows, the configuration file that you can back up is: %FWDIR%\conf\thresholds.conf
There is one primary command to configure the thresholds in the command line, threshold_config. You must be in the Expert mode to run it. After you run threshold_config, follow the on-screen instructions to make selections and configure the global settings and each threshold.
When you run threshold_config, you get these options:
If you select Configure global alert settings, you can configure global settings for how frequently alerts are sent and how many alerts are sent. You can configure these settings for each threshold. If a threshold does not have its own alert settings, it uses the global settings by default.
You can configure these options:
If you select Configure Alert Destinations, you can add and remove destinations for where the alerts are sent. You can see a list of the configured destinations. A destination is usually an NMS (Network Management System) or a Check Point Log Server.
After you enter the details for a destination, the CLI asks if the destination applies to all thresholds.
For each threshold, you can choose to which of the alert destinations its alerts are sent. If you do not define alert destination settings for a threshold, it sends alerts to all of the destinations that you applied to all thresholds.
For each alert destination enter:
If you select Configure thresholds, you see a list of the categories of thresholds, including:
Some categories apply only to some machines or deployments. For example, Hardware applies only to Check Point appliances and High Availability applies only to clusters or High Availability deployments.
Select a category to see the thresholds in it. Each threshold can have these options:
You can complete threshold configuration and activate the settings.
To complete configuration and activate the settings:
cpwd_admin utility to restart the CPD process:cpwd_admin stop -name CPD -path "$CPDIR/bin/cpd_admin" -command "cpd_admin stop" cpwd_admin start -name CPD -path "$CPDIR/bin/cpd" -command "cpd"You can see an overview of the SNMP thresholds that you configure in SmartView Monitor.
To see an overview of the SNMP thresholds:
In the pane that opens, you can see these details:
You can create Custom Views, to change the fields that show in the results.
The changes you make to a view are not automatically saved. You can use this procedure to save a predefined view as a new Custom view.
To save a new view with changes:
Note - For some of the views, this option is View Properties or Query Properties.
To create a custom Gateway status view:
The Gateway Properties window opens.
To creating a custom traffic view:
The Query Properties window opens.
The tabs that show depend on the Query Type you selected.
To create a custom counters view:
The Query Properties window opens.
You can add counters from different categories to one view.
To create a custom tunnel view:
The Query Properties window shows.
Prompt on: When you run the view, you will be asked for the specified Tunnel, Community or Gateway on which to base your view.
Important - Do not select Prompt on if your view is not about one of these three.
Show two records per tunnel shows a more accurate status because the report provides the status for the tunnels in both directions.
A Tunnels view shows in the Custom branch of the Tree View.
To create a custom users view:
The Query Properties window shows.
Prompt on: When you decide to run the view, you will be asked for the specified User DN or Gateway on which to base your view.
Important - Do not select Prompt on if your view is not about one of these two.
A Users view shows in the Custom branch of the Tree View.
For example purposes, we create a real-time Traffic view for Services.
To create a real-time traffic view:
The Query Properties window shows.
Real-Time provides information about currently monitored traffic or system counters.
Note - The remaining tabs in the Query Properties window change according to the type of view you create and the selection you made in the Real-Time drop-down list.
Target is the gateway for which you monitor traffic.
The Select Gateway / Interface window shows.
The new view is saved in the Custom branch.
You can back up a custom view before you install an upgrade. You can share a custom view with other SmartView Monitor GUI clients and other users.
To export a custom view:
A file with an svm_setting extension is created.
You can set which view to see when SmartView Monitor starts.
In the Tree, right-click the view and select Run at Startup.
Results are automatically refreshed every 60 seconds.
To refresh the view earlier, right-click the view name in the Tree and select Run.
To refresh data about an object in the current view, right-click the object in the results and select Refresh.
Status updates show for Security Gateways and Software Blades. The Overall status of a gateway is the most serious status of its Software Blades. For example, if all the Software Blades statuses are OK except for the SmartEvent blade, which has a Problem status, the Overall status is Problem.
Status Icon |
Description |
|---|---|
|
The gateway and all its Software Blades work properly. |
|
At least one Software Blade has a minor issue, but the gateway works. |
|
At least one Software Blade reported a malfunction, or an enabled Software Blade is not installed. |
|
SmartView Monitor waits for the Security Management Server to send data from Security Gateways. |
|
Cannot reach the Security Gateway. |
|
Cannot make Secure Internal Communication between the Security Management Server and the gateway. |
Gateway Status data shows for each Check Point or OPSEC gateway.
To see data about a gateway, click the gateway in the Gateway Results view. Details about the gateway show in the Gateway Details pane.
To view the status of Check Point applications on the local server or another appliance, the cpstat command.
The Virtual Private Networks (VPN) is divided into these main statuses:
This includes:
The number of users that are currently connected.
Indicates the number of licensed users that are currently connected, and if the Security Management Server is active or not. The Log Server includes elaborate details about the named connected client, the name of the administrator, managing the selected Log Server, the host of the Log Server, and the name of the database if it is locked. The Log Server indicates the type of application that the Log Server can track.
SmartView Monitor reads statuses from the SmartEvent Correlation Unit and SmartEvent Server.
SmartEvent Correlation Unit status examples:
SmartEvent Server status examples:
Connect the SmartEvent Correlation Unit to the Log Server or the Log Server to let it read logs. Connect it to the SmartEvent Server to send events to it. If problems occur in the SmartEvent Correlation Unit connection to other components (for example, SIC problems) the problems are reported in the SmartEvent Correlation Unit status.
For the same reasons, the SmartEvent Server contains statuses that provide information about connections to all SmartEvent Correlation Units.
SmartView Monitor can now provide statuses and counters for gateways with Anti-Virus and URL Filtering.
The statuses are divided into these categories:
Anti-Virus statuses are associated with signature checks and URL Filtering statuses are associated with URLs and categories.
In addition, SmartView Monitor can now run Anti-Virus and URL Filtering counters.
For example:
SmartView Monitor can be used to monitor Multi-Domain Servers. This information can be viewed in the Gateway Status view. In this view you can see Multi-Domain Security Management counter information (for example, CPU or Overall Status).
Description Displays the status of Check Point applications, either on the local server or on another appliance or server, in various formats.
Syntax:
> cpstat [-h <host>][-p <port>][-s <SICname>][-f <flavor>][-o <polling>][-c <count>][-e <period>][-d] <application_flag>
Parameter |
Description |
|---|---|
|
A resolvable hostname, an IPv4 address, or a DAIP object name. The default is |
|
Port number of the AMON server. The default is the standard AMON port 18192. |
|
Secure Internal Communication (SIC) name of the AMON server. |
|
The flavor of the output as it appears in the configuration file. The default is the first flavor found in the configuration file. |
|
Polling interval in seconds, specifies the pace of the results. The default is 0. The results are shown only once. |
|
Specifies how many times the results are shown. The default is 0. The results are repeatedly shown. |
|
Specifies the interval in seconds, over which 'statistical' olds are computed. Ignored for regular olds. |
|
Debug Mode. |
|
One of the following:
|
The following parameters (flavours) can be added to the application flags:
-------------------------------------------------------------- |Flag |Flavours | -------------------------------------------------------------- |os |default, ifconfig, routing, routing6, | | |memory, old_memory, cpu, disk, perf, | | |multi_cpu, multi_disk, raidInfo, sensors, | | |power_supply, hw_info, all, average_cpu, | | |average_memory, statistics, updates, | | |licensing, connectivity, vsx | -------------------------------------------------------------- |persistency |product, TableConfig, SourceConfig | -------------------------------------------------------------- |thresholds |default, active_thresholds, destinations, | | |error | -------------------------------------------------------------- |ci |default | -------------------------------------------------------------- |https_inspection |default,all | -------------------------------------------------------------- |cvpn |cvpnd, sysinfo, products, overall | -------------------------------------------------------------- |fw |default, interfaces, policy, perf, hmem, | | |kmem, inspect, cookies, chains, | | |fragments, totals, totals64, ufp, http, | | |ftp, telnet, rlogin, smtp, pop3, sync, | | |log_connection, all | -------------------------------------------------------------- |vsx |default, stat, traffic, conns, cpu, all, | | |memory, cpu_usage_per_core | -------------------------------------------------------------- |vpn |default, product, IKE, ipsec, traffic, | | |compression, accelerator, nic, | | |statistics, watermarks, all | -------------------------------------------------------------- |blades |fw, ips, av, urlf, vpn, cvpn, aspm, dlp, | | |appi, anti_bot, default, | | |content_awareness, threat-emulation, | | |default | -------------------------------------------------------------- |identityServer |default, authentication, logins, ldap, | | |components, adquery | -------------------------------------------------------------- |appi |default, subscription_status, | | |update_status, RAD_status, top_last_hour, | | |top_last_day, top_last_week, | | |top_last_month | -------------------------------------------------------------- |urlf |default, subscription_status, | | |update_status, RAD_status, top_last_hour, | | |top_last_day, top_last_week, | | |top_last_month | -------------------------------------------------------------- |dlp |default, dlp, exchange_agents, fingerprint| -------------------------------------------------------------- |ctnt |default | -------------------------------------------------------------- |antimalware |default, scanned_hosts, scanned_mails, | | |subscription_status, update_status, | | |ab_prm_contracts, av_prm_contracts, | | |ab_prm_contracts, av_prm_contracts | -------------------------------------------------------------- |threat-emulation |default, general_statuses, update_status, | | |scanned_files, malware_detected, | | |scanned_on_cloud, malware_on_cloud, | | |average_process_time, emulated_file_size, | | |queue_size, peak_size, | | |file_type_stat_file_scanned, | | |file_type_stat_malware_detected, | | |file_type_stat_cloud_scanned, | | |file_type_stat_cloud_malware_scanned, | | |file_type_stat_filter_by_analysis, | | |file_type_stat_cache_hit_rate, | | |file_type_stat_error_count, | | |file_type_stat_no_resource_count, | | |contract, downloads_information_current, | | |downloading_file_information, | | |queue_table, history_te_incidents, | | |history_te_comp_hosts | -------------------------------------------------------------- |scrub |default, subscription_status, | | |threat_extraction_statistics | -------------------------------------------------------------- |gx |default, contxt_create_info, | | |contxt_delete_info, contxt_update_info, | | |contxt_path_mng_info, GXSA_GPDU_info, | | |contxt_initiate_info, gtpv2_create_info, | | |gtpv2_delete_info, gtpv2_update_info, | | |gtpv2_path_mng_info, gtpv2_cmd_info, all | -------------------------------------------------------------- |fg |all | -------------------------------------------------------------- |ha |default, -------------------------------------------------------------- |asm | -------------------------------------------------------------- |polsrv |default, all | -------------------------------------------------------------- |ca |default, -------------------------------------------------------------- |mg |default | -------------------------------------------------------------- |svr |default | -------------------------------------------------------------- |cpsemd |default | -------------------------------------------------------------- |cpsead |default | -------------------------------------------------------------- |ls |default | -------------------------------------------------------------- |uas |default | -------------------------------------------------------------- |PA |default | -------------------------------------------------------------- |
Example:
[Expert@MyVSX_GW:0]# cpstat -f default fw
Policy name: MyVSX_GW_VSX Install time: Wed May 23 18:14:32 2018
Interface table --------------------------------------- |Name|Dir|Total |Accept|Deny |Log| --------------------------------------- |eth0|in | 2393126| 32589| 2360537| 52| |eth0|out| 33016| 33016| 0| 0| |eth1|in | 2360350| 0| 2360350| 0| |eth1|out| 0| 0| 0| 0| |eth2|in | 2360350| 0| 2360350| 0| |eth2|out| 0| 0| 0| 0| |eth3|in | 2348704| 0| 2348704| 1| |eth3|out| 0| 0| 0| 0| |eth4|in | 2360350| 0| 2360350| 0| |eth4|out| 0| 0| 0| 0| --------------------------------------- | | |11855896| 65605|11790291| 53| ---------------------------------------
... ... [truncated for brevity] ... ...
[Expert@MyVSX_GW:0]# |
To stop and start one member of a cluster from SmartView Monitor:
VPN Tunnels are secure links between Security Gateways. These Tunnels ensure secure connections between gateways of an organization and remote access clients.
When Tunnels are created and put to use, you can keep track of their normal function, so that possible malfunctions and connectivity problems can be accessed and solved as soon as possible.
To ensure this security level, SmartView Monitor constantly monitor and analyze the status of an organization's Tunnels to recognize malfunctions and connectivity problems. With the use of Tunnel views, you can generate fully detailed reports that include information about the Tunnels that fulfill the specific Tunnel views conditions. With this information you can monitor Tunnel status, the Community with which a Tunnel is associated, the gateways to which the Tunnel is connected, and so on. These are the Tunnel types:
Permanent tunnels are constantly monitored. Therefore, each VPN tunnel in the community can be set as a Permanent tunnel. A log, alert or user defined action can be issued when the VPN tunnel is down.
Permanent tunnels can only be established between Check Point gateways. The configuration of Permanent tunnels takes place on the community level and:
This table shows the possible Tunnel states and their significance to a Permanent or Regular Tunnel.
State |
Permanent Tunnel |
Regular Tunnel |
|---|---|---|
Up |
The tunnel works and the data can flow with no problems. |
IDE SA (Phase 1) and IPSEC SA (Phase 2) exist with a peer gateway. |
Destroyed |
The tunnel is destroyed. |
The tunnel is destroyed. |
Up Phase1 |
Irrelevant |
Tunnel initialization is in process and Phase 1 is complete (that is, IKE SA exists with cookies), but there is no Phase 2. |
Down |
There is a tunnel failure. You cannot send and receive data to or from a remote peer. |
Irrelevant. |
Up Init |
The tunnel is initialized. |
Irrelevant. |
Gateway not Responding |
The gateway is not responding. |
The gateway is not responding. |
If a Tunnel is deleted from SmartConsole, the Tunnel Results View shows the deleted Tunnel for an hour after it was deleted.
If a community is edited, the Results View shows removed tunnels for an hour after they were removed from the community.
When a Tunnel view runs the results show in the SmartView Monitor client. A Tunnel view can run:
A Tunnels view can be created and run for:
Down Tunnel view results list all the Tunnels that are currently not active.
To run a down tunnel view:
A list of all the Down Tunnels associated with the selected view properties shows.
Permanent Tunnel view results list all of the existing Permanent Tunnels and their current status.
A Permanent Tunnel is a Tunnel that is constantly kept active.
To run a permanent tunnel view:
A list of the Permanent Tunnels related to the selected view properties shows.
Tunnels on Community view results list all the Tunnels related to a selected Community.
To run a tunnels on community view:
A list of all Communities shows.
A list of all the Tunnels related to the selected Community shows.
Tunnels on Gateways view results list all of the Tunnels related to a selected Gateway.
To run tunnels on Gateway view:
A list of the gateways shows.
A list of the Tunnels related to the selected gateway shows.
SmartView Monitor provides tools that enable you to know traffic related to specified network activities, server, and so on, and the status of activities, hardware and software use of different Check Point products in real-time. With this knowledge you can:
SmartView Monitor delivers a comprehensive solution to monitor and analyze network traffic and network usage. You can generate fully detailed or summarized graphs and charts for all connections intercepted and logged when you monitor traffic, and for numerous rates and figures when you count usage throughout the network.
Traffic Monitoring provides in-depth details on network traffic and activity. As a network administrator you can generate traffic information to:
Network traffic patterns help administrators determine which services demand the most network resources.
Monitoring traffic can provide information on how the use of network resources is divided among corporate users and departments. Reports that summarize customer use of services, bandwidth and time can provide a basis to estimate costs for each user or department.
A Traffic view can be created to monitor the Traffic types listed in the following table.
Traffic Type |
Explanation |
|---|---|
Services |
Shows the current status view about Services used through the selected gateway. |
IPs/Network Objects |
Shows the current status view about active IPs/Network Objects through the selected gateway. |
Security Rules |
Shows the current status view about the most frequently used Firewall rules. The Name column in the legend states the rule number as previously configured in SmartConsole. |
Interfaces |
Shows the current status view about the Interfaces associated with the selected gateway. |
Connections |
Shows the current status view about current connections initiated through the selected gateway. |
Tunnels |
Shows the current status view about the Tunnels associated with the selected gateway and their usage. |
Virtual Link |
Shows the current traffic status view between two gateways (for example, Bandwidth, Bandwidth Loss, and Round Trip Time). |
Packet Size Distribution |
Shows the current status view about packets according to the size of the packets. |
QoS |
Shows the current traffic level for each QoS rule. |
The values that you see in the legend depend on the Traffic view that you run.
All units in the view results show in configurable Intervals.
Monitoring System Counters provides in-depth details about Check Point Software Blade usage and activities. As a network administrator you can generate system status information about:
When a Traffic or System Counters view runs, the results show in the SmartView Monitor client. A Traffic or System Counter view can run:
To run a Traffic or System Counters view:
A list of available gateways shows.
The results of the selected view show in the SmartView Monitor client.
You can save a record of the Traffic or System Counter view results.
To record a traffic or counter view:
A Save As window shows.
The word Recording shows below the Traffic or Counter toolbar. The appearance of this word signifies that the view currently running is recorded and saved.
A record of the view results is saved in the directory you selected in step 3 above.
After you record a view, you can play it back. You can select Play or Fast Play, to see results change faster.
To play the results:
The Select Recorded File window shows.
The results of the selected recorded view start to run. The word Playing shows below the toolbar.
The User Monitor is an administrative feature. This feature lets you to keep track of Endpoint Security VPN users currently logged on to the specific Security Management Servers. The User Monitor provides you with a comprehensive set of filters which makes the view definition process user-friendly and highly efficient. It lets you to easily navigate through the obtained results.
With data on current open sessions, overlapping sessions, route traffic, connection time, and more, the User Monitor gives detailed information about connectivity experience of remote users. This SmartView Monitor feature lets you view real-time statistics about open remote access sessions.
If specific data are irrelevant for a given User, the column shows N/A for the User.
When you run a Users view, the results show in the SmartView Monitor client:
A Users view can be created and run for:
To run a user view for a specified user:
The User DN Filter window opens.
The view results show in the Results View.
To run a user view for all users or Mobile Access users:
The view results show in the Results View.
To run a user view for a specified Gateway:
The Select Gateway window shows.
The view results show in the Results View.
Cooperative Enforcement works with Check Point Endpoint Security Management Servers. This feature utilizes the Endpoint Security Management Server compliance function to make sure connections that come from different hosts across the internal network.
Endpoint Security Management Server is a centrally managed, multi-layered endpoint security solution that employs policy based security enforcement for internal and remote PCs. The Endpoint Security Management Server mitigates the risk of hackers, worms, spyware, and other security threats.
Features such as policy templates and application privilege controls enable administrators to easily develop, manage, and enforce Cooperative Enforcement.
With Cooperative Enforcement, a host that initiates a connection through a gateway is tested for compliance. This increases the integrity of the network because it prevents hosts with malicious software components to access the network.
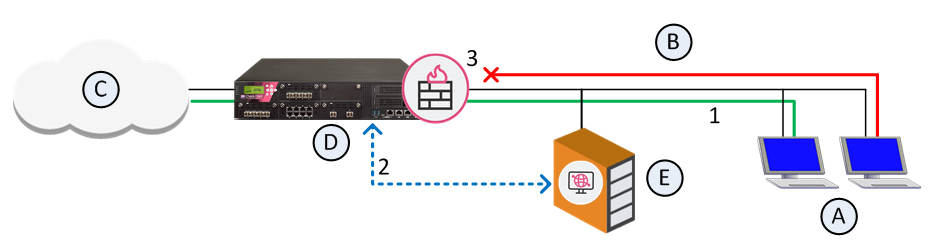
Cooperative Enforcement acts as a middle-man between hosts managed by an Endpoint Security Management Server and the Endpoint Security Management Server itself. It relies on the Endpoint Security Management Server compliance feature. It defines if a host is secure and can block connections that do not meet the defined prerequisites of software components.
|
Unauthorized |
|
|
Authorized |
|
If the client is non-compliant and Cooperative Enforcement is not in Monitor-only mode, the connection is closed.
Cooperative Enforcement is not supported by all the NAT configurations.
For Cooperative Enforcement to work in a NAT environment, the gateway and the Endpoint Security Server must recognize the same IP address of a client. If NAT causes the IP address received by gateway to be different than the IP address received by the Endpoint Security Server, Cooperative Enforcement will not work.
To configure Cooperative Enforcement:
From the gateway Cooperative Enforcement page, click Authorize clients using Endpoint Security Server to enable Cooperative Enforcement.
If Monitor Only is not selected, Cooperative Enforcement works in Enforcement mode. The Endpoint Security Firewall blocks non-compliant host connections. For HTTP connections, the client is notified that its host is non-compliant. The user can change the computer to make compliant. For example, the user can upgrade the version of the Endpoint Security client.
The Non-Compliant Hosts by Gateway view lets you to see Host IPs by Endpoint Security Management Server compliance:

