Introducing SmartView Monitor
Corporate networks in today's dynamic business environment are often comprised of many networks and gateways that support a diverse set of products and user needs. The challenge of managing an increasing array of system traffic can put enormous pressure on IT staffing capacity and network resources. With SmartView Monitor, Check Point offers you a cost effective solution to obtain a complete picture of network and security performance; and to respond quickly and efficiently to changes in gateways, tunnels, remote users and traffic flow patterns or security activities.
SmartView Monitor is a high-performance network and security analysis system that helps you easily administer your network by establishing work habits based on learned system resource patterns. Based on Check Point Security Management Architecture, SmartView Monitor provides a single, central interface for monitoring network activity and performance of Check Point Software Blades.
SmartView Monitor Features
SmartView Monitor allows administrators to easily configure and monitor different aspects of network activities. Graphical views can easily be viewed from an integrated, intuitive interface.
Pre-defined views include the most frequently used traffic, counter, tunnel, gateway, and remote user information. For example, Check Point System Counters collect information on the status and activities of Check Point products (for example, VPN or NAT). Using custom or pre-defined views, administrators can drill down on the status of a specific gateway and/or a segment of traffic to identify top bandwidth hosts that may be affecting network performance. If suspicious activity is detected, administrators can immediately apply a Firewall rule to the appropriate Security Gateway to block that activity. These Firewall rules can be created dynamically via the graphical interface and be set to expire within a certain time period.
Real-time and historical graphical reports of monitored events can be generated to provide a comprehensive view of gateways, tunnels, remote users, network, security, and performance over time.
Examples of scenarios for which SmartView Monitor can help:
- If a company's Internet access is slow, a Traffic view and report can be created to ascertain what may be clogging up the company's gateway interface. The view can be based on a review of, for example, specific Services, Firewall rules or Network Objects, that may be known to impede the flow of Internet traffic. If the SmartView Monitor Traffic view indicates that users are aggressively using such Services or Network Objects (for example, Peer to Peer application or HTTP), the cause of the slow Internet access has been determined. If aggressive use is not the cause, the network administrator will have to look at other avenues (for instance, performance degradation may be the result of memory overload).
- If employees who are working away from the office cannot connect to the network a Counter view and report can be created to determine what may be prohibiting network connections. The view can be based on, for example, CPU Usage %, Total Physical Memory or VPN Tunnels, to collect information about the status, activities hardware and software usage of different Check Point products in real-time. If the SmartView Monitor Counter view indicates that there are more failures than successes, it is possible that the company cannot accommodate the mass number of employees attempting to log on at once.
Immediate Actions
If the status shows an issue, you can act on that network object.
For example:
Understanding the User Interface
The results you see in the SmartView Monitor SmartConsole depend on the view you select.
Gateway Status View
This view shows data about supported hosts.
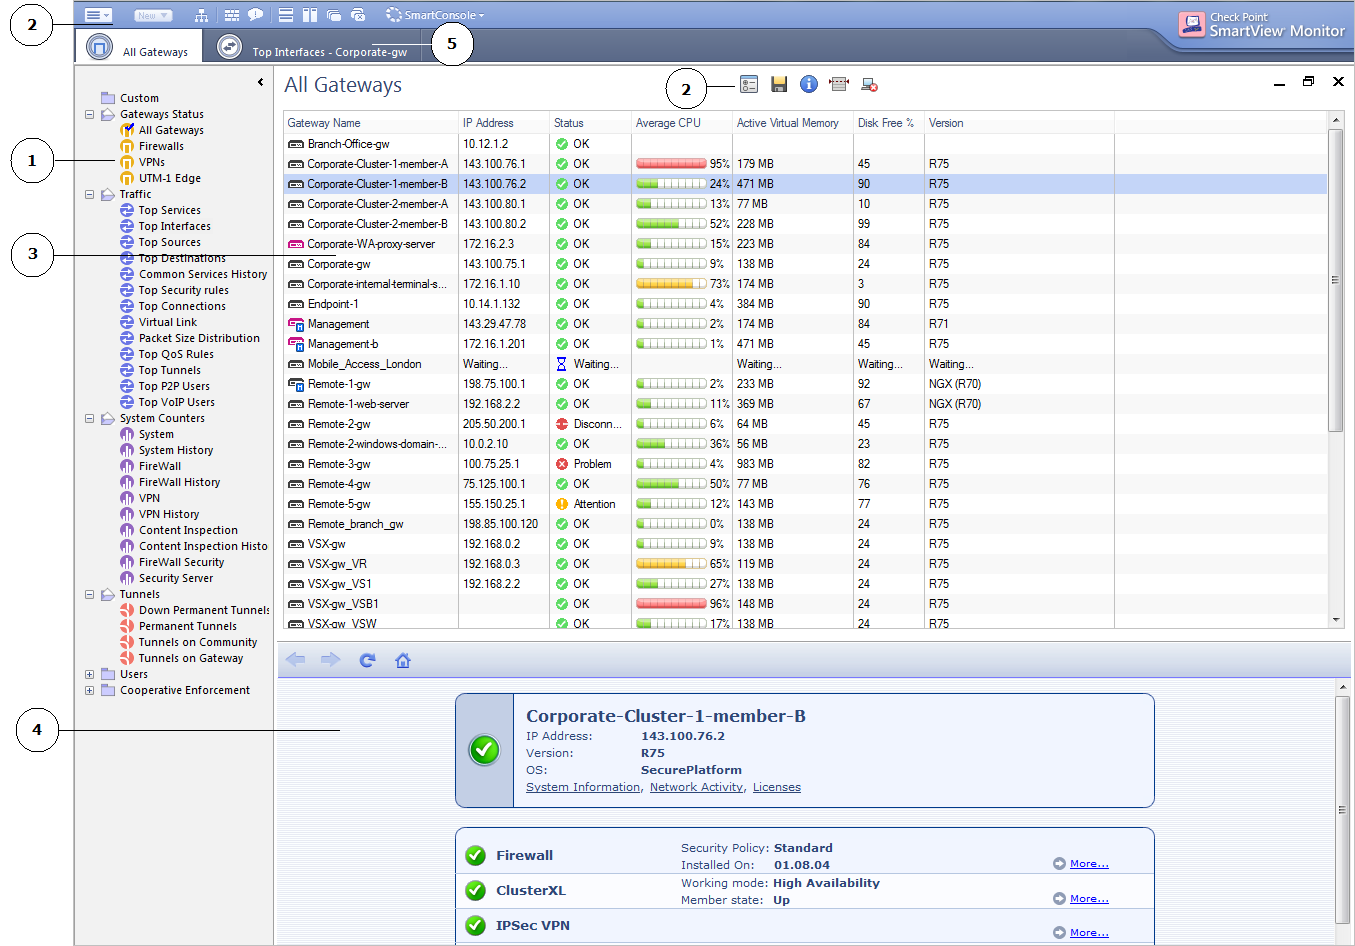
- Tree - Shows all the views.
- Toolbars - Shortcuts of SmartView Monitor options.
- Results - Data for all the gateways in the organization, and details for the selected gateway, linked to the view selected in the Tree. Each row in the table represents a Gateway.
- Gateway Details - HTML view that behaves like a browser and allows the user to hit links associated data about the selected gateway.
- There are tabs for every view that is currently running in SmartView Monitor. As the number of running views grows, they are added to a tab, from which you can select a view.
Traffic View
This view shows transaction data for network sessions in a given time interval.
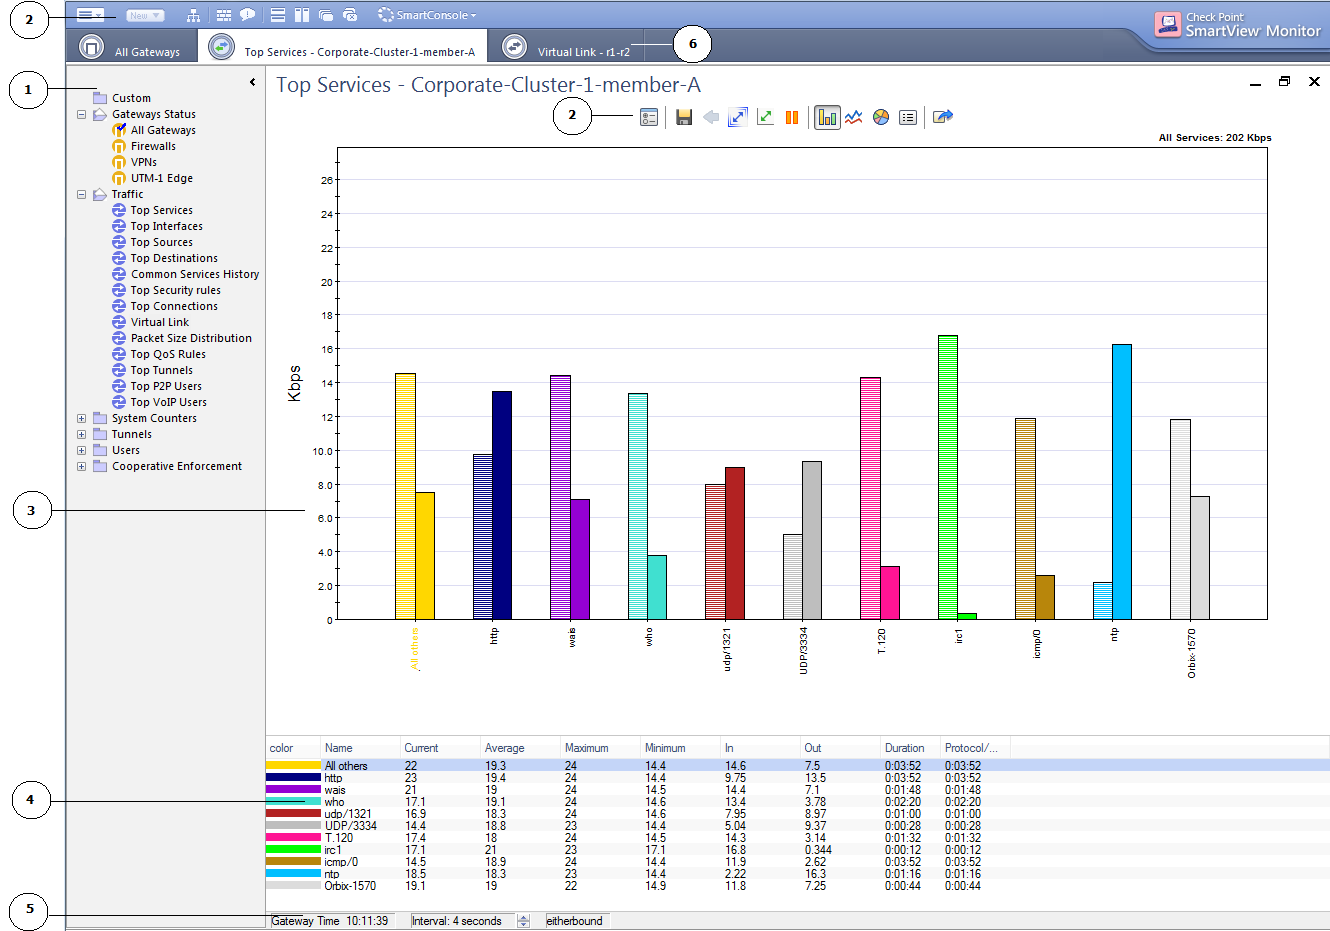
- Tree - Shows all the views.
- Toolbars - Shortcuts of SmartView Monitor options.
- Results - Data for the selected view and property.
- Legend - Textual report of the results.
- Status Bar - (Bottom of the SmartConsole) System data for the gateway associated with the selected view.
- There are tabs for every view that is currently running in SmartView Monitor. As the number of running views grows, they are added to a tab, from which you can select a view.
System Counters View
This view shows reports on status, activities, and resource usage of Check Point products, in real-time or history mode.
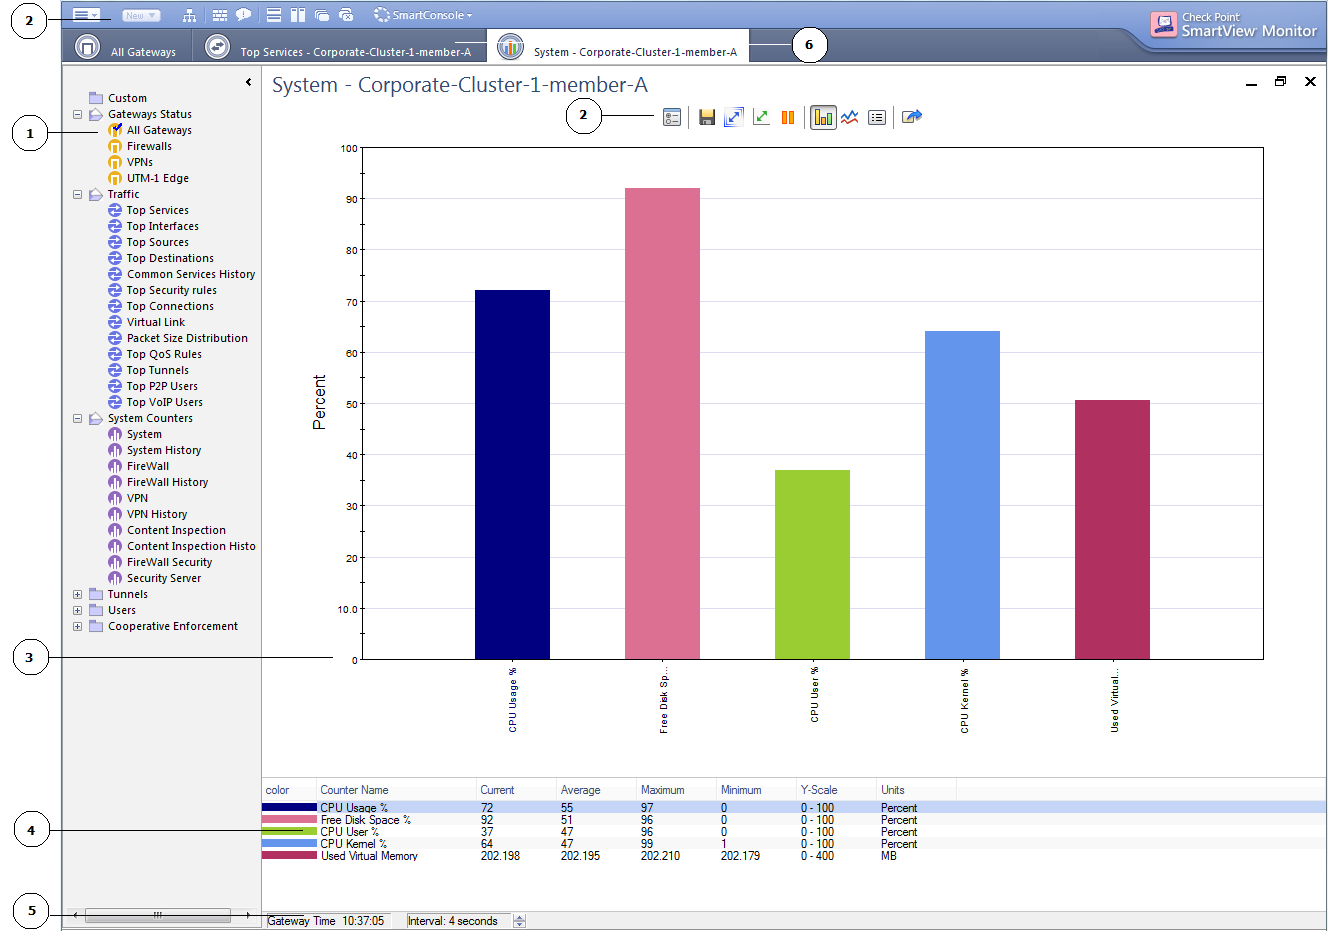
- Tree - Shows all the views.
- Toolbars - Shortcuts of SmartView Monitor options.
- Results - Data for the selected view and property.
- Legend - Textual report of the results.
- Status Bar - (Bottom of the SmartConsole) System data for the gateway associated with the selected view.
- There are tabs for every view that is currently running in SmartView Monitor. As the number of running views grows they are added to a tab from which you can select a view.
Tunnels View
This view shows data on connections of site-to-site VPNs.
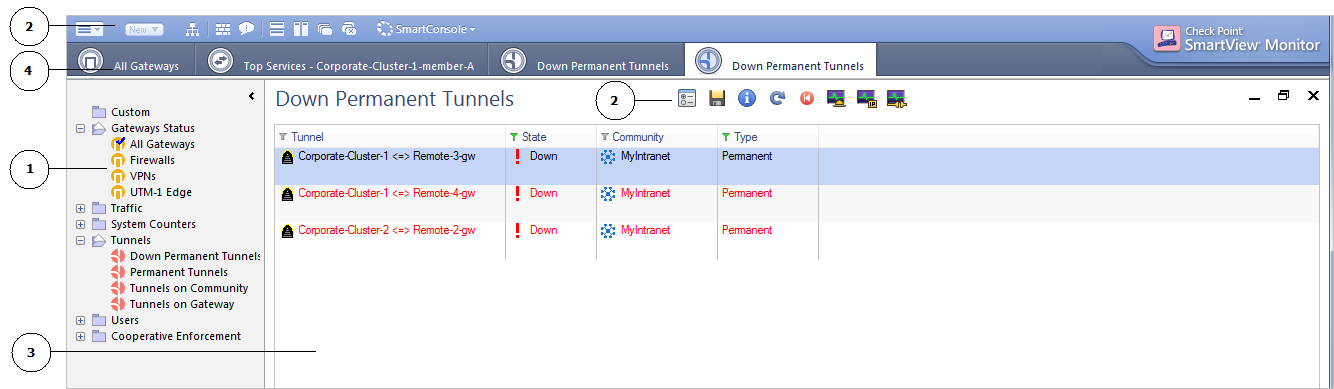
- Tree - Shows all the views.
- Toolbars - Shortcuts of SmartView Monitor options.
- Results - Data for the selected view and object.
- There are tabs for every view that is currently running in SmartView Monitor. As the number of running views grows they are added to a tab from which you can select a view.
Users View
This view shows data on remote access users and their connections to VPNs.
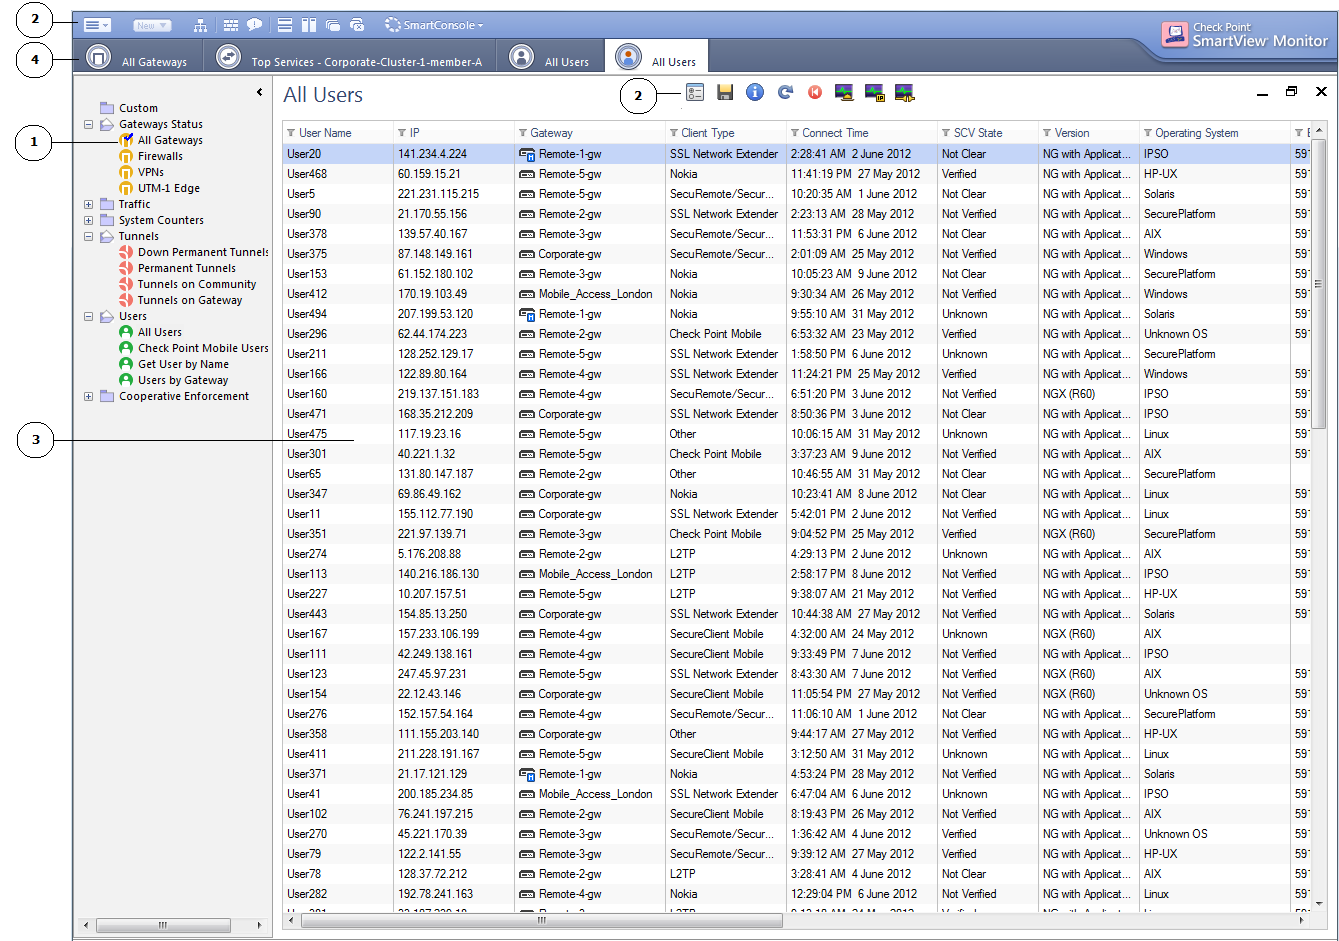
- Tree - Shows all the views.
- Toolbars - Shortcuts of SmartView Monitor options.
- Results - Data for the selected view and object.
- There are tabs for every view that is currently running in SmartView Monitor. As the number of running views grows they are added to a tab from which you can select a view.
Cooperative Enforcement View
This view shows data on internal hosts.
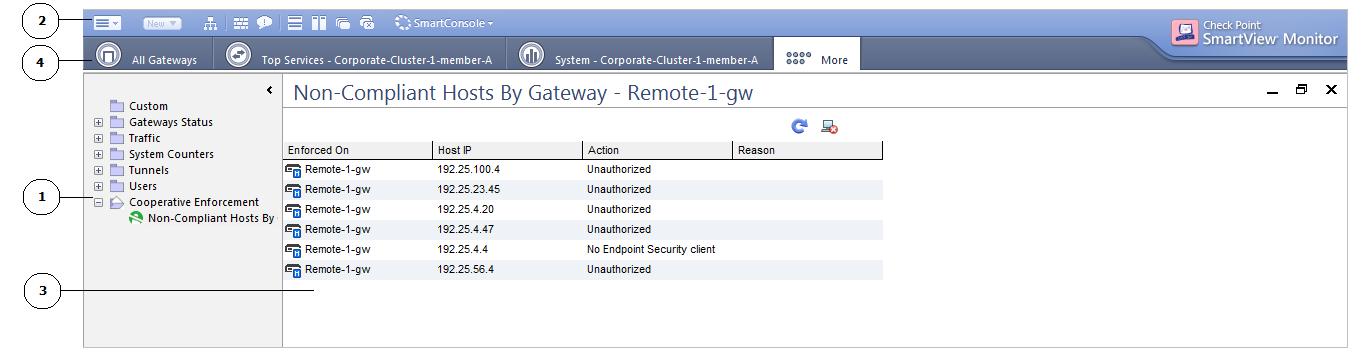
- Tree - Shows all the views.
- Toolbars - Shortcuts of SmartView Monitor options.
- Results - Data for the selected view and object.
- There are tabs for every view that is currently running in SmartView Monitor. As the number of running views grows they are added to a tab from which you can select a view.
Setting Your Default View
You can set which view to see when SmartView Monitor starts.
In the Tree, right-click the view and select Run at Startup.
Refreshing Views
Results are automatically refreshed every 60 seconds.
To refresh the view earlier, right-click the view name in the and select .
To refresh data about an object in the currently running view, right-click the object in the results and select .
|
|
