Introduction
SmartLog reads and indexes logs generated by Check Point and OPSEC products. You can use this data to:
- Detect and monitor security-related events. For example, alerts, rejected connections, and failed authentication attempts can indicate intrusion attempts.
- Collect data on problematic issues. For example, a client is authorized to create a connection, but cannot connect. SmartLog shows that the Rule Base incorrectly blocks the client connection attempts.
- Analyze network traffic patterns. For example, find out how many HTTP services were used during peak activity.
What sets SmartLog apart from other log utilities is its power, ease of use, and speed. The SmartLog Index Server gets log files from many log servers and indexes them for rapid data extraction. SmartLog includes a powerful query language that lets you create your own queries in minutes.
SmartLog is part of the R77 SmartConsole installation.
Enabling Logging on a Security Management Server or Domain Log Server
You must enable Logging & Status Software Blade on the Security Management Server and on all Log Server.
To enable logging on a Security Management Server or Log Server:
- Open SmartConsole.
- In the view, double-click the Security Management Server or Log Server.
The window opens.
- In the tab, select .
- From the navigation tree, click .
This shows the Security Gateways that forward logs to this machine.
- Make sure that is selected.
It is enabled by default. If you clear this option, it will take much more time to search the logs.
- Click .
- Click .
Starting and Stopping the SmartLog Index Server
When you activate the SmartLog Index Server, it continuously indexes logs on management and log servers. To stop the SmartLog Index Server, run smartlogstop from the command line. To restart the SmartLog Index Server, run smartlogstart from the command line.
Activating SmartLog on Multi-Domain Security Management
SmartLog in a Multi-Domain Security Management environment works on the Multi-Domain Server. This server is used to query results from the Domain Management Servers and Multi-Domain Log Servers.
SmartLog on the Multi-Domain Server is active by default. Each Domain Management Server and Multi-Domain Log Server can be activated separately.
To activate SmartLog on the Multi-Domain Security Management:
- Open the SmartDomain Manager > .
- Right-click the Domain Management Server and select > .
- In the properties of the Domain Management Server object > , select .
Do this also for the Multi-Domain Log Servers objects.
- Click and then .
- In the SmartDomain Manager > , double-click the Multi-Domain Server object.
- Select .
- Click .
- Start the SmartLog console.
SmartLog can be used to access the Domain Management Servers or Multi-Domain Log Servers directly, or through the Multi-Domain Server.
When you connect through the Multi-Domain Server, on the left pane, SmartLog shows the Domain Management Servers and Multi-Domain Log Servers that you can select as query targets. The results are a collection of logs from the selected Domain Management Servers and Multi-Domain Log Servers (that match the query).
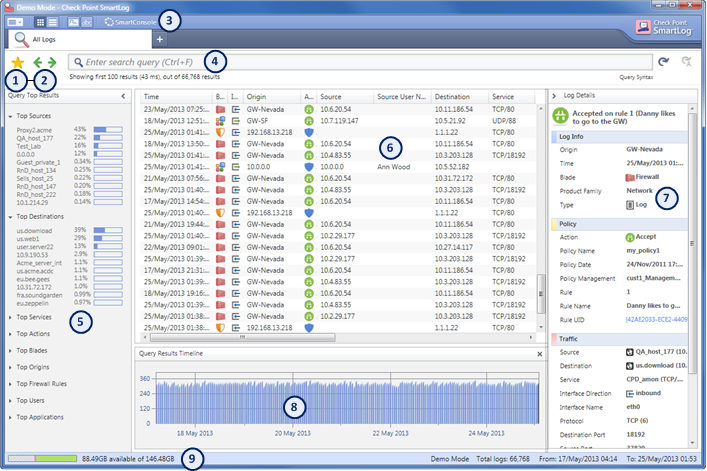
SmartLog User Interface
Item
|
Description
|
1
|
- Shows list of predefined queries. Select a query in this list to run it.
|
2
|
- Scroll backward and forward between recent queries.
|
3
|
- Lets you select the grid or table view for the Log pane. You can also show IP addresses and ports as numbers or their resolved names.
|
4
|
- Shows the query definition for the most recent query. You also define custom queries in this field using the GUI tools or manually entering query criteria.
|
5
|
- Shows the top results of the most recent query.
|
6
|
- Shows the log entries for the most recent query.
|
7
|
- Shows the detailed contents of the most recently selected log record.
|
8
|
- Shows a chart of the current query results over time.
|
9
|
- Bar graph that shows used and available disk space in the /var/log partition. Put the cursor over the indicator to see how much space is used by log files and other data.
|
Toolbar Icons

|
- Opens the menu.
|

|
view - Detailed tabular view. You can select the fields to show and change the order and width of the columns.
|

|
view - Summary view that shows basic information. This view is suitable for small windows, but cannot be customized.
|

|
- Hides the source user name in the pane,
|

|
- Resolves IP addresses and services to their names, if possible.
|

|
- Open SmartConsole clients.
|
Working with More than One Log Server
You can include log records from more than one Log Server in your SmartLog queries. The Log Servers must all be managed by the same Security Management Server. SmartLog automatically indexes logs on all Log Servers. The and pane are not available when working with more than one Log Server.
To see logs from more than one Log Server:
- Select .
- R77 and R77.10: In the n window, select , and click .
R77.20 and higher: Select .
- On the pane (on the left), select the log servers to include in your queries. By default, all servers are selected.
If you have many log servers with large log files, it may take a long time to index the servers. Please be patient. The Top Results pane does not show.
To see logs from only the connected Log Server:
- Select .
- R77 and R77.10: In the n window, select ,and click .
R77.20 and higher: Select .
The Top Results pane shows in the user interface.
To see logs from more than one Domain Log Server:
In a Multi-Domain Security Management environment, the SmartLog queries include log records from all the Domain Log Servers that are managed by the same Multi-Domain Server.
Minimum Disk Space
SmartLog creates and uses index files for fast access to log file contents. The index files are located by default at $SMARTLOGDIR/data.
To make sure that there is always sufficient disk space on the server, SmartLog deletes the oldest index entries when the available disk space is less than a specified minimum. The default minimum value is 10,240 MB.
To change the minimum available disk space value:
- On the SmartLog index server command line, go to
$SMARTLOGDIR. - Open
smartlog_settings.txt in a text editor. - Add this line to the section:
:min_disk_space (space), where space = the minimum available disk space in MB.
The default value is 10240 MB, which is in effect when there is no :min_disk_space line in the smartlog_settings.txt file. A smaller number will let the index file contain more entries before it automatically deletes the oldest records.
Managing the Event Database
SmartLog uses an optimization algorithm to manage disk space and other system resources. When the SmartLog database becomes too large, the oldest events are automatically deleted to save space. Also, events that are more than one year old are automatically deleted.
For instructions to change maximum period and maximum database size to save past events in SmartEvent database, see sk73640.
|

