

In This Section: |
SNMP management tools are used to monitor the activity of various devices on the network. Because system administrators prefer to work with familiar tools, they might be more comfortable getting status information for Check Point products with their regular SNMP Network Management Station (NMS).
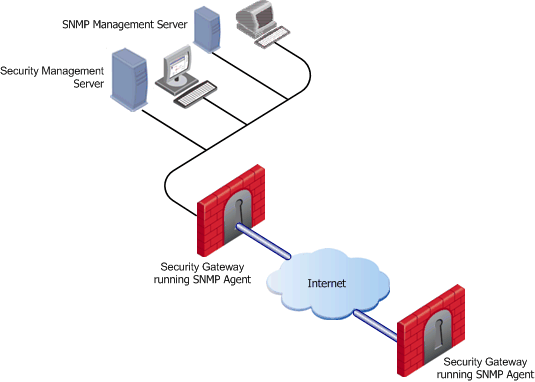
Check Point addresses this issue by running SNMP agents on Security Gateways. These Security Gateways need to respond to requests from an SNMP Management Station.

In the standard client-server relationship, the network SNMP Management Station is the client and the SNMP agent within the Check Point product acts as the server.
SNMP management systems consist of an SNMP management station and the managed devices, such as bridges, routers, or network servers. SNMP agents constitute the software elements that interface with the device being managed. The agents relate to the configuration and performance characteristics of a managed device as separate identifiable objects. These objects are arranged in an hierarchical namespace, a tree-like database structure known as a Management Information Block, or MIB. Check Point has a registered MIB sub-tree with the Internet Assigned Numbers Authority (IANA). The MIB:
|
Note - The SNMP management station can read but not modify the object definitions for Check Point products. |
When the Security Management server is installed, a special Check Point dynamic link library (DLL) is listed in the Windows registry. The SNMP service running on the Operating System loads this DLL. The SNMP service listens in the standard way on port 161 for incoming SNMP requests from the SNMP Network Management Station. The Check Point DLL extends the Windows SNMP service to identify those status requests directed at Check Point products. The relevant data is then retrieved by the DLL and sent to the SNMP management station.
|
Note - The Check Point SNMP agent is an extension of the Windows SNMP agent. If you have not installed the standard Windows SNMP agent, you cannot use the Check Point SNMP agent. |
For the Unix platform, a special Check Point SNMP daemon, called cpsnmpd, is installed. This daemon provides status information on Check Point specific objects. This daemon is not run by default. The daemon is enabled or disabled through cpconfig. Once enabled, the daemon runs with other Check Point processes. The SNMP Network Management Station queries the daemon for status information. The daemon retrieves the information, and replies.
|
Note - While the Check Point daemon is SNMP compliant, the daemon listens on port 260 instead of 161. The standard Unix SNMP daemon loads before the Check Point daemon and binds to port 161. If the regular daemon is not running, |
SNMP support is fully integrated in SecurePlatform:
For additional information about SNMP and SecurePlatform refer to the SNMP Support section in the R77 SecurePlatform Administration Guide.
While Check Point has Alert as one of its tracking types, you might prefer to receive alert messages through your regular SNMP Management Station in the form of an SNMP trap. An SNMP trap is notification that a certain event has occurred. Check Point offers SNMP traps as one of its tracking types. When the conditions of the trap are met, the gateway sends a log to Security Management. Security Management saves the log and sends (via port 162) an SNMP trap to the configured catcher—the SNMP Network Management station. The trap includes the text of the log file.
For example, if any machine outside of the organization tries to make an http connection to a machine within the internal network, the packet is dropped and an SNMP trap is sent:
Source |
Destination |
VPN |
Service |
Action |
Track |
|---|---|---|---|---|---|
Any |
Internal_private_network |
Any |
HTTP |
Drop |
SnmpTrap |
The Check Point MIB file describes the SNMP traps that are used by Security Management. The MIB file is located in:
%CPDIR%\lib\snmp\chkpnt-trap.mib$CPDIR/lib/snmp/chkpnt-trap.mibIf you need to run the standard Unix SNMP daemon on port 161, run this daemon before you start cpsnmpd, otherwise cpsnmpd will take the port.
To handle SNMP requests and traps, the various supported platforms need to be configured in slightly different ways.
$CPDIR/lib/snmp/chkpnt.mib.cpconfig to enable the cpsnmpd daemon.Do this only on the Security Gateways through which the SNMP packets need to pass.
Source |
Destination |
If Via |
Service |
Action |
|---|---|---|---|---|
SNMP_Management_Station |
Firewall_Modules |
Any |
snmp |
accept |
This policy rule allows the SNMP Management Station to communicate with the Security Gateways.
To configure Security Gateways for SNMP traps, the built-in trap script has to be assigned an appropriate catcher.
To assign an appropriate catcher:

You can configure a variety of different SNMP thresholds that generate SNMP traps, or alerts. You can use these thresholds to monitor many system components automatically without requesting information from each object or device. The categories of thresholds that you can configure include:
Some categories apply only to some machines or deployments.
|
Note - SNMP monitoring thresholds are supported from R75.20, R71.30, and higher. |
In each category there are many individual thresholds that you can set. For example, the hardware category includes alerts for the state of the RAID disk, the state of the temperature sensor, the state of the fan speed sensor, and others. For each individual threshold, you can configure:
You can also configure some settings globally, such as how often alerts are send and where they are sent to.
Configure the SNMP monitoring thresholds in the command line of the Security Management server. When you install the policy on the gateways the SNMP monitoring thresholds are applied globally to all gateways.
Configuring in Multi-Domain Security Management
In a Multi-Domain Security Management environment, you can configure thresholds on the Multi-Domain Server and on each individual Domain Management Server. Thresholds that you configure on the Multi-Domain Server are for the Multi-Domain Server only. Thresholds that you configure for a Domain Management Server are for that Domain Management Server and its gateways. If a threshold applies to the Multi-Domain Server and the Domain Management Server gateways, set it on the Multi-Domain Server and Domain Management Server. But in this situation you can only get alerts from the Multi-Domain Server if the threshold passed.
For example, because the Multi-Domain Server and Domain Management Server are on the same machine, if the CPU threshold is passed, it applies to both of them. But only the Multi-Domain Server generates alerts.
You can see the Multi-Domain Security Management level for each threshold with the threshold_config utility.
Configuring a Local Gateway Policy
You can configure SNMP thresholds locally on a gateway with the same procedure that you do on a Security Management server. But each time you install a policy on the gateway, the local settings are erased and it reverts to the global SNMP threshold settings.
You can use the threshold_config utility to save the configuration file and load it again later.
On SecurePlatform and Linux, the configuration file that you can back up is: $FWDIR/conf/thresholds.conf
On Windows, the configuration file that you can back up is: %FWDIR%\conf\thresholds.conf
You can complete threshold configuration and activate the settings.
To complete configuration and activate the settings:
cpwd_admin utility to restart the CPD process:cpwd_admin stop -name CPD -path "$CPDIR/bin/cpd_admin" -command "cpd_admin stop" cpwd_admin start -name CPD -path "$CPDIR/bin/cpd" -command "cpd"There is one primary command to configure the thresholds in the command line, threshold_config. You must be in the Expert mode to run it. After you run threshold_config, follow the on-screen instructions to make selections and configure the global settings and each threshold.
When you run threshold_config, you get these options:
If you select Configure global alert settings, you can configure global settings for how frequently alerts are sent and how many alerts are sent. You can configure these settings for each threshold. If a threshold does not have its own alert settings, it uses the global settings by default.
You can configure these options:
If you select Configure Alert Destinations, you can add and remove destinations for where the alerts are sent. You can see a list of the configured destinations. A destination is usually an NMS (Network Management System) or a Check Point Domain Log Server.
After you enter the details for a destination, the CLI asks if the destination applies to all thresholds.
For each threshold, you can choose to which of the alert destinations its alerts are sent. If you do not define alert destination settings for a threshold, it sends alerts to all of the destinations that you applied to all thresholds.
For each alert destination enter:
If you select Configure thresholds, you see a list of the categories of thresholds, including:
Some categories apply only to some machines or deployments. For example, Hardware applies only to Check Point appliances and High Availability applies only to clusters or High Availability deployments.
Select a category to see the thresholds in it. Each threshold can have these options:
You can see an overview of the SNMP thresholds that you configure in SmartView Monitor.
To see an overview of the SNMP thresholds:
In the pane that opens, you can see these details: