Monitoring and Logging
Monitoring Important Events with SmartEvent
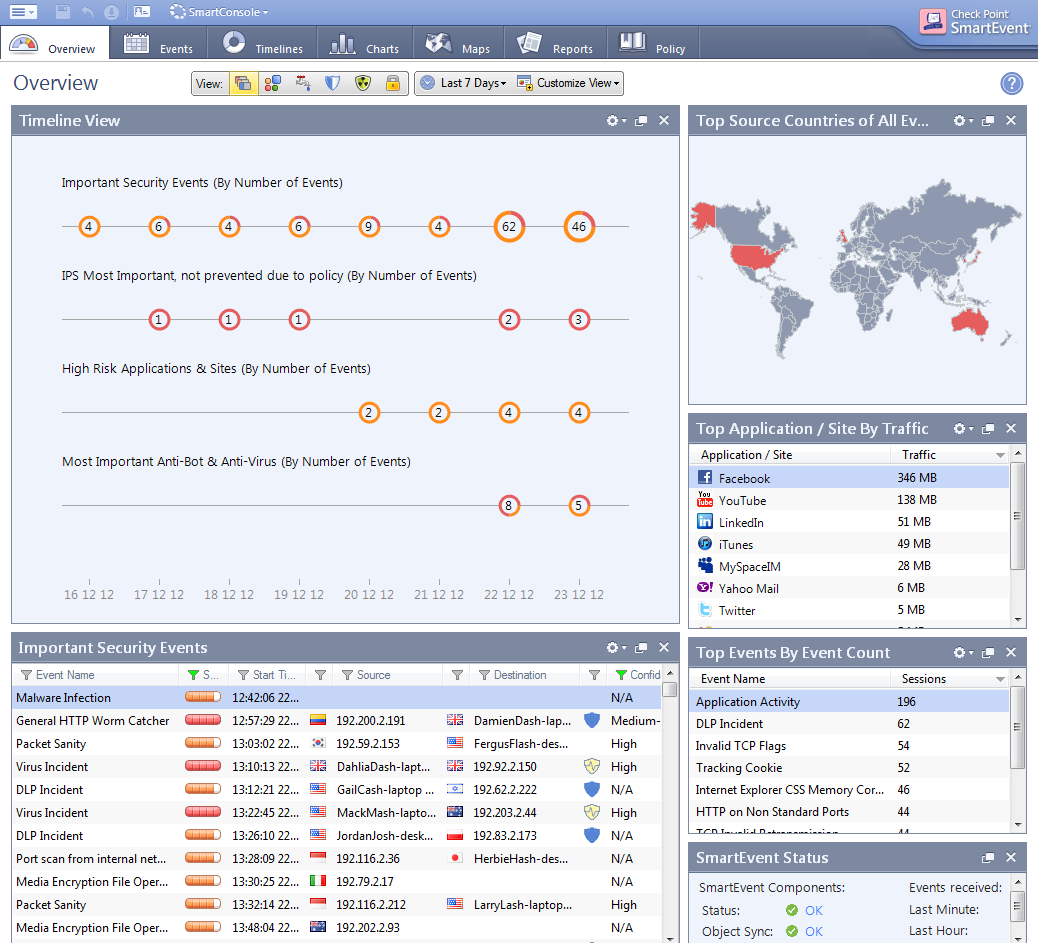
The SmartEvent Software Blade is a unified security event management and analysis solution that delivers real-time, graphical threat management information. SmartEvent consolidates and shows all security events that are generated by these Software Blades:
- Firewall
- Identity Awareness, and URL Filtering
- IPS
- Application Control
- Anti-Bot, Threat Emulation, and Anti-Virus
- DLP
Administrators can quickly identify very important security events and do the necessary actions to prevent more attacks.
For more information about using SmartEvent, see the R77 SmartEvent Administration Guide.
Enabling SmartEvent
To enable SmartEvent on the Security Management Server:
- In SmartDashboard from the navigation tree, double-click the Security Management Server or Domain Log Server.
The window opens.
- In the tab, select these Software Blades:
- Click .
- From the menu bar, select .
- From the menu bar, select .
The SmartEvent console opens.
Creating Reports
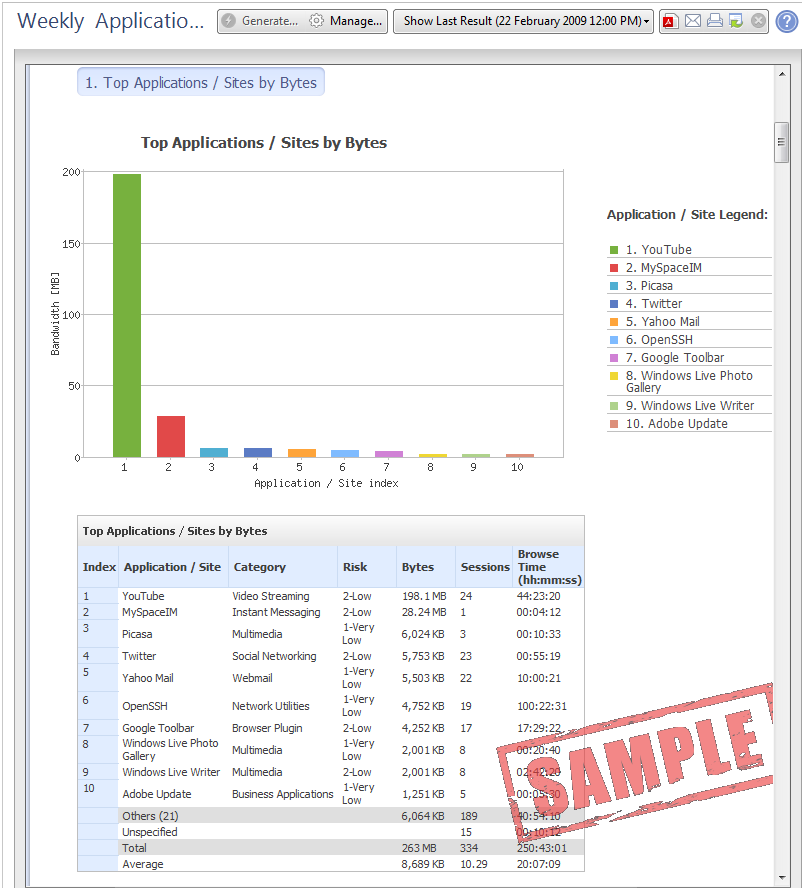
SmartEvent lets you create reports that summarize events for the supported Software Blades. These reports can help you identify attack trends and the effectiveness of the Firewall Rule Base and the security policy. The reports can be automatically sent as emails and PDF files at regular intervals.
To create a SmartEvent report:
- In SmartEvent, click the tab.
- From the navigation tree, click or a Software Blade.
- Select the report.
A sample report is shown in the window.
- Click .
The report is generated and shown in a new window.
- To create a PDF file, click
 . . The report is saved to a PDF.
Sample Application Control and URL Filtering Event Analysis
This is a sample procedure that shows how to use SmartEvent to do an analysis of Internet browsing events from the Application Control and URL Filtering Software Blade.
To show an Internet browsing event:
- From SmartEvent tab, in the section, click the Application Control and URL Filtering icon
 . .The Application Control and URL Filtering page opens.
- In , click the events for a day.
The window opens.
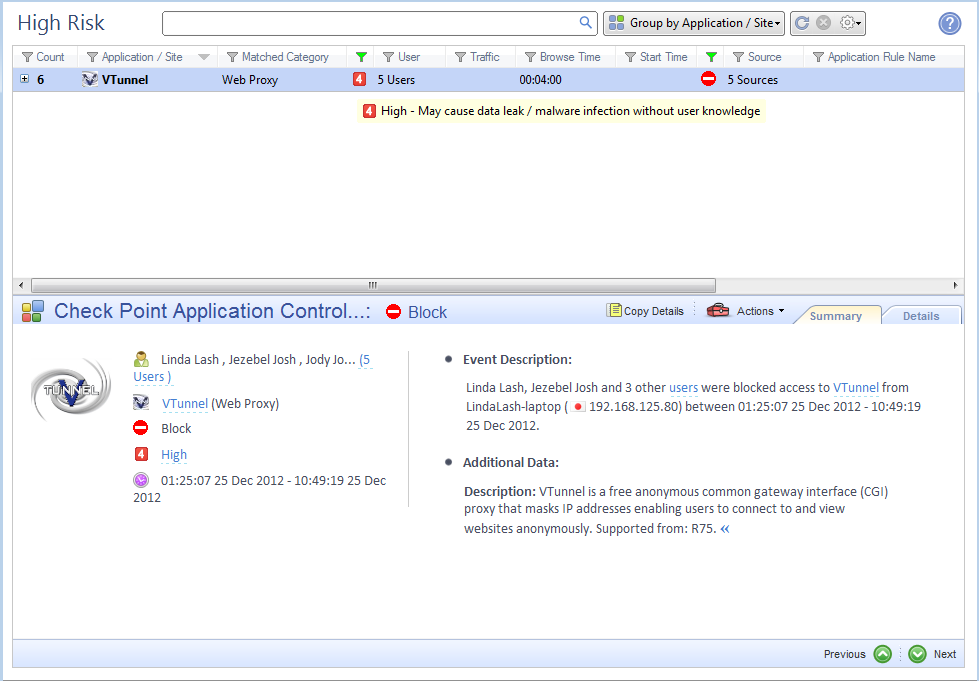
This is some of the information about the event:
- Five users tried to access the VTunnel web proxy
- VTunnel is classified as a security risk and is a Web proxy site that lets users go to websites anonymously
- The names of the 5 users that tried to go to the VTunnel website are shown
Monitoring Traffic and Connections with SmartLog
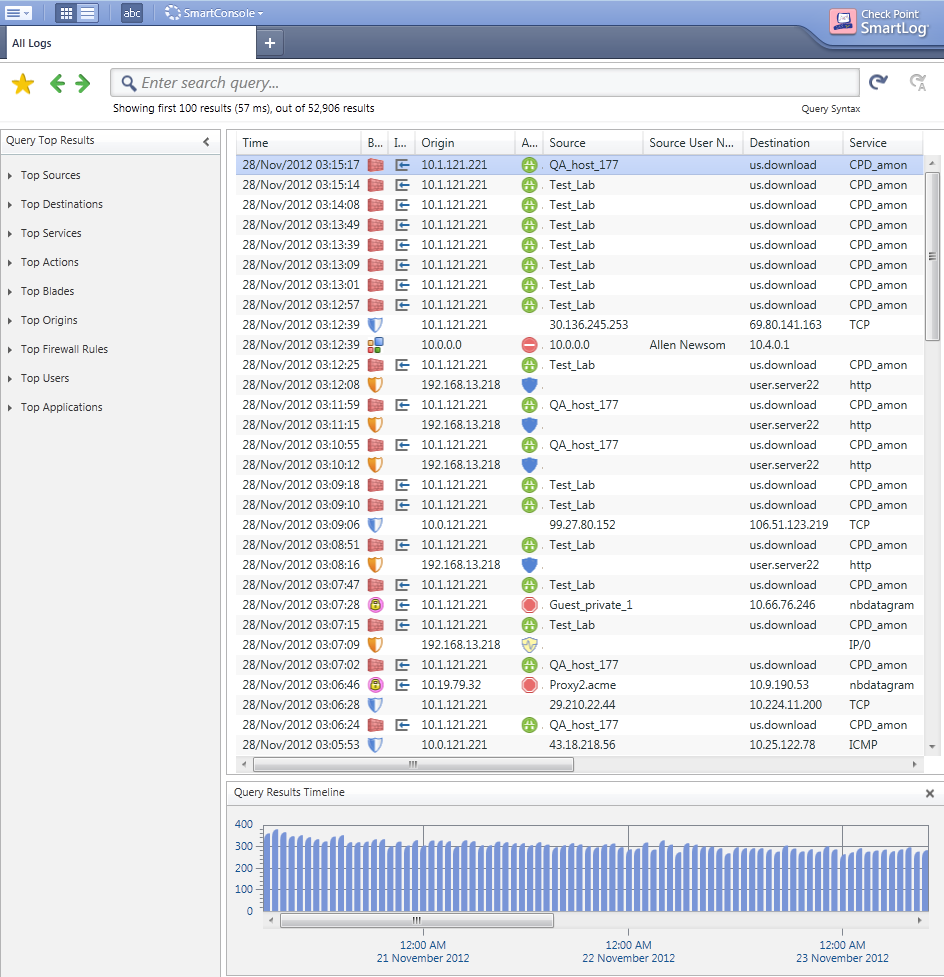
The SmartLog Software Blade is a log management tool that reads logs from all Software Blades on Security Management Servers and Security Gateways. SmartLog works with the SmartLog Index Server that gets log files from different log servers and indexes them. SmartLog supplies these monitoring features:
- Quickly search through billions of logs with simple search strings
- Select from many default search queries to find the applicable logs
- Monitor logs from administrator activity and connections in real-time
For more about using SmartLog, see the R77 SmartLog Administration Guide.
Enabling SmartLog
The SmartLog Index Server contains a central index of log entries from all SmartLog enabled Security Management Server and Log Servers.
To enable SmartLog:
- Open SmartDashboard.
- From the tree, double-click the Security Management Server or Domain Log Server.
The window opens.
- In the tab, select .
- From the navigation tree, click .
- Select and then click .
- From the menu bar, select .
The SmartLog Index Server is installed on the Security Management Server.
- From the menu bar, select .
The SmartLog console opens.
Sample Log Analysis
This is a sample procedure that shows how to use SmartLog to do an analysis of a log of a dropped connection.
To show a log of a dropped connection:
- From SmartLog, in the pane select .
The Results pane shows the logs for dropped connections.
- Double-click a log.
The window opens.
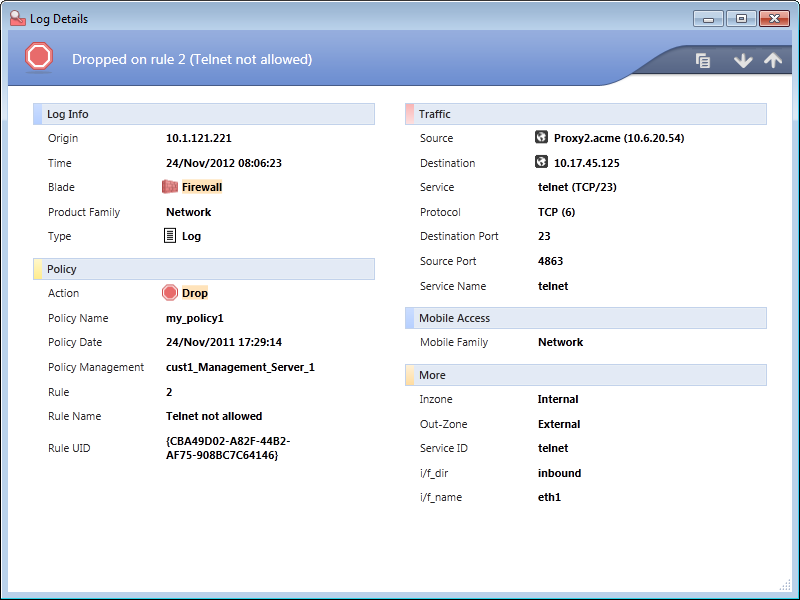
This is some of the information about the dropped connection in the log:
- A telnet connection from 10.6.20.54 to 10.17.45.125 was dropped
- The connection matched rule number 2 (Telnet not allowed) in the Firewall Rule Base
|

