Hardware Health Monitoring
SecurePlatform enables a number of hardware health monitoring capabilities for Check Point appliances and for open servers.
Introduction to Hardware Health Monitoring
SecurePlatform supports these Hardware Health Monitoring features:
- RAID health: Monitor the health of the disks in the RAID array, and be notified of the states of the volumes and disks. The information is available via SNMP.
- Hardware Sensors: Use the WebUI or SNMP to monitor fan speed, motherboard voltages, power supply health, and temperatures. Only Open Servers with an IPMI card are supported.
For more information about Hardware Health Monitoring features for specific appliances, see R76 Release Notes.
RAID Monitoring with SNMP
The health of disks’ RAID array can be monitored using the Gaia SNMP monitoring daemon. SNMP traps can be set to fire once an OID value is in breach of a configurable threshold.
The raidInfo MIB branch is 1.3.6.1.4.1.2620.1.6.7.7. The information it contains is detailed below.
Data is available in the form of two SNMP tables:
SNMP Table
|
OID
|
Volumes
|
1.3.6.1.4.1.2620.1.6.7.7.1.1
|
Disks
|
1.3.6.1.4.1.2620.1.6.7.7.2.1
|
Each volume in the RAID configuration has an entry in the Volumes table. Each volume's entry in the Volumes table contains the following OID values:
Disk Volume Information
|
OID
|
Comment
|
Index
|
.1
|
|
Volume ID
|
.2
|
|
Volume Type (RAID level)
|
.3
|
For check Point appliances, will normally be RAID_1
|
Number Of Disks in the RAID
|
.4
|
|
Volume size
|
.5
|
Maximum supported LBA
(Logical Block Addressing)
|
Volume state
|
.6
|
One of:
|
Volume flags
|
.7
|
One or more of:
- ENABLED
- QUIESCED
- RESYNC_IN_PROGRESS
- VOLUME_INACTIVE
|
Each disk participating in the RAID configuration has an entry in the disks table. Each disk's entry in the table contains the following OID values:
Physical Disks information
|
OID
|
Comment
|
Index
|
.1
|
|
Volume ID
|
.2
|
|
SCSI ID
|
.3
|
|
Disk number
|
.4
|
On Check Point Power-1 9070 appliance:
0 - upper disk, 1 - lower disk
|
Vendor
|
.5
|
|
Product ID
|
.6
|
|
Revision
|
.7
|
|
Size
|
.8
|
Maximum supported LBA
(Logical Block Addressing)
|
State
|
.9
|
One of the following:
- ONLINE
- MISSING
- NOT_COMPATIBLE
- FAILED
- INITIALIZING
- OFFLINE_REQUESTED
- FAILED_REQUESTED
- OTHER_OFFLINE
|
Flags
|
.10
|
One of:
|
Sync state
|
.11
|
A percentage. Shows how much of the backup disk is synchronized with the primary disk
|
Example RAID Monitoring OIDs
OID
|
Meaning
|
1.3.6.1.4.1.2620.1.6.7.7.1.1.3.1.0
|
RAID type field of entry #1 from the volumes table
|
1.3.6.1.4.1.2620.1.6.7.7.1.1.4.1.0
|
Number of disks field of entry #1 from the volumes table
|
1.3.6.1.4.1.2620.1.6.7.7.2.1.4.2.0
|
Disk number field of entry #2 from the disks table
|
SNMP monitoring rules are defined in the snmpd.conf configuration file. For more about using SNMP, see SNMP in the R76 Gaia Administration Guide.
Sensors Monitoring with SNMP
Hardware health sensors can be monitored using the SecurePlatform SNMP monitoring daemon.
SNMP traps can be set to fire once an OID value is in breach of a configurable threshold.
The sensorInfo MIB branch is 1.3.6.1.4.1.2620.1.6.7.8. The information it contains is detailed below.
Data is available in the form of 3 SNMP tables:
SNMP Table
|
OID
|
Temperatures
|
1.3.6.1.4.1.2620.1.6.7.8.1.1
|
Fan speeds
|
1.3.6.1.4.1.2620.1.6.7.8.2.1
|
Voltages
|
1.3.6.1.4.1.2620.1.6.7.8.3.1
|
Each sensor in the system has an entry in one of the 3 tables. Each sensor's entry contains the following OID values:
Sensors Table Entry
|
OID
|
Comment
|
Index
|
.1
|
|
Name
|
.2
|
|
Value
|
.3
|
|
Unit of measurement
|
.4
|
One of:
- Degrees C
- RPM (Revolutions per Minute)
- Volts
|
Type
|
.5
|
One of:
|
Status
|
.6
|
One of:
- 0 - In normal range
- 1 - Out of normal range
- 2 - Reading error
|
Example Sensors Monitoring OIDs
OID
|
Meaning
|
1.3.6.1.4.1.2620.1.6.7.8.1.1.2.1.0
|
Name of sensor #1 from the Temperatures table
|
1.3.6.1.4.1.2620.1.6.7.8.2.1.3.4.0
|
Value of sensor #4 from the Fan Speeds table
|
1.3.6.1.4.1.2620.1.6..7.8.3.1.6.5.0
|
Status of sensor #5 from the Voltages table
|
SNMP monitoring rules are defined in the snmpd.conf configuration file. For more about using SNMP, see SNMP in the R76 Gaia Administration Guide.
Sensors Monitoring with SNMP on Check Point Appliances
On Check Point appliances the hardware status can be monitored using the Web interface and SNMP polling, or by defining the SNMP trap using the cp_monitor mechanism. SNMP monitoring rules are defined in the snmpd.conf configuration file. For full details see SNMP Monitoring.
Examples of cp_monitor for the different Check Point Appliances are described in SecureKnowledge solution sk42426.
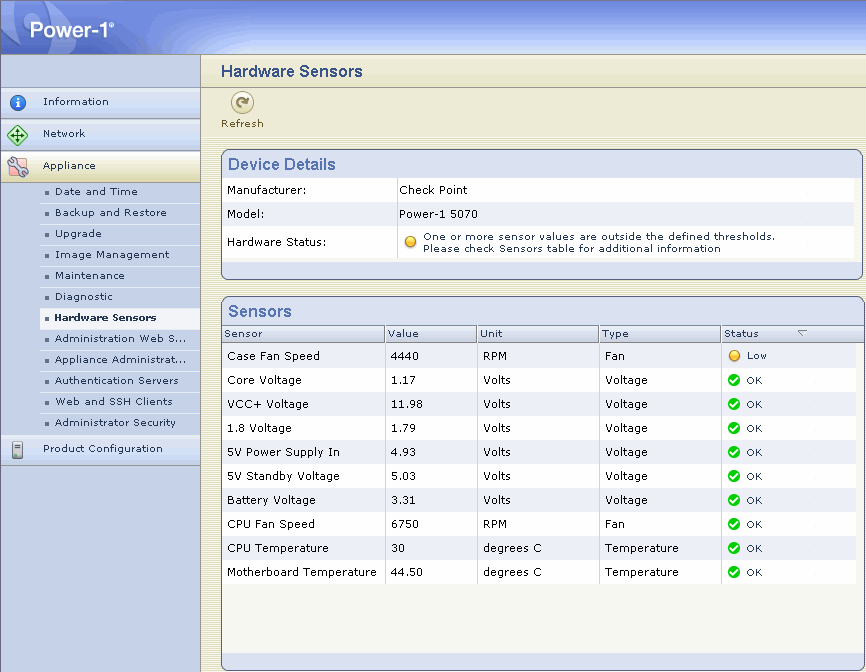
Sensors Monitoring Using the Web Interface
Use the Web interface (WebUI) to monitor the hardware sensors on Check Point appliances. The Hardware Sensors page provides information about temperature, voltage and fan speed of the appliance. A warning is displayed if one of the values exceeds the threshold’s values. The thresholds are hard-coded in the hardware.
|
