Configuring Event Definitions
Use the Policy tab to configure and customize the events that define the SmartEvent Event Policy.
Tuning SmartEvent Using Learning Mode
SmartEvent is ready "out-of-the-box" with an Event Policy based on real-world expectations. In most cases, however, further fine-tuning is required. The SmartEvent Learning Mode analyzes the Event Log and generates a report with suggestions as to what modifications you should make to your system Event Policy. It should be run a day or so after installing SmartEvent, and whenever you want to further refine the events detected.
Running Learning Mode
To run Learning Mode, proceed as follows:
- From the Actions menu, select Learning Mode.
- Select Advanced analysis method, and then select Advanced.
- Choose from which date you would like to analyze events. If this is the first time you are running Learning Mode, it is recommended to select Analyze entire database.
- Select OK to close the Learning mode advanced options window, and OK again to begin the analysis. This may take some time.
Working with Learning Mode Results
When the analysis is complete, a browser window opens with SmartEvent recommendations for fine-tuning your Event Policy. Once Learning Mode presents its results, proceed as follows:
- Review the Learning Mode results.
- If you do not want to accept the SmartEvent recommendation, clear the applicable recommendation.
- To apply the suggestions, select Apply.
- Select the Policy tab to confirm that the changes have been applied to specific Event Definitions. Specifically review per event what exceptions have been added to the section Apply the following exceptions.
- To save and implement these changes to the Event Policy, select File > Save, and Actions > Install Event Policy.
Modifying Event Definitions
SmartEvent is constantly culling data from your Log servers, and searching for patterns within all the network chatter that enters your system.
Depending on the levels set within each Event Definition, the number of events detected can be quite high. Yet only a portion of those events may be meaningful. By modifying the thresholds and other criteria that make up an event, you can reduce the number of false alarms.
 Note - Use Learning Mode First Note - Use Learning Mode First

|
Note - It is recommended to run Learning Mode before beginning to manually change Event Definitions. See Using Learning Mode for details.
|
These modifications are done in the Event Definitions. A high-level view of the process of modifying Event Definitions is as follows:
- Select a type of event from one of the Event Policy categories.
- Adjust the Event Definitions as desired. The elements that can be modified vary per Event Definition. Some event types will include all; others will have just one or two of these configurable elements.
- When you have finished making changes to the Event Definitions, save the Event Policy by selecting File > Save.
- From the Actions menu, select Install Event Policy.
Event Definitions and General Settings
The Selector tree is divided into two branches: Event Policy and General Settings. All of the events detectable by SmartEvent are organized by category in the Event Policy branch. Selecting an event definition displays its configurable properties in the Detail pane, and a description of the event in the Description pane. Clearing the property removes this event type from the Event Policy the next time the Event Policy is installed.
The General Settings branch contains Initial Settings, such as defining Correlation Units, which are typically used for initial configuration. Clicking on a General Settings item displays its configurable properties in the Detail pane.
For details on specific attacks/events, refer to the Event Definition Detail pane.
Event Definition Parameters
When an event definition is selected, its configurable elements appear in the Detail pane, and a description of the event is displayed in the Description pane. There are generally six types of configurable elements:
- Thresholds, such as Detect the event when more than x connections were detected over y seconds
- Severity, such as Critical, Medium, Informational, etc.
- Automatic Reactions, such as Block Source or run External Script
- Exclusions, such as Exclude the following sources and destinations
- Exceptions, such as Apply the following exceptions
- Time Object, such as to issue an event if the following occurs outside the following Working Hours
Not all of these elements appear for every Event Definition. After installing and running SmartEvent for a short time, you will discover which of these elements need to be fine-tuned per Event Definition. For more about fine-tuning Event Definitions, see Configurable Elements of Event Definitions.
The configurable settings are straight-forward for the General Settings items. Adding a Time Object opens a window to set the appropriate hours and days of the week. For configuration information regarding most objects in General Settings, see System Administration.
Event Threshold
The Event Threshold allows you to modify the limits that, when exceeded, indicates that an event has occurred. The limits typically are the number of connections, logs, or failures, and the period of time in which they occurred. It appears thus:
Detect the event when more than x connections/logs/failures (etc.) were detected over a period of y seconds.
One way of decreasing the number of false alarms based on a particular event is to increase the number of connections, logs or failures and/or the period of time for them to occur.
Severity
An event severity affects in which queries (among those that filter for severity) this type of event will appear.
To modify the severity of an event, select a severity level from the drop-down list.
Automatic Reactions
Upon detection, an event can activate an Automatic Reaction. The SmartEvent administrator can create and configure a single Automatic Reaction, or many, according to the needs of the system. For example, a single Mail Reaction can be defined to inform the administrator of any event to which it is applied, or multiple Automatic Mail Reactions can be created in order to inform a different responsible party for each type of event.
There are five kinds of Automatic Reactions:
- Mail - alert an administrator by email that the event has occurred
- SNMP Trap - generate an SNMP Trap
It is possible to send event fields in the SNMP Trap message. The format for such an event field is [seam_event_table_field]. The following list represents the possible seam_event table fields:
AdditionalInfo varchar(1024)
AutoReactionStatus varchar(1024)
Category varchar(1024)
DetectedBy integer
DetectionTime integer
Direction integer
DueDate integer
EndTime integer
EventNumber integer
FollowUp integer
IsLast integer
LastUpdateTime integer
MaxNumOfConnections integer
Name varchar(1024) ,NumOfAcceptedConnections integer
NumOfRejectedConnections integer
NumOfUpdates integer
ProductCategory varchar(1024)
ProductName varchar(1024)
Remarks varchar(1024)
RuleID varchar(48)
Severity integer
StartTime integer
State integer
TimeInterval integer
TotalNumOfConnections varchar(20)
User varchar(1024)
Uuid varchar(48)
aba_customer varchar(1024) ,
jobID varchar(48)
policyRuleID varchar(48)
- Block Source - instruct the Security Gateway to block the source IP address(es) from which this event was detected for a configurable period of time (choose any period of time from one minute to over three weeks).
- Block Event activity - instruct the Security Gateway to block a distributed attack emanating from multiple sources or attacking multiple destinations for a configurable period of time (choose any period of time from one minute to over three weeks).
- External Script - run a script that you provide. See Creating an External Script for help in writing a script that can exploit SmartEvent data.
Each Automatic Reaction must be defined, and that can be done either from within an Event Definition, or from General Settings > Objects > Automatic Reactions.
The following sections describe how to add an Automatic Reaction to an event, and how to create
Adding an Automatic Reaction to an Event
To add an Automatic Reaction for SmartEvent to execute when this type of event is detected, proceed as follows:
- Select the icon [...].
- Either select an Automatic Reaction that you have created from the list, or select Add new
. (See section below for details on creating each type of Automatic Reaction.)
- Configure the Automatic Reaction, and then select Save.
- Click OK.
Creating Automatic Reactions
Automatic Reactions can be created either from:
- within an Event Definition, by selecting the icon [...] and clicking Add new
- the Policy tab, by selecting General Settings > Objects > Automatic Reactions
The first step for each of the following procedures assumes that you are at one of these two starting points.
Create a Mail Reaction
- Select Add > Mail.
- Give the automatic reaction a significant Name.
- Fill out the Mail Parameters of From, To and cc. To add multiple recipients, separate each email address with a semi-colon. Note that the Subject field has the default variables of [EventNumber] - [Severity] - [Name], which automatically adds to the mail subject the event number, severity and name of the event that triggered this reaction. These variables can be removed at your discretion. You can also include your own standard text per mail reaction.
- Enter the domain name of the SMTP server.
- Select Save.
Create an SNMP Trap Reaction
- Select Add > SNMP Trap.
- Give the automatic reaction a significant Name.
- Fill out the SNMP Trap parameters of Host, Message, OID and Community name. The command send_snmp uses values that are found in the file chkpnnt.mib, in the directory $CPDIR/lib/snmp/. Any OID value used in the SNMP Trap parameters window must be defined in chkpnnt.mib, or in a file that is referenced by it. If the OID field is left blank, then the value is determined from iso.org.dod.internet.private.enterprises.checkpoint.products.fw.fwEvent = 1.3.6.1.4.1.2620.1.1.11.
When the automatic reaction occurs, the SNMP Trap is sent as a 256 byte DisplayString text. However, if the OID type is not text, the message is not sent.
- Select Save.
Create a Block Source Reaction
- Select Add > Block Source.
- Give the automatic reaction a significant Name.
- Select from the drop-down list or enter the number of minutes to block this source.
- Select Save.
Create a Block Event Activity Reaction
- Select Add > Block Event Activity.
- Give the automatic reaction a significant Name.
- Select from the drop-down list or enter the number of minutes to block this source.
- Select Save.
Create an External Script Reaction
- Select Add > External Script.
- Give the automatic reaction a significant Name.
- Do one of these steps:
- Enter the full path and file extension of the script.
- Make sure that the executable is located on the SmartEvent server in the directory
$FWDIR/bin.
The path and script name must not contain any spaces.
- Select Save.
- The script must run no longer than 10 minutes, otherwise it will be terminated by the SmartEvent Server.
Working Hours
Working Hours are used to detect unauthorized attempts to access protected systems and other forbidden operations after-hours. To set the Regular Working Hours for an event, select a Time Object that you have configured from the drop-down list.
To create a Time Object:
- From the Policy tab, select General Settings > Objects > Time Objects.
- Click Add. Enter a Name and Description.
- Select the days and times that are considered Regular Working Hours.
- Click OK.
To assign a Time Object to an event:
- From the Policy tab, select an event that requires a Time Object (for example, User Login at irregular hours in the Unauthorized Entry event category).
- Select the Time Object you created from the drop-down list.
- Select File > Save to save the configuration.
Adding Exclusions
Exclusions remove log entries from query results according to defined criteria (query properties). For example, if source 10.10.10.1 is defined as an exclusion for an event, all events with source 10.10.10.1 do not show in the query result. Global Exclusions work in the same way, except they apply to all events.
You can add exclusions in one of these ways:
- Manually using this window
- By accepting Learning Mode recommendations
- By right-clicking an event and selecting Exclude from event definition.
To manually add an exclusion:
- Click Add.
- In the Exclusion window, select the Source and/or destination Server object you want to exclude from the query results.
- Configure any other filter criteria that are available for the specified event.
- Optionally, click Apply and delete existing events to remove the excluded events from the existing query results.
If you do not see the host object listed, you may need to create it in SmartEvent.
You can change or delete existing exclusions by selecting Edit or Remove, respectively.
Exceptions
Exceptions allow an event to be independently configured for the sources or destinations that appear here. For example, if the event Port Scan from Internal Network is set to detect an event when 30 port scans have occurred within 60 seconds, you can also define that two port scans detected from host A within 10 seconds of each other is also an event.
To manually add an exception, under the heading Apply the following exceptions, click Add and select either the Source and/or Destination of the object to which you want to apply different criteria for this event.
Existing exceptions can be modified or deleted by selecting Edit or Remove, respectively.
Creating Event Definitions (User Defined Events)
Creating a user-defined event requires knowledge of the method by which SmartEvent identifies events. The following section begins with a high level overview of how logs are analyzed to determine if an event is occurring or has occurred.
High Level Overview of Event Identification
Events are detected by the SmartEvent Correlation Unit. The Correlation Unit task is to scan logs for criteria that match an Event Definition. SmartEvent uses these procedures to identify events:
Matching a Log Against Global Exclusions
When the Correlation Unit reads a log, it first checks whether the log matches any defined Global Exclusions. Global Exclusions (defined on the Policy tab > Event Policy > Global Exclusions) direct SmartEvent to ignore logs that are not expected to contribute to an event. If the log matches a Global Exclusion, it is discarded by the system. If not, the Correlation Unit begins matching it against each Event Definition.
Matching a Log Against Each Event Definition
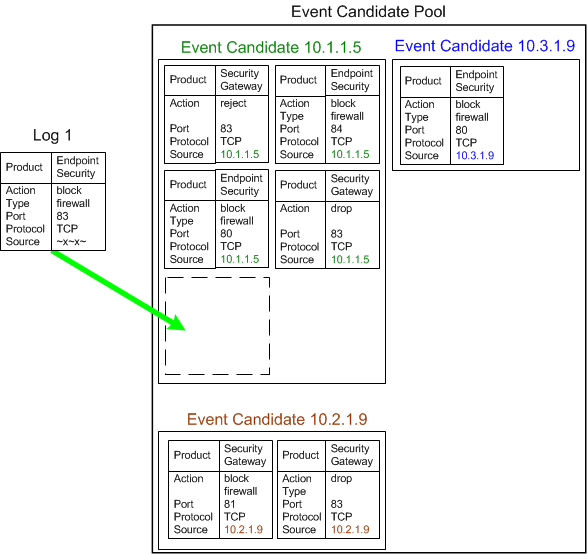
Each Event Definition contains a filter which is comprised of a number of criteria that must be found in any matching log. The criteria are divided by product; that is, the Event Definition may include a number of different products, but each product has its own criteria.
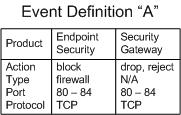
For a log from Endpoint Security to match on Event Definition "A", it must match the Action, Event Type, Port, and Protocol values listed in the Endpoint Security column. A log from a Security Gateway must match the values listed in its column.
SmartEvent divides this process into two steps. The Correlation Unit first checks whether the Product value in the log matches one of the acceptable Product values of an Event Definition.
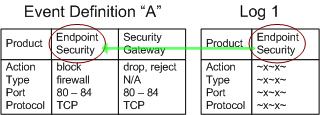
If Log 1 did not contain an acceptable Product value, the Correlation Unit would then compare the log against Event Definition "B", and so on. If the log fails to match against any Event Definition, it is discarded.
After checking the "Product" criterion, the Correlation Unit checks whether the log contains the Product-specific criteria to match the Event Definition. For instance, the product Endpoint Security generates logs that involve the Firewall, Spyware, Malicious Code Protection, and others, and the log contains this information in the field "Event Type". If an event is defined to match on Endpoint Security logs with the Event Type "Firewall", then an Endpoint Security log with Event Type "Spyware" will fail against the Event Definition filter. Other criteria may be specific to the Product as well.
Returning to our example, Log 1 has matched Event Definition "A" with an acceptable Product value. The Correlation Unit now examines whether the log contains the necessary criteria for an Endpoint Security log to match.
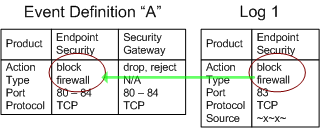
If the criteria did not match, the Correlation Unit would continue comparing the log criteria to other Event Definitions, until discarding it.
Creating an Event Candidate
Once a log matches the criteria, it is added to an Event Candidate. Event Candidates let SmartEvent tracks logs until an event threshold has been crossed, at which point an event is generated.
Note that:
- the Event Candidate can track logs from multiple products
- the logs must originate from the same source
- the Event Candidate tracks logs even before all of the criteria have been matched
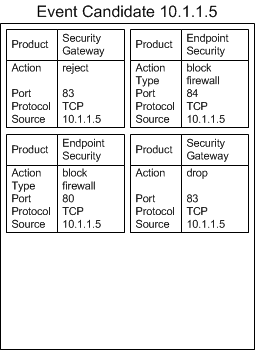
Each Event Definition may have multiple Event Candidates existing simultaneously, each of which is keeping track of logs grouped by similar properties, such as by host, service, destination, or any combination of these or others. In the figure above the logs that form the Event Candidate have a common Source value, and have been dropped, blocked or rejected by a Firewall. They are grouped together because the Event Definition is designed to detect this type of activity originating from a single source.
Whenever a log matches the Event Definition but has properties different than those of the existing Event Candidates, a new Event Candidate is created and added to what can be thought of as the Event Candidate Pool.
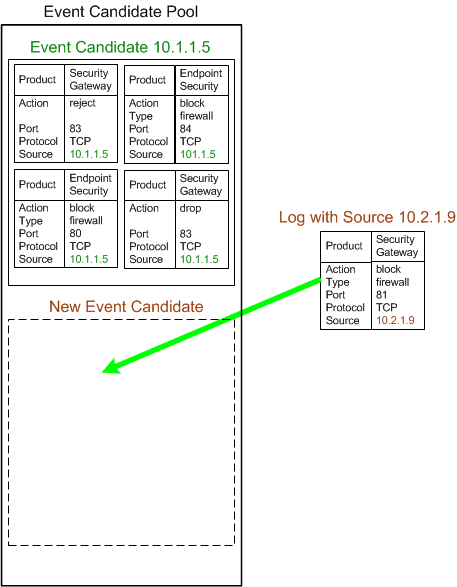
Note that SmartEvent creates a new Event Candidate for a log with a different source.
To illustrate further, consider an event defined to detect a high rate of blocked connections. SmartEvent tracks the number of blocked connections for each Firewall, and the logs of the blocked traffic at each Firewall forms an event candidate. When the threshold of blocked connection logs from any Firewall is surpassed, that Firewall event candidate becomes an event. While this Event Definition creates one event candidate for each Firewall monitored, other Event Definitions may create many more.
The Event Candidate Pool is a dynamic environment, with new logs being added and older logs being discarded when they have exceeded an Event Definition time threshold.
When a Candidate Becomes an Event
When a candidate becomes an event, the Correlation Unit forwards the event to the Event Database. But discovering an event does not mean that SmartEvent stops tracking logs related to it. The Correlation Unit will keep adding matching logs to the event as long as they continue to arrive during the event threshold. Keeping the event "open" condenses what might otherwise appear as many instances of the same event to one, and provides accurate, up-to-date information as to the beginning and end time of the event.
Creating a User-Defined Event
New Event Definitions can be created by right clicking an existing Event Definition or via the Actions menu:
Right Click
|
Actions Menu
|
Description
|
New
|
New Custom Event
|
Launches the Event Definition Wizard, which allows you to choose whether to base the event on an existing Event Definition, or from scratch.
|
Save As
|
Save Event As
|
Creates an Event Definition based on the properties of the highlighted Event Definition. When selecting Save As, the system prompts you to save the selected Event Definition with a new name for later editing. Save As can also be accessed from the Properties window.
|
All User Defined Events are saved at Policy tab > Event Policy > User Defined Events. Once an Event Definition exists here, it can be modified via the Properties window, available by right click and from the Actions menu.
Creating a New Event Definition
To create a User Defined Event based on an existing event:
- From the Actions menu, select New Custom Event.
The Event Definition Wizard opens.
- For Create an event, select that is based on an existing event and select an event that has similar properties to the event you want to create. Click Next.
- Give the Event Definition a name, enter a Description and select a Severity level. Click Next.
- Set whether the event is generated by:
- a single log — In many cases, a single log can depict an event, such as a log from a virus scanner that reports that a virus has been found.
- multiple logs — Multiple logs are required if the event can only be identified as a result of a combination of multiple logs, such as a High Connection Rate.
Click Next.
- Check the products that can trigger this event and select Next.
- Choose whether to edit the product filters.
- If you added an additional product you can choose whether you want to edit the filters for each product (Edit all product filters), or only those of new products you have added (Edit only newly selected product filters).
- If you did not add any additional products, you can choose to edit the filters of existing products (Yes) or you can skip the step and leave the product filters unchanged (No, Leave the original files).
Click Next.
- Edit or add product filters for each product by For each log field that you want in the Event Definition filter:
- Select the Log field from the available Log Field list.
- Click Add to edit the filter.
- Select whether the filter matches on All Conditions or Any Conditions.
- Double-click on the Log field and select the values to use in the filter.
Click Next.
- Once you have defined the filters for each product, define how to process logs by selecting values for the following options:
- Click Finish.
Editing a User-Defined Event
- From the Policy tab > Event Policy > User Defined Events, right click a User-Defined Event and select Properties.
- In the tabs provided make the necessary changes:
Name
Give the Event Definition a name, enter a Description and select a Severity level. The text you enter in the Description field appears in the Event Description area (under the event configurable properties).
Filter
To edit a product filter select the product and do the following:
- Select the Log field from the available Log Fields list.
If the field you want is not displayed select Show more fields... to add another field to the Log Fields list.
- Click Add to edit the filter.
- Select whether the filter matches on All Conditions or Any Conditions.
Count logs
This screen defines how SmartEvent counts logs associated with this event.
- a single log — In many cases, a single log can depict an event, such as a log from a virus scanner that reports that a virus has been found.
With this option you can set the fields that are used to group events into Event Candidates. Logs with matching values for these fields are added to the same event. For example, multiple logs reporting a virus detected on the same source with the same virus name will be combined into the same event.
- multiple logs — Multiple logs are required for events that identify a certain level of activity, such as a High Connection Rate.
When the event is triggered by multiple logs, set the behavior of Event Candidates:
Detect the event when at least... — Set the Event Threshold that, when exceeded, indicates that an event has occurred.
Select the field(s) by which distinct event candidates will be created — An event is generated by logs with the same values in the fields specified here. Define how logs are grouped into Event Candidates by selecting the relevant fields here.
Use unique values of the ...— Only logs with unique values for the fields specified here are counted in the event candidate. For example, a port scan event might count logs that include unique ports scanned, and do not increment the log count for logs that contain ports already encountered in the event candidate.
Advanced — enables you to define the keep=alive time for the event, as well as how often the Correlation Unit updates the SmartEvent server with new logs for the created event.
Event Format
When an event is generated, information about the event is presented in the Event Detail pane.
This screen lets you specify whether the information will be added to the detailed pane and from which Log Field the information is taken.
If you do not want to populate an Event Field clear it in the Display column.
GUI representation
All events can be configured and this screen allows you to determine the configuration parameters that are displayed.
The Threshold section will display the number of logs that need to be matched to create the event. This is usually not displayed for single log events and displayed for multiple log events.
The Exclude section lets you specify the log fields that will be displayed when adding an event exclusion.
The Exception section lets you specify the log fields that will be displayed when adding an event exception.
- Click Ok to save your changes.
Eliminating False Positives
The purpose of this chapter is to provide additional assistance in reducing false positives.
Services that Generate Events
Certain types of services are characterized by a high amount of traffic that could be misidentified as events. The following are examples of services and protocols that could potentially generate events:
- Software that performs a routine scan of the network to make sure that everything is running properly. Configuring SmartEvent to exclude this source from a scan event will eliminate a source of false positive events.
- High connection rate on a web server. SmartEvent should be set to allow a higher connection rate per minute on a busy web server, or to exclude this source from a scan event.
Common Events by Service
The information in the table below provides a list of server types where high activity is common. Modify the Event Policy by adjusting event thresholds and adding Exclusions for servers and services in order to further reduce the amount of false positives detected.
Common events by service
Server Type
|
Category
|
Event Name
|
Source
|
Dest
|
Service
|
Reason
|
SNMP
|
Scans
|
IP sweep from internal network
|
Any
|
Any
|
SNMP-read
|
Hosts querying other hosts
|
DNS Servers
|
Scans
|
IP sweep from internal network
|
DNS servers
|
-
|
DNS
|
Inter-DNS servers updates
|
|
Denial of Service (DoS)
|
High connection rate on internal host on service
|
Any
|
DNS servers
|
DNS
|
DNS requests and inter-DNS servers updates
|
|
Anomalies
|
High connection rate from internal network
|
Any
|
Any
|
DNS
|
DNS requests and inter-DNS servers updates
|
|
Anomalies
|
High connection rate from internal network on service
|
Any
|
Any
|
DNS
|
DNS requests and inter-DNS servers updates
|
|
Anomalies
|
Abnormal activity on service
|
Any
|
Any
|
DNS
|
DNS requests and inter-DNS servers updates
|
NIS Servers
|
Scans
|
Port scan from internal network
|
NIS servers
|
Any
|
-
|
Multiple NIS queries
|
|
Denial of Service (DoS)
|
High connection rate on internal host on service
|
Any
|
NIS servers
|
NIS
|
NIS queries
|
|
Anomalies
|
High connection rate from internal network
|
Any
|
Any
|
NIS
|
NIS queries
|
|
Anomalies
|
High connection rate from internal network on service
|
Any
|
Any
|
NIS
|
NIS queries
|
|
Anomalies
|
Abnormal activity on service
|
Any
|
Any
|
NIS
|
NIS queries
|
LDAP Servers
|
Denial of Service (DoS)
|
High connection rate on internal host on service
|
Any
|
LDAP servers
|
LDAP
|
LDAP requests
|
|
Anomalies
|
High connection rate from internal network
|
Any
|
LDAP servers
|
LDAP
|
LDAP requests
|
|
Anomalies
|
High connection rate from internal network on service
|
Any
|
LDAP servers
|
LDAP
|
LDAP requests
|
|
Anomalies
|
Abnormal activity on service
|
Any
|
LDAP servers
|
LDAP
|
LDAP requests
|
HTTP Proxy Servers - Hosts To Proxy Server
|
Denial of Service (DoS)
|
High connection rate on internal host on service
|
Any
|
Proxy servers
|
HTTP:8080
|
Hosts connections to Proxy servers
|
|
Anomalies
|
High connection rate from internal network
|
Any
|
Proxy servers
|
HTTP:8080
|
Hosts connections to Proxy servers
|
|
Anomalies
|
High connection rate from internal hosts on service
|
Any
|
Proxy servers
|
HTTP:8080
|
Hosts connections to Proxy servers
|
|
Anomalies
|
Abnormal activity on service
|
Any
|
Proxy servers
|
HTTP:8080
|
Hosts connections to Proxy servers
|
HTTP Proxy Servers - Out to the Web
|
Scans
|
IP sweep from internal network
|
Proxy servers
|
Any
|
HTTP/ HTTPS
|
Proxy servers connections out to various sites
|
|
Denial of Service (DoS)
|
High connection rate on internal host on service
|
Proxy servers
|
Any
|
HTTP/ HTTPS
|
Proxy servers connections out to various sites
|
|
Anomalies
|
High connection rate from internal network
|
Proxy servers
|
Any
|
HTTP/ HTTPS
|
Proxy servers connections out to various sites
|
|
|
High connection rate from internal hosts on service
|
Proxy servers
|
Any
|
HTTP/ HTTPS
|
Proxy servers connections out to various sites
|
|
Anomalies
|
Abnormal activity on service
|
Proxy servers
|
Any
|
HTTP/ HTTPS
|
Proxy servers connections out to various sites
|
UFP Servers
|
Denial of Service (DoS)
|
High connection rate on internal host on service
|
Any
|
UFP servers
|
Any/UFP by vendor
|
Firewall connections to UFP servers
|
|
Anomalies
|
High connection rate from internal network
|
Any
|
UFP servers
|
Any/UFP by vendor
|
Firewall connections to UFP servers
|
|
Anomalies
|
High connection rate from internal hosts on service
|
Any
|
UFP servers
|
Any/UFP by vendor
|
Firewall connections to UFP servers
|
|
Anomalies
|
Abnormal activity on service
|
Any
|
UFP servers
|
Any/UFP by vendor
|
Firewall connections to UFP servers
|
CVP Servers Request
|
Denial of Service (DoS)
|
High connection rate on internal host on service
|
Any
|
CVP servers
|
Any/CVP by vendor
|
Firewall connections to CVP servers
|
|
Anomalies
|
High connection rate from internal network
|
Any
|
CVP servers
|
Any/CVP by vendor
|
Firewall connections to CVP servers
|
|
Anomalies
|
High connection rate from internal hosts on service
|
Any
|
CVP servers
|
Any/CVP by vendor
|
Firewall connections to CVP servers
|
|
Anomalies
|
Abnormal activity on service
|
Any
|
CVP servers
|
Any/CVP by vendor
|
Firewall connections to CVP servers
|
CVP Servers Replies
|
Scans
|
Port scans from internal network
|
CVP servers
|
Any
|
-
|
multiple CVP replies to same GW
|
|
Scans
|
IP sweep from internal network
|
CVP servers
|
-
|
CVP
|
CVP replies to multiple GWs
|
|
Denial of Service (DoS)
|
High connection rate on internal host on service
|
CVP servers
|
Any
|
Any/CVP by vendor
|
CVP replies
|
|
Anomalies
|
High connection rate from internal network
|
CVP servers
|
Any
|
Any/CVP by vendor
|
CVP replies
|
|
Anomalies
|
High connection rate from internal hosts on service
|
CVP servers
|
Any
|
Any/CVP by vendor
|
CVP replies
|
|
Anomalies
|
Abnormal activity on service
|
CVP servers
|
Any
|
Any/CVP by vendor
|
CVP replies
|
UA Server Request
|
Denial of Service (DoS)
|
High connection rate on internal host on service
|
Any
|
UA servers
|
uas-port (TCP:19191 TCP:19194)
|
connections to UA servers
|
|
Anomalies
|
High connection rate from internal network
|
Any
|
UA servers
|
(TCP:19191 TCP:19194)
|
connections to UA servers
|
|
Anomalies
|
High connection rate from internal hosts on service
|
Any
|
UA servers
|
uas-port (TCP:19191 TCP:19194)
|
connections to UA servers
|
|
Anomalies
|
Abnormal activity on service
|
Any
|
UA servers
|
uas-port (TCP:19191 TCP:19194)
|
connections to UA servers
|
UA Servers Replies
|
Scans
|
Port scans from internal network
|
UA servers
|
Any
|
-
|
multiple UA replies to the same computer
|
|
Scans
|
IP sweep from internal network
|
UA servers
|
Any
|
uas-port (TCP:19191 TCP:19194)
|
multiple UA replies to multiple computers
|
|
Denial of Service (DoS)
|
High connection rate on internal host on service
|
UA servers
|
Any
|
uas-port (TCP:19191 TCP:19194)
|
UA replies
|
|
Anomalies
|
High connection rate from internal network
|
UA servers
|
Any
|
uas-port (TCP:19191 TCP:19194)
|
UA replies
|
|
Anomalies
|
High connection rate from internal hosts on service
|
UA servers
|
Any
|
uas-port (TCP:19191 TCP:19194)
|
UA replies
|
|
Anomalies
|
Abnormal activity on service
|
UA servers
|
Any
|
uas-port (TCP:19191TCP:19194)
|
UA replies
|
SMTP Servers
|
Scans
|
IP sweep from internal network
|
SMTP servers
|
-
|
SMTP
|
SMTP servers connections out to various SMTP servers
|
|
Denial of Service (DoS)
|
High connection rate on internal host on service
|
SMTP servers
|
Any
|
SMTP
|
SMTP servers connections out to various SMTP servers
|
|
Anomalies
|
High connection rate from internal network
|
SMTP servers
|
Any
|
SMTP
|
SMTP servers connections out to various SMTP servers
|
|
Anomalies
|
High connection rate from internal hosts on service
|
SMTP servers
|
Any
|
SMTP
|
SMTP servers connections out to various SMTP servers
|
|
Anomalies
|
Abnormal activity on service
|
SMTP servers
|
Any
|
SMTP
|
SMTP servers connections out to various SMTP servers
|
Anti-Virus Definition Servers
|
Scans
|
IP sweep from internal network
|
AV_Defs servers
|
-
|
Any/AV by vendor
|
Anti-Virus definitions updates deployment
|
|
Denial of Service (DoS)
|
High connection rate on internal host on service
|
AV_Defs servers
|
-
|
Any/AV by vendor
|
Anti-Virus definitions updates deployment
|
|
Anomalies
|
High connection rate from internal network
|
AV_Defs servers
|
-
|
Any/AV by vendor
|
Anti-Virus definitions updates deployment
|
|
Anomalies
|
High connection rate from internal hosts on service
|
AV_Defs servers
|
-
|
Any/AV by vendor
|
Anti-Virus definitions updates deployment
|
|
Anomalies
|
Abnormal activity on service
|
AV_Defs servers
|
-
|
Any/AV by vendor
|
Anti-Virus definitions updates deployment
|
Administrator Permissions Profile - Policy
SmartEvent lets you to assign a Profile to an administrator for the SmartEvent database. When an administrator logs into SmartEvent his user name and password are verified by the SmartEvent server. If the administrator is not defined on the SmartEvent server, the server will attempt the login process with the credentials that are defined on the Security Management Server or Multi-Domain Server connected with SIC to the SmartEvent server.
The Permission Profile types for the SmartEvent Events tab are set in the SmartDashboard or SmartDomain Manager (SmartDashboard > Manage > Permissions Profiles > New / Edit) connected to the Security Management Server or Multi-Domain Server with this option:
The following are the four types of Permission Profiles:
Multi-Domain Security Management
When using Multi-Domain Security Management, SmartEvent works with specified Domains. In the Policy tab, administrator can see events, exceptions and exclusions for Domains according to administrator permissions.
A Multi-Domain Security Management Policy administrator can be one of the following:
- Locally defined administrator on the SmartEvent Server
- Multi-Domain Server Super User defined on the Multi-Domain Server.
- An administrator with permissions to all Domains selected in SmartEvent (Policy > General Settings > Objects > Domains). Unlike the two above, this type of administrator can install a Policy and can view events that are cross-Domain (an event created from logs that come from multiple Domains).
|
|
