Managing Anti-Bot and Anti-Virus
The Anti-Bot and Anti-Virus Overview Pane
In the Anti-Bot and Anti-Virus Overview pane, you can quickly see the gateways in your organization that are enforcing Anti-Bot and Anti-Virus and malware details. Use the windows for the most urgent or commonly-used management actions.
To customize windows you see in the Overview pane:
- In the pane, click .
- Select or clear the windows to show or hide them.
- To restore the original view, click .
- Click .
My Organization
The My Organization window shows a summary of which Security Gateways enforce Anti-Bot and Anti-Virus. It also has a link to the Gateways pane and a direct link to add a new gateway.
Messages and Action Items
The Messages and Action Items window includes:
- A direct link to Check Point for reporting malicious files that were not identified as such.
- A search field that lets you enter a malware name to get a detailed description of the malware and severity, family name, and type details. The system queries the Threat Wiki for this information.
- Shows if a new Anti-Bot and Anti-Virus update package is available.
- Shows if Security Gateways require renewed licenses or Anti-Bot or Anti-Virus contracts.
Statistics
The Statistics window shows up-to-the-minute statistics in timeline wheels for one of these:
- Virus or bot incidents - Viruses or bots detected by the system.
- Virus or bot detected hosts - Hosts that have been compromised with traffic containing a virus or bot. The number of detected hosts shown is related to the Protected Scope values (the network objects you want to protect) in the policy. For example, if the protected scope of a rule refers to the internal network, the number of detected hosts in the timewheels will be from the internal network.
The timeline wheels are grouped according to:
- Selected time interval - hour, day, week or month
- Severity - color-coded according to critical, high, medium and low
When you hover over a timeline wheel you get drilled-down information for the selected time interval. For example, if your selected time interval is , you will see 7 timeline wheels for each day. When you hover over a wheel, you will see the breakdown of the number of incidents or detected hosts according to each severity.
This window also has links to open to see Anti-Bot and Anti-Virus logs and to see traffic graphs and analysis.
The bottom part of the window shows a time-line of the selected time interval.
To show statistics by incidents or detected hosts:
- In the window, select the time interval from the list.
- Select whether to show incidents or detected hosts from the list.
- To refresh the list, click .
Malware Activity
The malware activity window gives you insight as to the originating regions of malware, their corresponding IPs and URLs, and outgoing emails that were scanned.
- - Pinpoints regions in the world that are attacking your organization and the corresponding number of incidents. This information comes from aggregated data on suspicious URLs and IPs.
- - Shows details for the pinpointed regions in the Attack Map. The details include specified URL or IP, the number of attempts and from how many hosts, and the severity.
- - Shows the number of outgoing emails scanned from when the Anti-Bot and Anti-Virus blades were activated.
RSS Feeds
Shows RSS feeds with malware related information. When you click a link, it opens the Check Point Threat Wiki.
The ThreatCloud Repository
The ThreatCloud repository contains more than 250 million addresses that were analyzed for bot discovery and more than 2,000 different botnet communication patterns. The ThreatSpect engine uses this information to classify bots and viruses.
For the reputation and signature layers of the ThreatSpect engine, each Security Gateway also has:
- A local database, the Malware database that contains commonly used signatures, URLs, and their related reputations. You can configure automatic or scheduled updates for this database.
- A local cache that gives answers to 99% of URL reputation requests. When the cache does not have an answer, it queries the ThreatCloud repository.
- For Anti-Virus - the signature is sent for file classification.
- For Anti-Bot - the host name is sent for reputation classification.
Access the ThreatCloud repository from:
- - From the Anti-Bot and Anti-Virus Rule Base in SmartDashboard, click the plus sign in the column, and the Protection viewer opens. From there you can add specific malwares to rule exceptions when necessary.
- - A tool to see the entire Malware database. Open it from the Threat Wiki pane in the Anti-Bot and Anti-Virus tab or from the Check Point website.
The Threat Wiki
The Threat Wiki is an easy to use tool that lets you search and filter the ThreatCloud repository to find more information about identified malware.
- Learn about malware.
- Filter by category, tag, or malware family.
- Search for a malware.
You can access the Threat Wiki from:
- The Anti-Bot and Anti-Virus tab
- The Check Point website
- SmartEvent
- Right-click an event and select .
- Click the malware protection link in the event log.
- Select from the Anti-Virus or Anti-Bot tab in the event log.
- SmartView Tracker - Click the malware protection link in the field of a log record.
Updating the Malware database
The Malware database automatically updates regularly to make sure that you have the most current data and newly added signatures and URL reputations in your Anti-Bot and Anti-Virus policy.
The Malware database only updates if you have a valid Anti-Bot and/or Anti-Virus contract.
By default, updates run on the Security Gateway every two hours. You can change the update schedule or choose to manually update the Security Gateway. The updates are stored in a few files on each Security Gateway.
Connecting to the Internet for Updates
The Security Gateway connects to the internet to get the Malware database updates. To make sure that it can get the updates successfully:
- Make sure that there is a DNS server configured.
- Make sure a proxy is configured for each gateway, if necessary.
To configure a proxy:
- The > pane shows if the Security Gateway uses a proxy to connect to the internet or not.
- Click and select a gateway from the list.
- Click and configure the proxy for the gateway.
- Click .
Scheduling Updates
You can change the default automatic scheduling.
To change the update schedule:
- On the > pane, under , click .
The Scheduled Event Properties window opens.
- In the page, set the . Use one of these options:
- Select and adjust the setting to run the update after an interval of time.
- Select to set days of the week or month and a time of day for updates to occur.
- Enter an hour in the format that is shown.
- Click the node to open the Days page. Select the days when the update will occur. If you select or , more options open for you to select.
- Click .
If you have Security Gateways in different time zones, they will not be synchronized when one updates and the other did not yet update.
Gateways Pane
The pane lists the gateways with Anti-Bot and/or Anti-Virus enabled. The Gateways pane contains these options:
Option
|
Meaning
|
Add
|
Add a gateway or create a new gateway.
|
Edit
|
Modify an existing gateway.
|
Remove
|
Remove the Anti-Bot and Anti-Virus blades from the selected gateway.
|
Search
|
Search for a gateway.
|
For each gateway, you see the gateway name and IP address in the list. You also see these columns:
Column
|
Description
|
Anti-Bot
|
If Anti-Bot is enabled.
|
Anti-Virus
|
If Anti-Virus is enabled.
|
Update Status
|
If the Malware database is up to date on the gateway or if an update is necessary.
|
Engine Mode
|
If the activation mode is configured by a policy or is set to detect only.
|
Comments
|
All relevant comments.
|
Protections Browser
The Protections browser shows the Anti-Bot and Anti-Virus protection types and a summary of important information and usage indicators.
Column
|
Description
|
Protection
|
Shows the name of the protection type. A description of the protection type is shown in the bottom section of the pane.
The Malicious Activity and Unusual Acitivity protections contain lists of protections. Click the plus sign to see them.
|
Blade
|
Shows if the protection type belongs to the Anti-Bot or Anti-Virus Software Blade.
|
Engine
|
Shows the layer of the ThreatSpect engine that handles the protection type.
|
Known Today
|
Shows the number of known protections.
|
Performance Impact
|
Shows how much the group of protections affects the gateway's performance. If possible, shows an exact figure.
|
<Profile Name>
|
Shows the activation setting of the protection type for each defined profile. The values shown here are calculated based on the settings of the confidence levels in the profile and the specified protections that match that confidence level.
You can right-click the activation setting and select a different setting if required. This overrides the setting in the original profile.
|
Searching Protections
You can search the Protections page by protection name, engine, or by any information type that is shown in the columns.
To filter by protection name:
Sorting Protections
You can sort the Protection, Blade, Engine, Known Today columns in the Protections list.
To sort the protections list by information:
- Click the column header of the information you want.
Profiles Pane
The pane lets you configure profiles. These profiles are used in enforcing rules in the Rule Base.
The pane shows a list of profiles that have been created, their confidence levels, and performance impact settings. The Profiles pane contains these options:
Option
|
Meaning
|
New
|
Creates a new profile.
|
Edit
|
Modifies an existing profile.
|
Delete
|
Deletes a profile.
|
Search
|
Search for a profile.
|
Actions > Clone
|
Creates a copy of an existing profile.
|
Actions > Where Used
|
Shows you reference information for the profile.
|
Actions > Last Modified
|
Shows who last modified the selected profile, when and on which client.
|
A profile is a set of configurations based on:
- Activation settings (prevent, detect, or inactive) for each confidence level of protections that the ThreatSpect engine analyzes
- Anti-Bot Settings
- Anti-Virus Settings
- Malware DNS Trap configuration
Without profiles it would be necessary to configure separate rules for different activation settings and confidence levels. With profiles, you get customization and efficiency.
Activation Settings
- - The protection action that blocks identified virus or bot traffic from passing through the gateway. It also logs the traffic, or tracks it, according to configured settings in the Rule Base.
- - The protection action that allows identified virus or bot traffic to pass through the gateway. It logs the traffic, or tracks it, according to configured settings in the Rule Base.
- - The protection action that deactivates a protection.
Confidence Level
The confidence level is how confident the Software Blade is that recognized attacks are actually virus or bot traffic. Some attack types are more subtle than others and legitimate traffic can sometimes be mistakenly recognized as a threat. The confidence level value shows how well protections can correctly recognize a specified attack.
Performance Impact
Performance impact is how much a protection affects the gateway's performance. Some activated protections might cause issues with connectivity or performance. You can set protections to not be prevented or detected if they have a higher impact on gateway performance.
There are three options:
- High or lower
- Medium or lower
- Low
The system comes with a Recommended_Profile. It is defined with these parameters and is used in the predefined rule:
- All protections that can identify an attack with a high or medium confidence level and have a medium or lower performance impact are set to mode.
- All protections that can identify an attack with a low confidence level and have a medium or lower performance impact are set to mode.
Creating Profiles
When you create a profile, you create a new SmartDashboard object. Protections that match one of the confidence levels can be set to , or to allow the profile to focus on identifying certain attacks. The profiles can then be used in the Rule Base.
To create a profile:
- In the Anti-Bot and Anti-Virus tab, select .
- Click .
- From the window, configure:
- Click .
General Properties
Set the general properties of the profile:
- - Mandatory, cannot contain spaces or symbols.
- - Optional color for SmartDashboard object mapping.
- - Optional free text.
- , , and - The default action that protections will take when enabled.
- - Protections will block traffic matching the protection type's definitions.
- - Protections will allow and track traffic matching the protection type's definitions.
- - Protections are deactivated.
- - Set the gateway performance impact level at which to activate protections.
Anti-Bot Settings
Set the Anti-Bot parameters:
- - The Suspicious Mail Outbreaks layer of the ThreatSpect engine inspects only outgoing emails.
- - The Suspicious Mail Outbreaks layer of the ThreatSpect engine inspects incoming and outgoing emails.

|
Note - The Suspicious Mail Outbreaks layer requires an AntiSpam License.
|
- - Set the number of KB that the ThreatSpect engine should inspect for threatening bot activity.
Anti-Virus Settings
Set the Anti-Virus parameters:
- Select a option:
- Select the relevant options:
- If you select Mail, click to set options:
- - Set the maximum number of levels that will be scanned in a MIME email with nested contents. This controls how deeply into the nesting the ThreatSpect engine will scan.
- - If the nesting in an email is more than the configured level, you can configure to block or allow the file.
- Select a option:
- .
- .
- - Click to block or inspect specified file types and click .
- To enable :
- Select - The engine unpacks archives and applies proactive heuristics.
- Click .
- Set the amount in seconds to . The default is 30 seconds.
- Set to block or allow the file . The default is block.
- Click .
Malware DNS Trap
The Malware DNS trap works by configuring the Security Gateway to return a false (bogus) IP address for known malicious hosts and domains. You can set this address to be the IP address of the Security Gateway’s external interface or another IP address. You can also add internal DNS servers to better identify the origin of malicious DNS requests.
Using the Malware DNS Trap you can then detect compromised clients by checking logs with connection attempts to the false IP address.
At the Security Gateway level, you can configure to use the settings defined for the profiles or a specified IP address that is used by all profiles used on the specific gateway.
To set the Malware DNS Trap parameters for the profile:
- - Select to use a Malware DNS Trap to identify compromised clients attempting to access known malicious domains and select which IP address to use:
- - Enter another valid IP address
Use these options to work with the internal DNS server list:
- or - Click to add or edit an internal DNS server to identify the origin of malicious DNS requests.
- - Select a DNS server in the list and click Remove to remove it from the list
- - Enter the name of a DNS server to search for it in the list. Results are shown highlighted.
To set the Malware DNS Trap parameters per gateway:
- In SmartDashboard, right-click the gateway object and select .
- Select from the tree.
- In the DNS Redirect Mode section, choose one of the options:
- - Use the Malware DNS Trap IP address configured for each profile.
- - Configure an IP address to be used by all profiles used by this Security Gateway.
- Click .
Copying Profiles
You can create a copy of a selected profile and then make necessary changes.
To copy a profile:
- In the Anti-Bot and Anti-Virus tab, select .
- Select the profile you want to copy.
- Click > .
The Name field shows the name of the copied profile plus . Rename the profile.
- Configure:
- General Properties
- Anti-Bot Settings
- Anti-Virus Settings
- Malware DNS Trap
- Click .
Deleting Profiles
You can easily delete a profile (except for the profile). But do this carefully, as it can affect gateways, other profiles, or SmartDashboard objects.
To delete a profile:
- In the tab, select .
- Select the profile you want to delete and click .
This message is shown:
- Click .
If the profile contains references to/from other objects, another message is shown:
<profile_name> is used by another object and cannot be deleted.
- Click .
The Object References window opens.
For each object that references the profile, there is a value in the column. If the value is , you can safely delete the profile. If not, find the relationship before you decide to delete this profile.
The Policy Rule Base
The Anti-Bot and Anti-Virus policy determines how the system inspects connections for bots and viruses. The primary component of the policy is the Rule Base. The rules use the Malware database and network objects.
If you enable Identity Awareness on your gateways, you can also use Access Role objects as the scope in a rule. This lets you easily make rules for individuals or different groups of users.
There are no implied rules in the Rule Base. All traffic is allowed unless it is explicitly blocked.
For examples of how to create different types of rules, see Creating Rules.
Predefined Rule
When you enable Anti-Bot and Anti-Virus, a predefined rule is added to the Rule Base. The rule defines that all traffic for all network objects, regardless of who opened the connection, (the protected scope value equals any) is inspected for all protections according to the recommended profile. By default, logs are generated and the rule is installed on all Anti-Bot and Anti-Virus enabled gateways
The result of this rule (according to the Recommended_Profile) is that:
- All protections that can identify an attack with a high or medium confidence level and have a medium or lower performance impact are set to mode.
- All protections that can identify an attack with a low confidence level and have a medium or lower performance impact are set to mode.
You can see logs related to Anti-Bot and Anti-Virus traffic in SmartView Tracker and SmartEvent. Use the data there to better understand the use of Anti-Virus and Anti-Bot in your environment and create an effective Rule Base. From SmartEvent, you have an option to directly update the Rule Base.
You can add more rules that prevent or detect specified protections or have different tracking settings.
Exception Rules
When necessary, you can add an directly to a rule. An exception lets you set a protection or protections to either detect or prevent for a specified protected scope. For example, if you want to prevent specified protections for a specific user in a rule with a profile that only detects protections. Another example, if you want to detect all protections in an R and D lab network in a rule with a prevent profile.
You can add one or more exceptions to a rule. The exception is added as a shaded row below the rule in the Rule Base. It is identified in the No. column with the rule's number plus the letter E and a digit that represents the exception number. For example, if you add two exceptions to rule number 1, two lines will be added and show in the Rule Base as E-1.1 and E-1.2.
You can use exception groups to group exceptions that you want to use in more than one rule. See the Exceptions Groups Pane.
You can expand or collapse the rule exceptions by clicking on the minus or plus sign next to the rule number in the . column.
To add an exception to a rule:
- In the pane, select the rule to which you want to add an exception.
- Click
- Select the , , or option according to where you want to place the exception.
- Enter values for the columns. Including these:
- Change it to reflect the relevant objects.
- - Click the plus sign in the cell to open the Protections viewer. Select the protection(s) and click .
- Click to install the dedicated Anti-Bot and Anti-Virus policy.
Copying an Exception to an Exception Group
You can copy an exception you have created to be a part of an existing exception group or multiple groups. If necessary, you can create a new group with this option.
To copy an exception to an exception group:
- In the pane, select the exception rule in the Rule Base.
- Select > .
The Select Exception Group window opens.
- Select the group or groups from the list or click to create a new group.
- Click .
Converting Exceptions into an Exception Group
You can select multiple exceptions in the Rule Base and create an exception group. The exceptions can be from different rules. When you convert exceptions into a group, they are removed from the Rule Base as individual exceptions and exist only as a group.
To create an exception group from multiple exceptions:
- In the pane, select the exception rules in the Rule Base.
- Select > .
The New Exception Group window opens.
- Enter a and (optional).
- Click .
Parts of the Rules
The columns of a rule define the traffic that it matches and what is done to that traffic.
Number (No.)
The sequence of rules is important because the first rule that matches traffic according to a protected scope and profile is applied.
For example, if rules 1 and 2 share the same protected scope and a profile in rule 1 is set to detect protections with a medium confidence level and the profile in rule 2 is set to prevent protections with a medium confidence level, then protections with a medium confidence level will be detected based on rule 1.
Name
Give the rule a descriptive name. The name can include spaces.
Double-click in the column of the rule to add or change a name and click .
Protected Scope
The Anti-Bot and Anti-Virus Rule Base uses a scope parameter. Any object you configure in the column is inspected for viruses and/or bots, regardless of whether the object opened the connection or not. This is different from the Firewall Rule Base where the Source object defines who opened the connection.
For example, let's say you configure the protected scope of a rule with a user object named Dan Brown. In Anti-Virus, all files sent to Dan Brown will be inspected, even if he did not open the connection. In Anti-Bot, the Security Gateway will analyze Dan Brown's computer to find if is infected with a bot, even if he did not open the connection.
The predefined rule defines the protection scope as any object in the organization (includes all incoming and outgoing traffic) for all protections according to the recommended profile.
Protection
The Protection column shows the Anti-Bot and Anti-Virus protections that you choose to include.
- For , this field is always set to and cannot be changed. Protections for Rule Base rules are defined in the configured profile (in the Action column).
- For and , this field can be set to one or more specified protections.
To add a protection to an exception:
- Put your mouse in the column and click the plus sign to open the Protection viewer.
For each protection, the viewer shows a short description, malware family, type and severity level.
- To add a protection to the exception, click the checkbox in the list.
- To see the details of an item without adding it to the rule, click the name of the Available item.
- To see all malwares in a risk level, select the level from the field in the toolbar.
- Click .
To search for a malware in the Protection viewer:
- Put your mouse in the column and click the plus sign to open the Protection viewer.
- Enter the malware name in the search box.
The results show in the list.
Action
Action refers to how traffic is inspected.
- For , this is defined by the profile. The profile contains the configuration options for different confidence levels and performance impact.
- For and , the action can be set to or .
To select a profile for a rule:
- Click in the column.
- Select an existing profile from the list, create a new profile, or edit the existing profile.
Track
Choose if the traffic is logged in SmartView Tracker or if it triggers other notifications. Click in the column and the options open. The options include:
- - Logs the event and executes a command, such as show a popup window, send an email alert, or run a user-defined script as defined in > > > .
- - Records event details in SmartView Tracker. This option is useful for getting general information on network traffic.
- - Does not record the event.
- - Allows the packets relevant to the connection to be captured for analysis at a later time. The packet capture can be viewed from the event in SmartView Tracker. This can be configured only for rules (not rule exceptions). To configure packet capture, select any tracking action other than and then select .
Install On
Choose which gateways the rule will be installed on. The default is All (all gateways that have Anti-Bot and Anti-Virus enabled). Put your mouse in the column and a plus sign shows. Click the plus sign to open the list of available gateways and select.
Exception Groups Pane
The pane lets you define exception groups. When necessary, you can create exception groups to use in the Rule Base. An exception group contains one or more defined exceptions. This option facilitates ease-of-use so you do not have to manually define exceptions in multiple rules for commonly required exceptions. You can choose to which rules you want to add exception groups. This means they can be added to some rules and not to others, depending on necessity.
The pane shows a list of exception groups that have been created, what rules are using them, and any comments associated to the defined group. The Exceptions Groups pane contains these options:
Option
|
Meaning
|
New
|
Creates a new exception group.
|
Edit
|
Modifies an existing exception group.
|
Delete
|
Deletes an exception group.
|
Search
|
Search for an exception group.
|
Global Exceptions
The system comes with a predefined group named Global Exceptions. Exceptions that you define in Global Exceptions are automatically added to every rule in the Rule Base. For other exception groups, you can decide to which rules to add them.
Exception Groups in the Rule Base
Global exceptions and other exception groups are added as shaded rows below the rule in the Rule Base. Each exception group is labeled with a tab that shows the exception group's name. The exceptions within a group are identified in the column using the syntax:
E - <rule number>.<exception number>, where E identifies the line as an exception. For example, if there is a Global Exceptions group that contains two exceptions, all rules will show the exception rows in the Rule Base column as E-1.1 and E-1.2. Note that the numbering of exception varies when you move the exceptions within a rule.
To view exception groups in the Rule Base:
Click the plus or minus sign next to the rule number in the . column to expand or collapse the rule exceptions and exception groups.
Creating Exception Groups
When you create an exception group, you create a container for adding one or more exceptions. After you create the group, add exceptions to them. You can then add the group to rules that require the exception group in the Anti-Bot and Anti-Virus Rule Base.
To create an exception group:
- In the Anti-Bot and Anti-Virus tab, select .
- Click .
- From the window, enter:
- - Mandatory, cannot contain spaces or symbols.
- - Optional color for SmartDashboard object mapping.
- - Optional free text.
- Click .
Adding Exceptions to Exception Groups
To use exception groups, you must add exception rules to them. For details on the columns, see Parts of the Rules.
To add exceptions to an exception group:
- In the Anti-Bot and Anti-Virus tab, select .
- From the tree, select the group to which you want to add exceptions.
A pane opens showing the exception group name.
- Use the and icons to add exceptions.
Adding Exception Groups to the Rule Base
To add an exception group to the Rule Base:
- In the pane, select the rule to which you want to add an exception group.
- Click >.
- Select the , , or option according to where you want to place the exception group.
The Add Exception Group to rule X (where X represents the rule number) window opens.
- Select the group from the list and click .
The exception group is added to the Anti-Bot and Anti-Virus policy.
- Click to install the dedicated Anti-Bot and Anti-Virus policy.
Creating Exceptions from Logs or Events
In some cases, after evaluating a log in SmartView Tracker or an event in SmartEvent, it may be necessary to update a rule exception in the SmartDashboard Rule Base. You can do this directly from within SmartView Tracker or SmartEvent. You can apply the exceptions to a specified rule or apply the exception to all rules that shows under Global Exceptions.
To update a rule exception or global exception:
- Right-click a SmartView Tracker log entry or a SmartEvent event.
- Select .
SmartDashboard opens and shows an window in the Anti-Bot and Anti-Virus Rule Base. These details are shown:
- - The name of the protection. Details are taken from the ThreatCloud repository or, if there is no connectivity, from the log.
- - The scope is taken from the log. If there is no related host object, an object is created automatically after you click OK. Click the plus sign to add additional objects.
- - Shows by default. You can use the plus sign to add gateways.
- Select an option:
- - If you want the to apply only to the related rule.
- - If you want the to apply to all rules. The exception is added to the > pane.
- Click .
The exception is added to the Rule Base. The is set to by default. Change if necessary.
- Click to install the dedicated Anti-Bot and Anti-Virus policy.
Advanced Settings for Anti-Bot and Anti-Virus
This section describes settings that you can configure in the tab > pane. These settings apply globally for all gateways enabled with Anti-Bot and Anti-Virus.
Engine Settings
On the > pane, configure settings related to engine inspection, the Check Point Online Web Service (ThreatCloud repository), and email addresses and domains that should not be scanned for Anti-Bot.
Check Point Online Web Service
The Check Point Online Web Service is used by the ThreatSpect engine for updated resource categorization. The responses the Security Gateway gets are cached locally to optimize performance.
- When selected, connections are blocked when there is no connectivity to the Check Point Online Web Service.
- When cleared, connections are allowed when there is no connectivity (default).
- - You can select the mode that is used for resource categorization:
- - When a connection cannot be categorized with a cached response, an uncategorized response is received. The connection is allowed. In the background, the Check Point Online Web Service continues the categorization procedure. The response is then cached locally for future requests (default).
This option reduces latency in the categorization process. - - When a connection cannot be categorized with the cached responses, it remains blocked until the Check Point Online Web Service completes categorization.
- - Lets you set different modes for Anti-Bot and Anti-Virus. For example, click to set Anti-Bot to Hold mode and Anti-Virus to Background mode.
Anti-Bot Settings
You can create a list of email addresses or domains that will not be inspected by Anti-Bot. Use this for example to exclude inspection of your organization's internal emails.
- - Lets you add an email or domain entry.
- - Lets you edit an entry in the list.
- - Lets you delete an entry in the list.
Connection Unification
Gateway traffic generates a large amount of activity. To make sure that the amount of logs is manageable, by default, logs are consolidated by session. A session is a period that starts when a user first accesses an application or site. During a session, the gateway records one log for each application or site that a user accesses. All activity that the user does within the session is included in the log.
To adjust the length of a session:
- For connections that are allowed or blocked in the Anti-Bot and Anti-Virus Rule Base, the default session is 10 hours (600 minutes). To change this, click Session Timeout and enter a different value.
Fail Mode
Select the behavior of the ThreatSpect engine if it is overloaded or fails during inspection. For example, if the Anti-Bot inspection is terminated in the middle because of an internal failure. By default, in such a situation all traffic is allowed.
- - All connections are allowed in a situation of engine overload or failure (default).
- - All connections are blocked in a situation of engine overload or failure.
Managing Traditional Anti-Virus
Traditional Anti-Virus refers to inspection using these detection modes:
- Proactive mode - a file-based solution where traffic for the selected protocols is trapped in the kernel and forwarded to the security server. The security server forwards the data stream to the Traditional Anti-Virus engine. The data is allowed or blocked based on the response of the Traditional Anti-Virus engine.
- Stream mode - where traffic for the selected protocols is processed in the kernel on the stream of data without storing the entire file. The data is allowed or blocked based on the response of the kernel.
The POP3 and FTP protocols work only in Proactive mode. The SMTP and HTTP protocols can be configured to work in either Proactive or Stream mode. Anti-Virus scanning is applied only to accepted traffic that has been allowed by the security policy.
Use the instructions in this section to configure Traditional Anti-Virus in your system.
Enabling Traditional Anti-Virus
The Anti-Virus blade and traditional Anti-Virus can be activated on Security Gateways in your system.
|
Note - You cannot activate the Anti-Virus blade and Traditional Anti-Virus on the same Security Gateway.
|
To configure traditional Anti-Virus:
- On the tab, double-click the required Security Gateway network object.
- Select > > .
- Click .
- Define rules in the Rule Base to permit specific services. Anti-Virus scanning is applied only to accepted traffic.
- From tab > , select the services to scan using these options:
- From the page, configure when to perform automatic signature updates or initiate a manual signature update.
- From the > pages, configure Anti-Virus scanning options for , , , , , and services.
- From the > page, configure the options to scan, block or pass traffic according to the file type and configure continuous download options.
- From the > page, configure options for file handling and scan failures.
Database Updates
The following kinds of database updates are available:
- Automatic: Updates of the virus signature can be scheduled at a predefined interval.
- Manual: Updates of virus signatures can be initiated at any time.
Download updates from a Check Point server prior to downloading signature updates. First verify that:
- HTTP and HTTPs Internet connectivity with DNS is properly configured.
- You have a valid Check Point User Center user name and password.
The following signature update methods are available (the default update interval is 120 minutes for all methods):
- Download signature updates every x minutes: Enables you to define the update interval.
- Download from Check Point site: Indicates that each Security Gateway is responsible for contacting Check Point's site to obtain Traditional Anti-Virus signatures. Updates are downloaded directly to the CI gateways. This method usually results in faster update times.
- Download from My local Security Management server: Indicates that updates are only downloaded by the Security Management server from the default Check Point signature distribution server and then redistributed all CI gateways. This method is useful when Internet access is not available for all gateways or if the download can only occur once for all the gateways.
Understanding Traditional Anti-Virus Scanning Options
Understanding Scan By File Direction and Scan By IPs
Definitions
Scan by File Direction and Scan by IPs are two file scanning methods used by Content Inspection. Traditional Anti-Virus scanning is performed only on traffic that is allowed by the Security Rule Base.
Scan By File Direction
Scan by File Direction scans all files passing in one direction, either to or from the external, internal and/or DMZ networks. Using this method (the default) is fairly intuitive and does not require the specification of hosts or networks. This method also enables you to define exceptions, for example, locations to or from which files are not scanned.
Scan By IP Address
Scan by IPs enables you to define which traffic is scanned. For example, if all incoming traffic from external networks reaches the DMZ using Scan by IPs, you can configure CE to scan only traffic to the FTP, SMTP, HTTP and POP3 servers. Conversely, Scan by File Direction scans all traffic to the DMZ.
When using Scan by IPs, use a Rule Base to specify the source and destination of the data to be scanned. For FTP, for each rule, you can scan either the GET or the PUT methods, or both. For HTTP, for each rule, you can scan either the HTTP Request, the HTTP Response or both.
Comparing Scan by File Direction and by IPs
Scan by File Direction enables you to specify file scanning according to the file's (and not necessarily the connection's) origin and destination.
Scan by IPs enables you to specify file scanning according to the connection they are sent through and the protocol phase/command (where applicable).
If you want most or all files in a given direction to be Traditional Anti-Virus scanned, select Scan by File Direction.
If you want to specify a connection or part of a connection's source or destination to be scanned, select Scan by IPs.
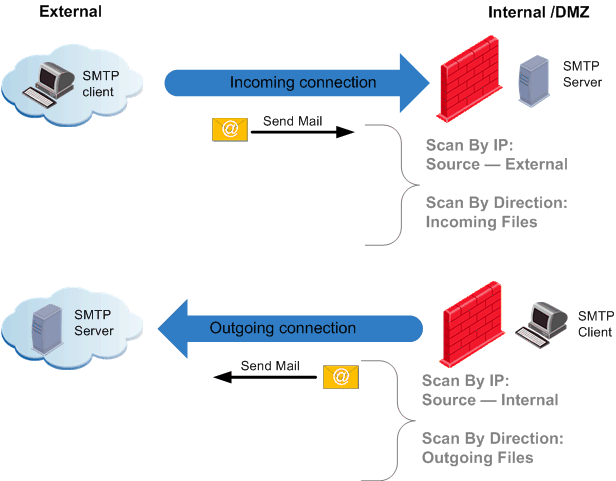
Comparing Scan by File Direction and by IPs for SMTP Protocol
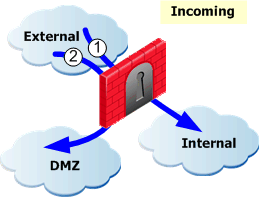
For the SMTP protocol, Scan by File Direction and Scan by IPs are comparable options. The next figure illustrates that for the SMTP protocol, the files (data) are always sent in the same direction as the connection. The SMTP protocol is used to send mail. Protocols that are used to receive mail (for example, POP3 and IMAP) are not scanned when SMTP is selected.
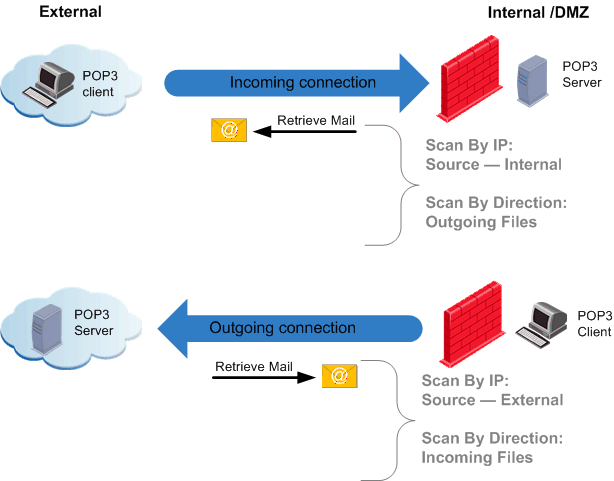
Comparing Scan by File Direction and by IPs for POP3 Protocol
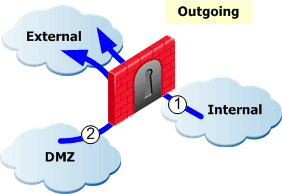
The next figure illustrates that POP3 data files are always sent in the opposite direction of the connection.
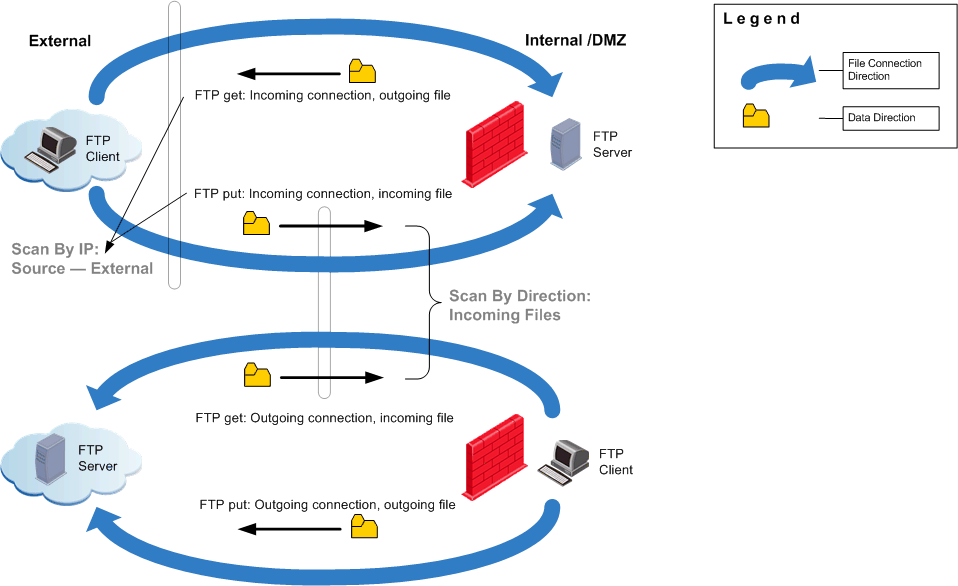
Comparing Scan by File Direction and by IPs for FTP Protocol
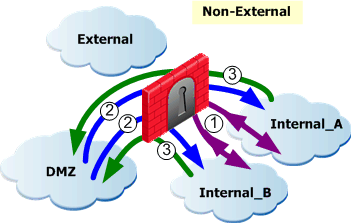
For the FTP protocol, the difference between Scan by IPs and Scan by File Direction is illustrated in the next figure. When the FTP GET command is used, files are transferred in the opposite direction to the connection. When the FTP PUT command is used, files are transferred in the same direction as the connection. In this scenario, the Scan by File Direction option enables you to scan files without having to consider the direction of the connection.
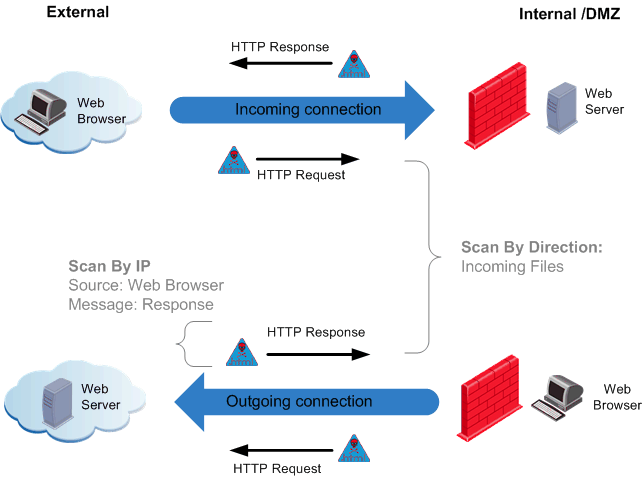
Comparing Scan by File Direction and by IPs for HTTP Protocol
For the HTTP protocol, the difference between Scan by IPs and Scan by File Direction is illustrated in the next figure. Using Scan by IP, the source and destination of the connection are specified and whether the Request, Response or both is scanned.
Scanning by File Direction: Selecting Data to Scan
When using Scan by File Direction, you must select the direction of the data to scan, which depends on whether you want to scan files to or from the internal networks and the DMZ.
What is a DMZ?
The DMZ (demilitarized zone) is an internal network with an intermediate level of security. Its security level lies between trusted internal networks, such as a corporate LAN, and non-trusted external networks, such as the Internet.
Typically, the DMZ contains devices accessible to Internet traffic, for example, Web (HTTP), FTP, SMTP (email), DNS and POP3 servers.
Scan By File Direction enables you to define a level of Traditional Anti-Virus scanning that is specific to the DMZ. For example, you can decide not to scan traffic passing from external networks to the DMZ, but to still scan traffic passing from the DMZ to internal networks and from the external to internal networks.
Scan By File Direction Options
The following Scan By File Direction options are available:
- Incoming files arriving to: Files arriving from external interfaces: the internal networks (1), the DMZ (2) and the DMZ and internal networks (1 and 2).
- Outgoing files leaving: Files leaving through external interfaces: the internal networks (1), the DMZ (2) and the DMZ and internal networks (1 and 2).
- Internal files: If there is no DMZ, files passing between all internal networks (1). If there is a DMZ, files passing between the DMZ and internal networks and files passing between all internal networks (between internal networks (1), from the DMZ to internal networks (2) and from internal networks to the DMZ (3)).
Understanding Proactive and Stream Mode Detection
Traditional Anti-Virus scanning can be enabled in either the proactive or stream detection mode.
- Proactive detection mode - a comprehensive, file-based Traditional Anti-Virus solution where traffic for the selected protocols is trapped in the kernel of the Security Gateway and forwarded to the security server for scanning. It detects not only known viruses, but also zero-day attacks, by using advanced proactive techniques.
This mode uses sandboxes and heuristics to detect malicious code throughout the traffic as opposed to passive signature based detection. Scanned data is either allowed or blocked based on the response of the state-of-the-art Traditional Anti-Virus engine.
Proactive detection provides a high level of protection but has an impact on performance. The FTP and POP3 protocols only work in Proactive mode.
This mode is not available for Virtual System gateways.
- Stream detection mode - where traffic is scanned for viruses as it passes through the network on streams of data, without storing entire files and without causing an impact on performance. The SMTP and HTTP protocols can be set to work in either mode.
This mode is based on state-of-the-art virus signatures that are frequently updated in order to detect recent Malware outbreaks.
In newly installed systems, stream mode is activated by default.
In upgraded systems, the detection mode that is activated by default is dependent upon whether the Traditional Anti-Virus feature was previously activated or not.
- In upgraded systems that previously used the Traditional Anti-Virus scanning feature, proactive detection is activated by default.
- In upgraded systems that previously did not use the Traditional Anti-Virus scanning feature, stream mode detection is activated by default.
You can configure which detection mode to use from SmartDashboard for the SMTP and HTTP protocols.
Continuous Download
The Traditional Anti-Virus engine acts as a proxy which caches the scanned file before delivering it to the client for files that need to be scanned.
When scanning large files, if the whole file is scanned before being made available, the user may experience a long delay before the file is delivered. A similar problem may arise when using client applications with short timeout periods (for example, certain FTP clients) to download large files. If the whole file is cached and scanned before being delivered, the client applications may time out while waiting.
To address this problem, Continuous Download starts sending information to the client while Traditional Anti-Virus scanning is still taking place. If a virus is found during the scan, file delivery to the client is terminated.
|
Note - Continuous Download is only relevant if you have selected to use the Activate proactive detection option.
|
You can specify the file types for which you do not want Continuous Download to occur. Some file types (for example, Adobe Acrobat PDF and Microsoft Power Point files) can open on a client computer before the whole file has been downloaded. If Continuous Download is allowed for those file types, and a virus is present in the opened part of the file, it could infect the client computer.
|
Note - The SMTP and POP3 protocols support Continuous Download for the entire email message.
|
File Type Recognition
IPS has a built-in File Type recognition engine, which identifies the types of files passed as part of the connection and enables you to define a per-type policy for handling files of a given type.
You can specify safe file types that are allowed to pass through IPS without being scanned for viruses. It is also possible to configure file types to be scanned or blocked.
The following file types can be configured:
- Scan: Performs Traditional Anti-Virus file scanning according to the settings in the different services pages. By default, all unrecognized file types are scanned.
- Block: Does not allow passage of file types that are preset for blocking according to IPS advisories.
- Pass: Allows files to pass though the Security Gateway without being scanned for viruses. Files specified as this type are considered to be safe.
File types are considered to be safe if they are not known to contain viruses, for example, some picture and video files are considered safe. Other formats are considered to be safe because they are relatively hard to tamper with. What is considered to be safe changes according to published threats and depends on how the administrator balances security versus performance considerations.
IPS reliably identifies binary file types by examining the file type signatures (magic numbers). IPS does not rely on the file extension (such as *.GIF), which can be spoofed. It also does not use the MIME headers (such as image/gif) in HTTP and mail protocols, which can also be spoofed.
Configuring Traditional Anti-Virus \\ Ferrari ?
For detailed explanations regarding the options described in the procedures in this section, see Understanding Traditional Anti-Virus Scanning Options.
Configuring Mail Traditional Anti-Virus
The Mail Traditional Anti-Virus policy prevents email from being used as a virus delivery mechanism.
- In the Traditional Anti-Virus tab, click Traditional Anti-Virus > Security Gateway > Mail Protocols > Mail Traditional Anti-Virus.
- Set the slider to Block.
- Select tracking options for either all POP3 and SMTP mail, or just blocked mail. Tracking options include:
- None (no logging)
- Log
- Popup alert
- Mail alert
- SNMP trap alert
- Three custom user-defined scripts
Configuring Zero Hour Malware
By proactively scanning the Internet, the Data Center identifies massive virus outbreaks as soon as they occur. This Zero-Hour solution provides protection during the critical time it takes to discover a new virus outbreak and assign it a signature.
- In the Traditional Anti-Virus tab, click Traditional Anti-Virus > Security Gateway > Mail Protocols > Zero Hour Malware Protection.
- Using the slider, select a Zero hour malware protection level:
- Select tracking options for blocked, SMTP and POP3 mail. Tracking options include:
- None (no logging)
- Log
- Popup alert
- Mail alert
- SNMP trap alert
- Three custom user-defined scripts
Configuring SMTP, POP3, FTP and HTTP
SMTP and POP3 traffic can be scanned according to direction or by IPs.
- In the Traditional Anti-Virus tab, click Traditional Anti-Virus > Security Gateway > Mail Protocols > SMTP, POP3, FTP or HTTP.
- Using the slider, select a protection level:
- Off
- Monitor Only - SMTP and HTTP are the only protocols that support this protection level
- Block
- When scanning by File Direction, select a scanning direction for:
- Incoming files
- Outgoing files
- Internal files through the gateway
- When scanning by IPs, create rules for the Rule Base to specify the source and destination of the data to be scanned.
- For SMTP and HTTP, select the Activate Proactive Detection (impacts performance) checkbox to enable file-based Traditional Anti-Virus detection. Clear the checkbox to enable stream mode detection. See Understanding Proactive and Stream Mode Detection for further information. FTP and POP3 are set to Proactive Detection mode automatically.
- If Proactive Detection has been configured, select the Activate Continuous Download checkbox to avoid client time-outs when large files are scanned.
See Continuous Download for further information.
Configuring File Types \\ Ferrari ?
You can set an action to take place when a file of a certain type passes through the gateway. Certain file types can pass through the gateway without being scanned for viruses. For example, picture and video files are normally considered safe. Other formats can be considered safe because they are relatively hard to tamper with. Update the list as necessary.
- In the Anti-Spam tab, click Traditional Anti-Virus > Security Gateway > File Types page and set the actions. See File Type Recognition for more information.
In this window, you can also configure Continuous Download options. Continuous Download options are only relevant if scanning is set to Proactive Detection. See Continuous Download for more information.
Configuring Security Gateway Settings
In Traditional Anti-Virus tab, click Traditional Anti-Virus > Security Gateway > Mail Protocols > Settings you can configure scan failure settings and Proactive scan settings (file handling and archive file handling).
Scan Failure
The following scan failure options are available:
- When Traditional Anti-Virus engine is overloaded or scan fails: Determines whether to scan or block the file.
- When Traditional Anti-Virus engine fails to initialize: Determines whether to scan or block the file.
File Handling
The following file handling options are available:
- Maximum file size to scan: Limits the file size that is allowed to pass through the gateway. If the file is a compressed archive, the limit applies to the file after decompression (the Traditional Anti-Virus engine decompresses archives before scanning them). Before performing Traditional Anti-Virus scanning, the gateway reassembles the entire file and then scans it. The limit protects the gateway resources and the destination client.
An archive is a file that contains one or more files in a compressed format. Archives (and all other file types) are recognized by their binary signature. By default, any file type that is not identified as non-archive is assumed to be an archive and the Traditional Anti-Virus engine tries to expand it. - When file exceeds limit: Determines whether to scan or block the file.
|
Note - An email is treated as an archive and as a result it is not affected when the file exceeds the limit.
|
Archive File Handling
The following file handling archiving options are available:
- Maximum archive nesting level: Limits the number of nested archives (one within another). This limit protects the gateway and destination client from attacks that employ deep nesting levels.
- Maximum compression ratio: Prevents attacks that employ a small size archive that decompresses into a very large file on target.
- When archive file exceeds limit or extraction fails: Determines whether to scan or block the file.
Logging and Monitoring
Logging information on the Traditional Anti-Virus scan is sent to the Security Management server and can be viewed using SmartView Tracker. Scan results information is shown in the logs. In addition, there are logs for signature updates, new update checks, and download results.
The Traditional Anti-Virus status is monitored using SmartView Monitor. The Traditional Anti-Virus status appears under the Firewall product. The status contains information on the currently installed signature file and the Traditional Anti-Virus engine version. The Traditional Anti-Virus status also includes statistics about scanned files and found viruses.
UTM-1 Edge Traditional Anti-Virus
You can now enable Traditional Anti-Virus protection within UTM-1 Edge. Selecting the Enable Traditional Anti-Virus option indicates that Traditional Anti-Virus protection is installed and that updates are sent to the specified gateway.
Using UTM-1 Edge Traditional Anti-Virus, you can define the maximum archive file sizes for UTM-1 Edge machines that are scanned, and configure procedures for when these limits are exceeded and/or the scan fails.
The UTM-1 Edge Traditional Anti-Virus feature enables you to automatically or manually update virus signatures for UTM-1 Edge machines and provides you with the tools to configure how UTM-1 Edge traffic is scanned.
|
Note - It is important to configure a valid DNS server address on your management and gateway in order for the signature update to work.
|
The UTM-1 Edge Traditional Anti-Virus scanning policy enables you to select the service(s) to and from which a source and/or destination is scanned. Files set for scanning is determined using a classic Rule Base, which defines the source and destination of the connection to be scanned. It is recommended to use this method if you want to define exactly which traffic to scan, for example, if all incoming traffic from external networks reaches the DMZ, you can specify that only traffic to the Traditional Anti-Virus servers is scanned.
To enable and configure Traditional Anti-Virus protection:
- From the General Properties tab of the UTM-1 Edge gateway, select the > > .
- In the Edge Traditional Anti-Virus section of the Traditional Anti-Virus tab, configure Traditional Anti-Virus to work on UTM-1 Edge gateways. All of the Traditional Anti-Virus settings in the Traditional Anti-Virus tab do not work for UTM-1 Edge machines. The Edge Traditional Anti-Virus settings in the Traditional Anti-Virus tab only work for UTM-1 Edge machines.
HTTP Inspection on Non-Standard Ports
Applications that use HTTP normally send the HTTP traffic on TCP port 80. Some applications send HTTP traffic on other ports also. You can configure some Software Blades to only inspect HTTP traffic on port 80, or to also inspect HTTP traffic on non-standard ports.
When selected, the Anti-Bot and Anti-Virus policy inspects all HTTP traffic, even if it is sent using nonstandard ports. This option is selected by default. You can configure this option in the tab > pane.
HTTPS Inspection
You can enable HTTPS traffic inspection on Security Gateways to inspect traffic that is encrypted by the Secure Sockets Layer (SSL) protocol. SSL secures communication between internet browser clients and web servers. It supplies data privacy and integrity by encrypting the traffic, based on standard encryption ciphers.
However, SSL has a potential security gap. It can hide illegal user activity and malicious traffic from the content inspection of Security Gateways. One example of a threat is when an employee uses HTTPS (SSL based) to connect from the corporate network to internet web servers. Security Gateways without HTTPS Inspection are unaware of the content passed through the SSL encrypted tunnel. This makes the company vulnerable to security attacks and sensitive data leakage.
The SSL protocol is widely implemented in public resources that include: banking, web mail, user forums, and corporate web resources.
There are two types of HTTPS inspection:
- - To protect internal servers from malicious requests originating from the internet or an external network.
- - To protect an organization from malicious traffic being sent by an internal client to a destination outside of the organization.
The Security Gateway acts as an intermediary between the client computer and the secure web site. The Security Gateway behaves as the client with the server and as the server with the client using certificates.
All data is kept private in HTTPS Inspection logs. This is controlled by administrator permissions. Only administrators with HTTPS Inspection permissions can see all the fields in a log. Without these permissions, some data is hidden.
How it Operates
In outbound HTTPS inspection, when a client in the organization initiates an HTTPS connection to a secure site, the Security Gateway:
- Intercepts the request.
- Establishes a secure connection to the requested web site and validates the site's server certificate.
- Creates a new SSL certificate for the communication between the Security Gateway and the client, sends the client the new certificate and continues the SSL negotiation with it.
- Using the two SSL connections:
- It decrypts the encrypted data from the client.
- Inspects the clear text content for all blades set in the policy.
- Encrypts the data again to keep client privacy as the data travels to the destination web server resource.
In inbound HTTPS inspection, when a client outside of the organization initiates an HTTPS connection to a server behind the organization's gateway, the Security Gateway:
- Intercepts the request.
- Uses the server's original certificate and private key to initiate an SSL connection with the client.
- Creates and establishes a new SSL connection with the web server.
- Using the two SSL connections:
- It decrypts the encrypted data from the client.
- Inspects the clear text content for all blades set in the policy.
- Encrypts the data again to keep client privacy as the data travels to the destination server behind the gateway.
Configuring Outbound HTTPS Inspection
To enable outbound HTTPS traffic inspection, you must do these steps:
- Set the Security Gateway for HTTPS Inspection.
- Generate a CA certificate on the Security Management Server or import a CA certificate already deployed in your organization.
- If you created a CA certificate, you must deploy it in the on the client computers. This lets the client computers trust all certificates signed by this certificate.
- Generate an HTTPS inspection policy by defining relevant rules in the HTTPS inspection Rule Base.
- Configure the conditions for dropping traffic from a web site server.
When required, you can update the trusted CA list in the Security Gateway.
Enabling HTTPS Inspection
You must enable HTTPS inspection on each gateway. From > > > Select .
The first time you enable HTTPS inspection on one of the gateways, you must create an outbound CA certificate for HTTPS inspection or import a CA certificate already deployed in your organization. This outbound certificate is used by all gateways managed on the Security Management Server.
Creating an Outbound CA Certificate
The outbound CA certificate is saved with a P12 file extension and uses a password to encrypt the private key of the file. The gateways use this password to sign certificates for the sites accessed. You must keep the password as it also used by other Security Management Servers that import the CA certificate to decrypt the file.
After you create an outbound CA certificate, you must export it so it can be distributed to clients. If you do not deploy the generated outbound CA certificate on clients, users will receive SSL error messages in their browsers when connecting to HTTPS sites. You can configure a troubleshooting option that logs such connections.
After you create the outbound CA certificate, a certificate object named Outbound Certificate is created. Use this in rules that inspect outbound HTTPS traffic in the HTTPS inspection Rule Base.
To create an outbound CA certificate:
- In SmartDashboard, right-click the gateway object and select Edit.
The Gateway Properties window opens.
- In the navigation tree, select .
- In the HTTPS Inspection page, click .
- Enter the necessary information:
- - Enter the domain name of your organization.
- - Enter the password that is used to encrypt the private key of the CA certificate.
- - Retype the password.
- - Select the date range for which the CA certificate is valid.
- Click .
- Export and deploy the CA certificate.
Importing an Outbound CA Certificate
You can import a CA certificate that is already deployed in your organization or import a CA certificate created on one Security Management Server to use on another Security Management Server.

|
Important - If you are importing a CA certificate created on another Security Management Server, make sure the initial certificate was exported from the Security Management Server on which it was created.
|
For each Security Management Server that has Security Gateways enabled with HTTPS inspection, you must:
- Import the CA certificate.
- Enter the password the Security Management Server uses to decrypt the CA certificate file and sign the certificates for users. This password is only used when you import the certificate to a new Security Management Server.
|
Important - After you import a certificate from another Security Management Server, make sure to export the certificate and deploy it on the client machines if it has not already been deployed.
|
To import a CA certificate:
- In SmartDashboard, right-click a gateway object, select > >
Or
From the > pane of a supported blade, click the arrow next to Create Certificate and select .
The Import Outbound Certificate window opens.
- Browse to the certificate file.
- Enter the .
- Click .
Exporting a Certificate from the Security Management Server
If you use more than one Security Management Server in your organization, you must first export the CA certificate using the export_https_cert CLI command from the Security Management Server on which it was created before you can import it to other Security Management Servers.
Usage:
export_https_cert [-local] | [-s server] [-f certificate file name under FWDIR/tmp][-help]
To export the CA certificate:
Exporting and Deploying the Generated CA
To prevent users from getting warnings about the generated CA certificates that HTTPS inspection uses, install the generated CA certificate used by HTTPS inspection as a trusted CA. You can distribute the CA with different distribution mechanisms such as Windows GPO. This adds the generated CA to the trusted root certificates repository on client machines.
When users do standard updates, the generated CA will be in the CA list and they will not receive browser certificate warnings.
To distribute a certificate with a GPO:
- From the window of the Security Gateway, click
Or
From the > pane in a supported blade, click .
- Save the CA certificate file.
- Use the Group Policy Management Console to add the certificate to the Trusted Root Certification Authorities certificate store.
- Push the policy to the client machines in the organization.
|
Note - Make sure that the CA certificate is pushed to the client machines' organizational unit.
|
- Test the distribution by browsing to an HTTPS site from one of the clients and verifying that the CA certificate shows the name you entered for the CA certificate that you created in the field.
Deploying Certificates by Using Group Policy
You can use this procedure to deploy a certificate to multiple client machines by using Active Directory Domain Services and a Group Policy object (GPO). A GPO can contain multiple configuration options, and is applied to all computers that are within the scope of the GPO.
Membership in the local Administrators group, or equivalent, is necessary to complete this procedure.
To deploy a certificate using Group Policy:
- Open the Group Policy Management Console.
- Find an existing GPO or create a new GPO to contain the certificate settings. Make sure the GPO is associated with the domain, site, or organization unit whose users you want affected by the policy.
- Right-click the GPO and select .
The Group Policy Management Editor opens and shows the current contents of the policy object.
- Open > > > > .
- Click > .
- Do the instructions in the to find and import the certificate you exported from SmartDashboard.
- In the navigation pane, click and repeat steps 5-6 to install a copy of the certificate to that store
Configuring Inbound HTTPS Inspection
To enable inbound HTTPS traffic inspection, you must do these steps:
- Set the Security Gateway for HTTPS Inspection (if it is not already configured). From > > > Select .
- Import server certificates for servers behind the organizational gateways.
- Generate an HTTPS inspection policy by defining relevant rules in the HTTPS inspection Rule Base.
- Make sure to configure the relevant server certificate in the HTTPS inspection Rule Base.
Server Certificates
When a client from outside the organization initiates an HTTPS connection to an internal server, the Security Gateway intercepts the connection. The Security Gateway inspects the inbound traffic and creates a new HTTPS connection from the gateway to the internal server. To allow seamless HTTPS inspection, the Security Gateway must use the original server certificate and private key.
For inbound HTTPS inspection, do these steps:
- Add the server certificates to the Security Gateway - This creates a server certificate object.
- Add the server certificate object to the column in the HTTPS Inspection Policy to enforce it in rules.
The Server Certificates window in SmartDashboard includes these options:
- - Import a new server certificate. Enter a name for the server certificate, optional comment and import the P12 certificate file.
- - Delete a previously added server certificate. This option does not delete the server certificate option, it only removes it from the Server Certificate list.
- - Enter a key word to search for a server certificate in the list.
Adding a Server Certificate
When you import a server certificate, enter the same password that was entered to protect the private key of the certificate on the server. The Security Gateway uses this certificate and the private key for SSL connections to the internal servers.
After you import a server certificate (with a P12 file extension) to the Security Gateway, make sure you add the object to the HTTPS Inspection Policy.
Do this procedure for all servers that receive connection requests from clients outside of the organization.
To add a server certificate:
- In SmartDashboard, open > .
- Click .
The Import Certificate window opens.
- Enter a and a (optional).
- Browse to the certificate file.
- Enter the .
- Click .
The Successful Import window opens the first time you import a server certificate. It shows you where to add the object in the HTTPS Inspection Rule Base. Click if you do not want to see the window each time you import a server certificate and .
The HTTPS Inspection Policy
The HTTPS inspection policy determines which traffic is inspected. The primary component of the policy is the Rule Base. The rules use the categories defined in the Application Database, network objects and custom objects (if defined).
The HTTPS Rule Base lets you inspect the traffic on other network blades. The blades that HTTPS can operate on are based on the blade contracts and licenses in your organization and can include:
- Application Control
- URL Filtering
- IPS
- DLP
- Anti-Virus
- Anti-Bot
If you enable Identity Awareness on your gateways, you can also use Access Role objects as the source in a rule. This lets you easily make rules for individuals or different groups of users.
To access the HTTPS inspection Rule Base:
- In SmartDashboard, open the Policy page from the specified blade tab:
- For Application and URL Filtering, Anti-Bot, Anti-Virus, and IPS - Select > > .
- For DLP - Select > >.
Predefined Rule
When you enable HTTPS inspection, a predefined rule is added to the HTTPS Rule Base. This rule defines that all HTTPS and HTTPS proxy traffic from any source to the internetis inspected on all blades enabled in the Blade column. By default, there are no logs.
Parts of the Rule
The columns of a rule define the traffic that it matches and if that traffic is inspected or bypassed. When traffic is bypassed or if there is no rule match, the traffic continues to be examined by other blades in the gateway.
Number (No.)
The sequence of rules is important because the first rule that matches is applied.
For example, if the predefined rule inspects all HTTPS traffic from any category and the next rule bypasses traffic from a specified category, the first rule that inspects the traffic is applied.
Name
Give the rule a descriptive name. The name can include spaces.
Double-click in the Name column of the rule to add or change a name.
Source
The source is where the traffic originates. The default is Any.
|
Important - A rule that blockstraffic, with the and parameters defined as , also blocks traffic to and from the Captive Portal.
|
Put your mouse in the column and a plus sign shows. Click the plus sign to open the list of network objects and select one or multiple sources. The source can be an Access Role object, which you can define when Identity Awareness is enabled.
Destination
Choose the destination for the traffic. The default is the , which includes all traffic with the destination of DMZ or external. If you delete the destination value, the rule changes to , which applies to traffic going to all destinations
|
Important - A rule that blockstraffic, with the and parameters defined as , also blocks traffic to and from the Captive Portal.
|
To choose other destinations, put your mouse in the column and a plus sign shows. Click the plus sign to open the list of network objects and select one or multiple destinations.
Services
By default, HTTPS traffic on port 443 and HTTP and HTTPS proxy on port 8080 is inspected. You can include more services and ports in the inspection by adding them to the services list.
To select other HTTPS/HTTP services, put your mouse in the column and a plus sign shows. Click the plus sign to open the list of services and select a service. Other services, such as SSH are not supported.
Site Category
The Site Category column contains the categories for sites and applications that users browse to and you choose to include. One rule can include multiple categories of different types.
|
Important -
- A valid URL Filtering blade contract and license are necessary on the relevant Security Gateways to use the Site Category column.
- To perform categorization correctly, a single connection to a site must be inspected in some cases regardless of the HTTPS inspection policy. This maps the IP address of a site to the relevant domain name.
|
You can also include custom applications, sites, and hosts. You can select a custom defined application or site object with the Custom button or create a new host or site with the New button at the bottom of the page.
|
Note - You can only use custom objects that specify the domain name or host part of a URL. URLs that contain paths are not supported. For example, you can use an object defined as ww.gmail.com but not www.gmail.com/myaccount.
|
To add site categories to a rule:
Put your mouse in the column and a plus sign shows. Click the plus sign to open the Category viewer. For each category, the viewer shows a description and if there are applications or sites related with it.
- To filter the Available list by categories or custom-defined sites, click the specified button in the toolbar of the viewer. The Available list opens in the left column and then you can add items to the rule.
- To add a category object to the rule, click the checkbox in the Available list.
- To see the details of category without adding it to the rule, click the name of the item in the Available list.
- You can only select a category to add to the rule from the Available list.
- If a category is already in a rule, it will not show in the Category viewer.
- If you know the name of a category, you can search for it. The results will show in the Available list.
- You can add a new host site with the New button.
Adding a New Host Site
You can create a new host site object to use in the HTTPS Rule Base if there is no corresponding existing category. Only the domain name part or hosts part of the URL is supported.
To create a new host site:
- Click the plus icon in the Site Category column.
- In the Category viewer, select .
The window opens.
- Enter a name for the host site.
- Set a color for the host site icon (optional).
- Enter a comment for the host site (optional).
- In , enter a valid URL and click .
- If you used a regular expression in the URL, click .
- Click .
The new host site is added to the list and can be added to the Rule Base.
Action
The action is what is done to the traffic. Click in the column to see the options and select one to add to the rule.
- - The traffic is inspected on the blades set in the column.
- - The traffic of source and destination traffic in rules that include the bypass action are not decrypted and inspected. You can bypass HTTPS inspection for all Check Point objects. This is recommended for Anti-Bot, Anti-Virus, URL Filtering, and IPS updates. Other HTTPS protections that already operate on traffic will continue to work even when the HTTPS traffic is not decrypted for inspection.
Track
Choose if the traffic is logged in SmartView Tracker or if it triggers other notifications. Click in the column and the options open. The options include:
- - Does not record the event
- - Records the event's details in SmartView Tracker. This option is useful for obtaining general information on your network's traffic. There is one or more log for each session depending on the suppression option.
- - Logs the event and executes a command, such as display a popup window, send an email alert or an SNMP trap alert, or run a user-defined script as defined in >>>
- - Sends an email to the administrator, or runs the mail alert script defined in >>>
- - Sends a SNMP alert to the SNMP GUI, or runs the script defined in >>>
- - Sends one of three possible customized alerts. The alerts are defined by the scripts specified in >>>
Blade
Choose the blades that will inspect the traffic. Click in the column and the options open. The options include:
- Application Control
- Data Loss Prevention
- IPS
- URL Filtering
- Anti-Virus
- Anti-Bot
|
Important - The blade options you see are based on the blade contracts and licenses in your organization.
|
Install On
Choose which gateways the rule will be installed on. The default is All, which means all gateways that have HTTPS inspection enabled. Put your mouse in the column and a plus sign shows. Click the plus sign to open the list of available gateways and select.
Certificate
Choose the certificate that is applicable to the rule. The Security Gateway uses the selected certificate for communication between the Security Gateway and the client.
- - choose the object (default) that reflects the CA certificate you created/imported and deployed on the client machines in your organization.
- - choose the server certificate applicable to the rule. Put your mouse in the column and a plus sign shows. Click the plus sign to open the list of available server certificates and select one. When there is a match to a rule, the Security Gateway uses the selected server certificate to communicate with the source client. You can create server certificates from > > .
Bypassing HTTPS Inspection to Software Update Services
Check Point dynamically updates a list of approved domain names of services from which content is always allowed. This option makes sure that Check Point updates or other 3rd party software updates are not blocked. For example, updates from Microsoft, Java, and Adobe.
To bypass HTTPS inspection to software updates:
- In the HTTPS Inspection > Policy pane, select. This option is selected by default.
- Click to see the list of approved domain names.
Gateways Pane
The Gateways pane lists the gateways with HTTPS Inspection enabled. Select a gateway and click Edit to edit the gateway properties. You can also search, add and remove gateways from here.
For each gateway, you see the gateway name, IP address and comments.
In the CA Certificate section, you can the certificate's validity date range if necessary and it for distribution to the organization's client machines.
If the Security Management Server managing the selected gateway does not have a generated CA certificate installed on it, you can add it with . There are two options:
- You can import a CA certificate already deployed in your organization.
- You can import a CA certificate from another Security Management Server. Before you can import it, you must first export it from the Security Management Server on which it was created.
Adding Trusted CAs for Outbound HTTPS Inspection
When a client initiates an HTTPS connection to a web site server, the Security Gateway intercepts the connection. The Security Gateway inspects the traffic and creates a new HTTPS connection from the gateway to the designated server.
When the Security Gateway establishes a secure connection (an SSL tunnel) to the designated web site, it must validate the site's server certificate.
HTTPS Inspection comes with a preconfigured list of trusted CAs. This list is updated by Check Point when necessary and is automatically downloaded to the Security Gateway. The system is configured by default to notify you when a Trusted CA update file is ready to be installed. The notification in SmartDashboard shows as a pop-up notification or in the window in the Automatic Updates section. After you install the update, make sure to install the policy. You can choose to disable the automatic update option and manually update the Trusted CA list.
If the Security Gateway receives a non-trusted server certificate from a site, by default the user gets a self-signed certificate and not the generated certificate. A page notifies the user that there is a problem with the website's security certificate, but lets the user continue to the website.
You can change the default setting to block untrusted server certificates.
The trusted CA list is based on the Microsoft Root Certificate Program.
Automatically Updating the Trusted CA List and Certificate Blacklist
Updates for the trusted CA list and Certificate Blacklist will be published from time to time on the Check Point web site. They are automatically downloaded to the Security Management Server by default. When you are sent a notification that there is an update available, install it and do the procedure. The first notification is shown in a popup balloon once and then in the notification line under > . You can disable automatic updates if necessary.
To update the Trusted CA list and Certificate Blacklist:
- In SmartDashboard, select > .
- In the section, click .
You see the certificates that will be added or removed to the lists and the validity date range of the certificates added to the Trusted CA list.
- Click to confirm the update.
The certificates will be added or removed respectively from the lists.
- Install the policy.
To disable automatic updates:
- In SmartDashboard, select > .
- In the section, clear the checkbox.
Manually Updating a Trusted CA
To add a trusted CA manually to the Security Gateway, you must export the necessary certificate from a non-trusted web site and then import it into SmartDashboard.
To export a CA certificate to add to the Trusted CAs list:
- Temporarily disable HTTPS inspection on the Security Gateway.
- Install the security policy.
- Browse to the site to get the certificate issued by the CA.
- Go to the Certification Path of the certificate.
- Select the root certificate (the top most certificate in the list).
- In Internet Explorer and Chrome:
- Click .
- From the Details tab, click .
- Follow the wizard steps.
- In Firefox, export the certificate.
To import a CA certificate to the Trusted CAs list:
- In SmartDashboard, open >.
- Click ,browse to the location of the saved certificate and click .
The certificate is added to the trusted CAs list.
- Install the security policy on gateways enabled with HTTPS Inspection.
Saving a CA Certificate
You can save a selected certificate in the trusted CAs list to the local file system.
To export a CA certificate:
- In SmartDashboard, open > .
- Click > .
- Browse to a location, enter a file name and click .
A CER file is created.
HTTPS Validation
Server Validation
When a Security Gateway receives an untrusted certificate from a web site server, the settings in this section define when to drop the connection.
Certificate Blacklisting
You can create a list of certificates that are blocked. Traffic from servers using the certificates in the blacklist will be dropped. If a certificate in the blacklist is also in the Trusted CAs list, the blacklist setting overrides the Trusted CAs list.
Troubleshooting
Secure connections between a client and server with no traffic create logs in SmartView Tracker labeled as "Client has not installed CA certificate". This can happen when an application or client browser fails to validate the server certificate. Possible reasons include:
- The generated CA was not deployed on clients.
- The DN in the certificate does not match the actual URL (for example, when you browse to https://www.gmail.com, the DN in the certificate states mail.google.com).
- Applications (such as FireFox and anti-viruses) that use an internal trusted CAs list (other than Windows). Adding the CA certificate to the Windows repository does not solve the problem.
The option in the HTTPS Validation pane:
- When selected, logs are recorded for secure connections between a client and server with no traffic in SmartView Tracker (default). Logs are recorded only when a server certificate is trusted by the Security Gateway. If the server certificate is untrusted, a self-signed certificate is created and always results in a log labeled as "Client has not installed CA certificate".
- When cleared, logs are not recorded for secure connections without traffic that can be caused by not installing the CA certificate on clients or one of the above mentioned reasons.
HTTP/HTTPS Proxy
You can configure a gateway to be an HTTP/HTTPS proxy. When it is a proxy, the gateway becomes an intermediary between two hosts that communicate with each other. It does not allow a direct connection between the two hosts.
Each successful connection creates two different connections:
- One connection between the client in the organization and the proxy.
- One connection between the proxy and the actual destination.
Proxy Modes
Two proxy modes are supported:
- - All HTTP traffic on configured ports and interfaces going through the gateway is intercepted and proxied. No configuration is required on the clients.
- - All HTTP/HTTPS traffic on configured ports and interfaces directed to the gateway is proxied. Configuration of the proxy address and port is required on client machines.
Access Control
You can configure one of these options for forwarding HTTP requests:
- - HTTP/HTTPS traffic from all internal interfaces is forwarded by proxy.
- - HTTP/HTTPS traffic from interfaces specified in the list is forwarded by proxy.
Ports
By default, traffic is forwarded only on port 8080. You can add or edit ports as required.
Advanced
By default, the HTTP header contains the proxy related header. You can remove this header with the option.
You can also use the Advanced option to configure the that contains the IP address of the client machine. It is not added by default because it reveals the internal client IP.
Logging
The Security Gateway opens two connections, but only the Firewall blade can log both connections. Other blades show only the connection between the client and the gateway. The Destination field of the log only shows the gateway and not the actual destination server. The Resource field shows the actual destination.
To configure a Security Gateway to be an HTTP/HTTPS proxy:
- From the window of a Security Gateway object, select from the tree.
- Select .
- Select the or proxy mode.
|
Note - If you select mode, make sure to configure the clients to work with the proxy.
|
- Select to forward HTTP requests from one of these options:
- - Click the plus sign to add specified interfaces or the minus sign to remove an interface.
- To enter more ports on which to forward traffic, select .
- To include the actual source IP address in the HTTP header, select > .
|
Note - The X-Forward-For header must be configured if traffic will be forwarded to Identity Awareness gateways that require this information for user identification.
|
- Click .
Security Gateway Portals
The Security Gateway runs a number of web-based portals over HTTPS:
- Mobile web access portal
- SecurePlatform WebUI
- Gaia WebUI
- Identity Awareness (captive portal)
- DLP portal
- SSL Network Extender portal
- UserCheck portal
- Endpoint Security portals (CCC)
All of these portals can resolve HTTPS hosts to IPv4 and IPv6 addresses over port 443.
These portals (and HTTPS inspection) support the latest versions of the TLS protocol. In addition to SSLv3 and TLS 1.0 (RFC 2246), the Security Gateway supports:
- TLS 1.1 (RFC 4346)
- TLS 1.2 (RFC 5246)
Support for TLS 1.1 and TLS 1.2 is enabled by default but can be disabled in SmartDashboard (for web-based portals) or GuiDBedit (for HTTPS Inspection).
To configure TLS protocol support for portals:
- In , open .
- In the section, click .
The window opens.
- On the page, set minimum and maximum versions for SSL and TLS protocols.
To Configure TLS Protocol Support for HTTPS inspection:
- In , on the tab, select .
- In the column, select .
- In the column, select the minimum and maximum TLS version values in these fields:
- (default = TLS 1.2)
- (default = SSLv3)
HTTPS Inspection in SmartView Tracker
Logs from HTTPS Inspection are shown in SmartView Tracker. There are two types of predefined queries for HTTPS Inspection logs in SmartView Tracker:
- HTTPS Inspection queries
- Blade queries - HTTPS Inspection can be applied to these blades:
- Application Control
- URL Filtering
- IPS
- DLP
- Anti-Virus
- Anti-Bot
To open SmartView Tracker do one of these:
- From the SmartDashboard toolbar, select Window > SmartView Tracker.
- Press Control +Shift +T.
HTTPS Inspection Queries
These are the predefined queries in Predefined > Network Security Blades > HTTPS Inspection.
- - Shows all HTTPS traffic that matched the HTTPS Inspection policy and was configured to be logged.
- Shows traffic with connection problems.
- Action values include rejected or detected. The actions are determined by the SSL validation settings for HTTPS Inspection.
- HTTPS Validation values include:
- - For general SSL protocol problems
Blade Queries
When applying HTTPS Inspection to a specified blade:
- There is an for each of the blades that can operate with HTTPS Inspection. The query shows all traffic of the specified blade that passed through HTTPS inspection.
- The log in the blade's queries includes an . The field value can be inspect or bypass. If the traffic did not go through HTTPS inspection, the field does not show in the log.
Permissions for HTTPS Logs
An administrator must have HTTPS inspection permissions to see classified data in HTTPS inspected traffic.
To set permissions for an administrator in a new profile:
- In the Users and Administrators tree, select an administrator > Edit.
- In the > page in the field, click .
- In the window:
- Enter a for the profile.
- Select and click .
The window opens.
- In the tab, select for permission to see the classified information in the HTTPS Inspection logs.
- Click on all of the open windows.
To edit an existing permissions profile:
- From the SmartDashboard toolbar, select >.
- Select a profile and click .
- Follow the instructions above from step 3.
HTTPS Inspection in SmartEvent
Events from HTTPS Inspection are shown in SmartEvent. There are two types of predefined queries for HTTPS Inspection events in SmartEvent:
- HTTPS Inspection queries for HTTPS validations
- Blade queries - HTTPS Inspection can be applied to these blades:
- Application Control
- URL Filtering
- IPS
- DLP
- Anti-Virus
To open SmartEvent do one of these:
- From the SmartDashboard toolbar, select Window > SmartEvent.
- Press Control +Shift +T.
Event Analysis in SmartEvent
SmartEvent supplies advanced analysis tools with filtering, charts, reporting, statistics, and more, of all events that pass through enabled Security Gateways. SmartEvent shows all HTTPS Inspection events.
You can filter the HTTPS Inspection information for fast monitoring on HTTPS Inspection traffic.
- Real-time and history graphs of HTTPS Inspection traffic.
- Graphical incident timelines for fast data retrieval.
- Easily configured custom views to quickly view specified queries.
- Incident management workflow.
SmartEvent shows information for all Software Blades in the environment.
Viewing Information in SmartEvent
There are two types of predefined queries for HTTPS Inspection events in SmartEvent:
- HTTPS Inspection queries
- Blade queries
HTTPS Inspection Queries
- Go to >>> to shows the SSL validation events that occurred.
- The and in the event record show if the traffic was detected or rejected due to SSL Validation settings.
Blade Queries
- There is an for each of the blades that can operate with HTTPS Inspection. The query shows all traffic of the specified blade that passed through HTTPS inspection.
- The in the event record in the blade's queries includes an . The field value can be inspect or bypass. If the traffic did not go through HTTPS inspection, the field does not show in the event record.
|
