Events
The
|
|
Note - Corrective action for an event must be taken in the product that generated the event. For example, if a benign URL is blocked, then access the product and correct the policy. |
The Events page shows:
To view the Events page, access XDR![]() Extended Detection & Response and click Events.
Extended Detection & Response and click Events.
|
|
Note - The default log retention duration is 90 days. To extend the duration to 180 days or 365 days, contact Check Point Support. |
Supported Products
-
Quantum Self-Hosted Management
-
Quantum Spark Management
-
Smart-1 Cloud
-
Endpoint Security
-
Mobile Security
-
Harmony Connect
-
Browser Security
-
Email Security
-
SASE
-
CloudGuard Posture
-
CloudGuard WAF
-
Fortinet FortiGate Next Generation Firewall
-
CrowdStrike Falcon
-
Trend Vision One for Endpoint
-
Cisco Firepower Threat Defense
-
Microsoft 365 Defender for Endpoint
-
Palo Alto Networks Next Generation Firewall
-
Singularity Endpoint
Statistics
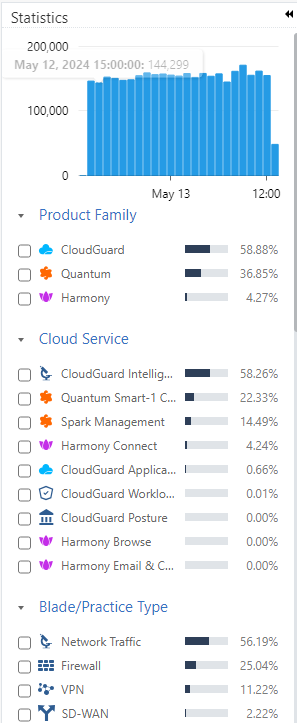
On the Statistics pane, you can:
-
See a bar graph of the number of events for the selected time frame.
-
Filter the event data in Events Table. For example, you can filter the events data for a product family,
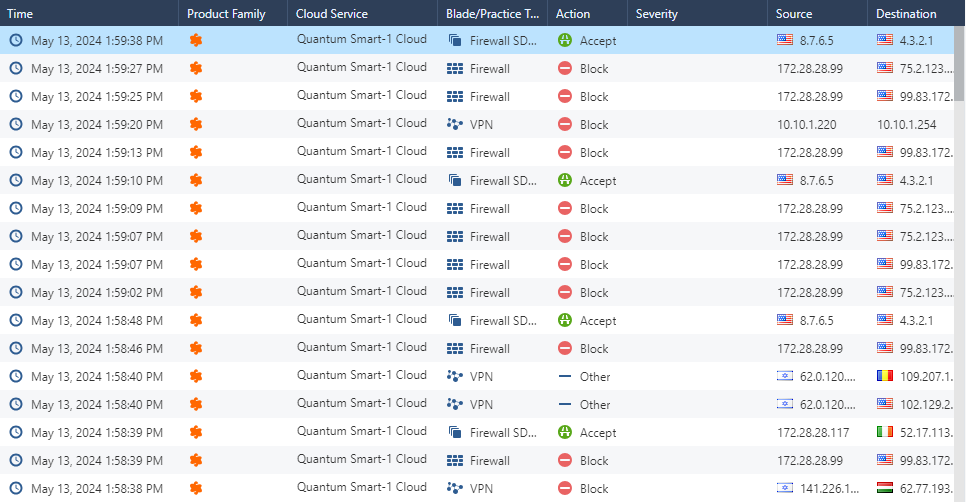
Events Table
|
Field Name |
Description |
|---|---|
|
Default Fields |
|
|
Time |
Time of the event. |
|
Product Family |
Check Point product family. For example, Quantum, Harmony or CloudGuard. |
|
Cloud Service |
The cloud service used by the Check Point product. For example, Quantum Gateways. |
|
Blade/Practice Type |
Software blade that triggered the event. For example, Firewall, VPN, Syslog. |
|
Action |
Action enforced on the event:
|
|
Severity |
Severity of the event:
|
|
User |
User logged in at the time of the event. |
|
Additional Fields |
|
|
Alert |
Type of alert generated for the event. For example, spoof alert, mail. |
|
Destination |
Destination IP address. |
|
Direction |
Direction of the network traffic:
|
|
Domain |
Domain name sent to DNS request. |
|
Log ID |
Unique identity for logs. Includes Type, Family, Product/Blade, Category. |
|
Message |
Message displayed for the security event. For example, remote access client IP address and port were changed. |
|
Origin |
Name of the first Security Gateway |
|
Source |
Source IP address. |
Managing the Events Table
-
To view the details of a specific log, double-click the row.
-
To view the default columns, right-click the table header row and click Default.
-
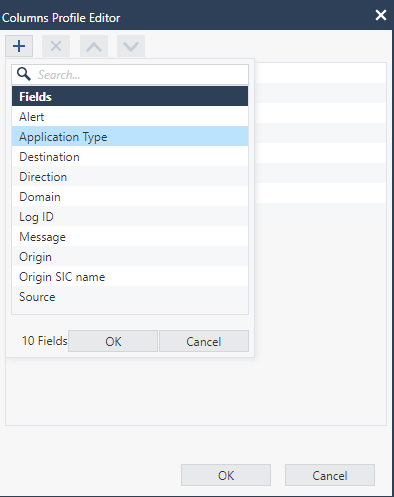
To modify the table columns, right-click the table header row and click Columns Profile Editor.
-
To add a new column to the table:
-
Click +.
-
Select the column from the list and click OK.
The new column appears in the
-
-
To remove a column from the table:
-
Select the column you want to delete and click X.
-
Click OK.
The selected column is deleted from the
-
-
To sort the columns:
-
Select the column.
-
To move the column higher in the order, click
 .
. -
To move the column lower in the order, click
 .
.
-
-
Click OK.
The column position is updated in the
-
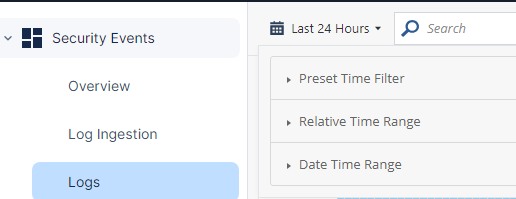
Viewing Events for a Time Period
By default, the
To view
-
Preset Time Filter
-
Relative Time Range
-
Date Time Range
Searching for Events
You can search for events using free text or a filter.
-
To search using free text, in the Search field, enter the text and press Enter.
For example, if you enter Block, the search results show all the blocked events.
-
To search using a filter, click the Search field, select a filter and enter the text.
For example, if the filter is Blade/Practice Type and text is URL Filtering, search as Blade/Practice Type:"URL Filtering
 Check Point Software Blade on a Security Gateway that allows granular control over which web sites can be accessed by a given group of users, computers or networks. Acronym: URLF.".
 The search results show all events with Blade/Practice Type as URL Filtering.

Note - You can use logical operations AND, OR and NOT in the search.
For example, Block AND URL Filtering shows the blocked events with Blade/Practice Type as URL Filtering.
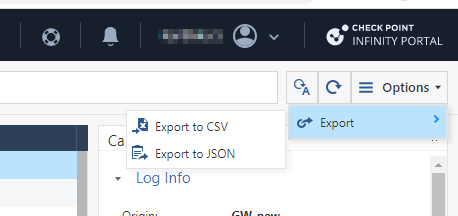
Exporting Events
You can export events from the
-
In the Events window, click Options > Export.
-
Select one of these output file formats:
-
Export to CSV
-
Export to JSON
-
-
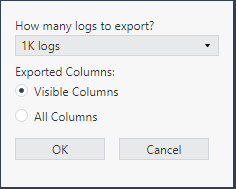
Enter the information for these fields:
-
In How many logs to export drop-down, select the number of logs you want to export.
-
In Exported Columns, select whether to export event data from Visible Columns or from All Columns.
-
-
Click OK.
For CSV output, system generates an Excel sheet with the file name format: Events_Logs_Date_Time.xls.
For JSON output, system generates a json file with name format: Events_Logs_Date_Time.json.
Example, Events_Logs_Oct_17_2022_01_48_24_PM.
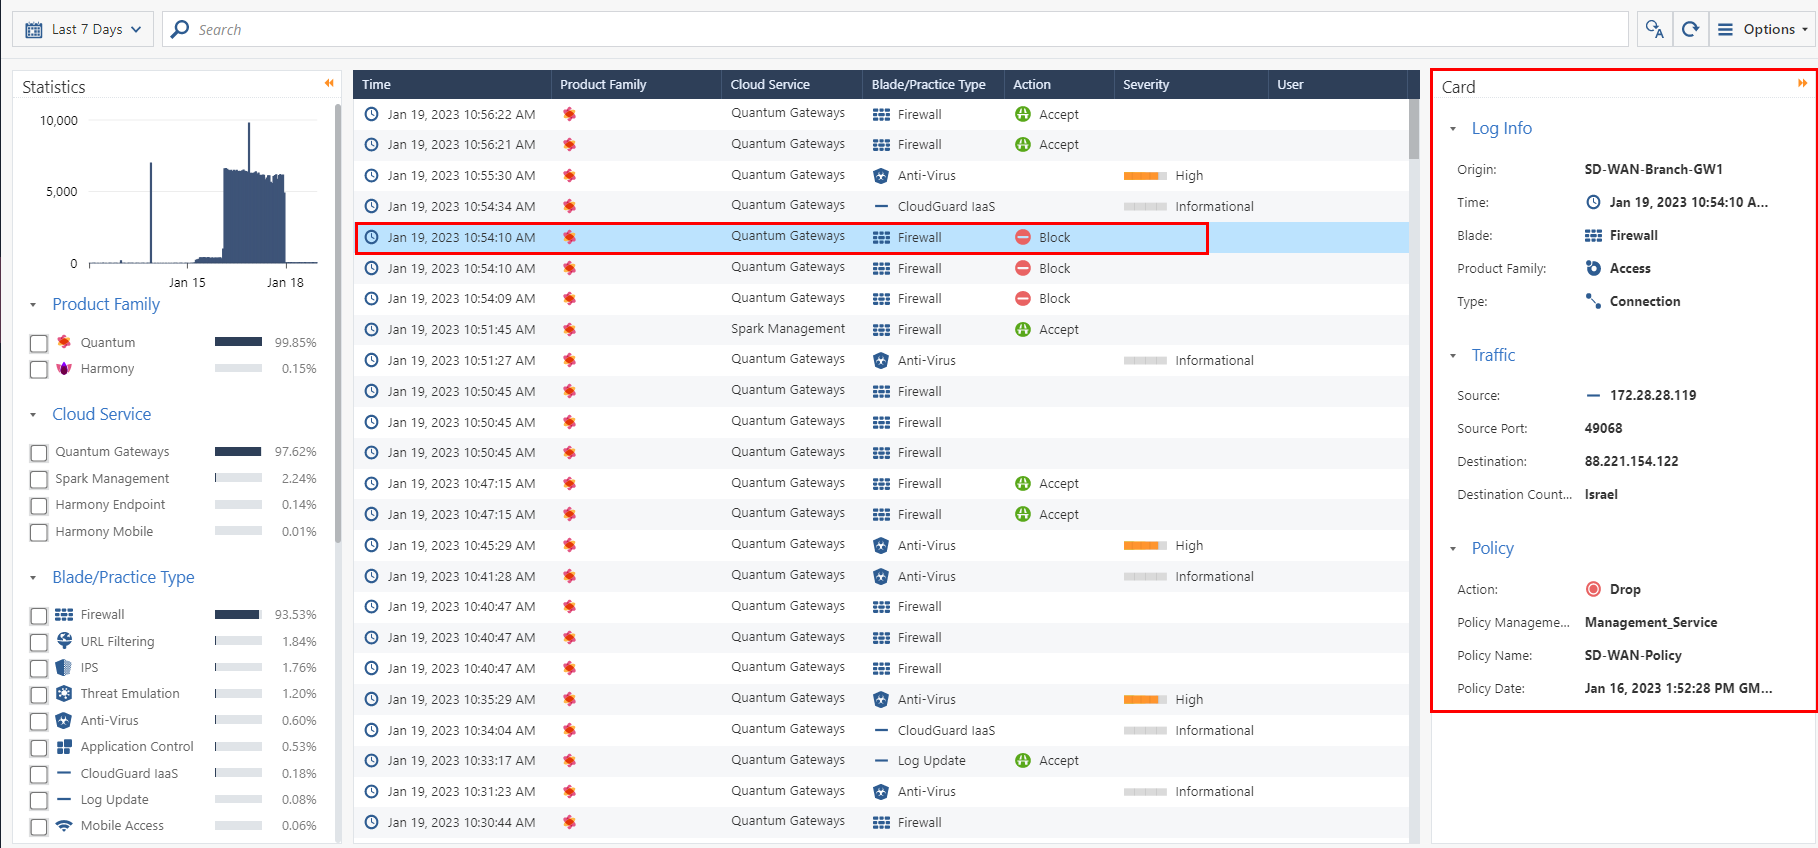
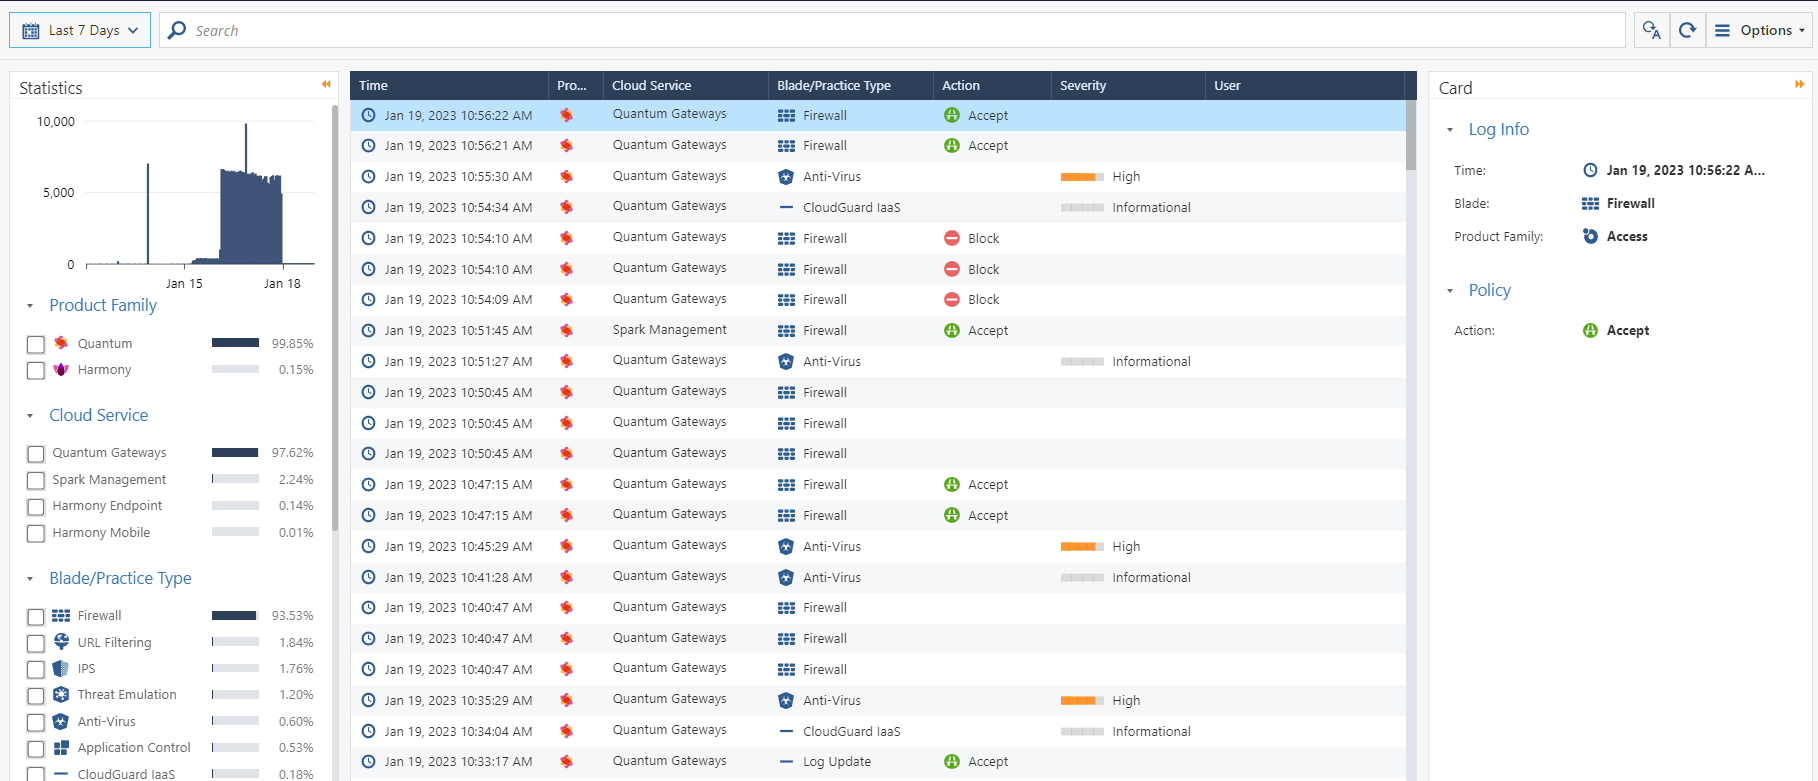
Card
The Card pane shows the details for the event selected in the Events Table.