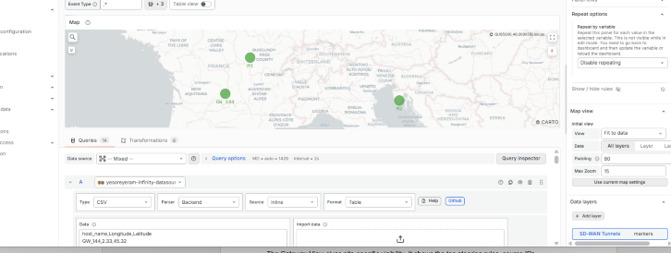
"Mapgl" Plugin for Grafana
Part 1 - Plugin Overview
The "Mapgl" plugin allows users to load Grafana Mapgl panel.
This plugin is required to load the map panel in the Overlay Dashaboard (see "Overlay" SD-WAN tab).
Part 2 - Plugin Installation
Reference: https://grafana.com/docs/grafana/latest/administration/plugin-management/
-
Open the Grafana Web UI.
-
Navigate to Administration> Plugins and data > Plugins.
-
Search for: Mapgl
Add New Data Sources
For Grafana to read From the Databases we need to add data source into Grafana:
-
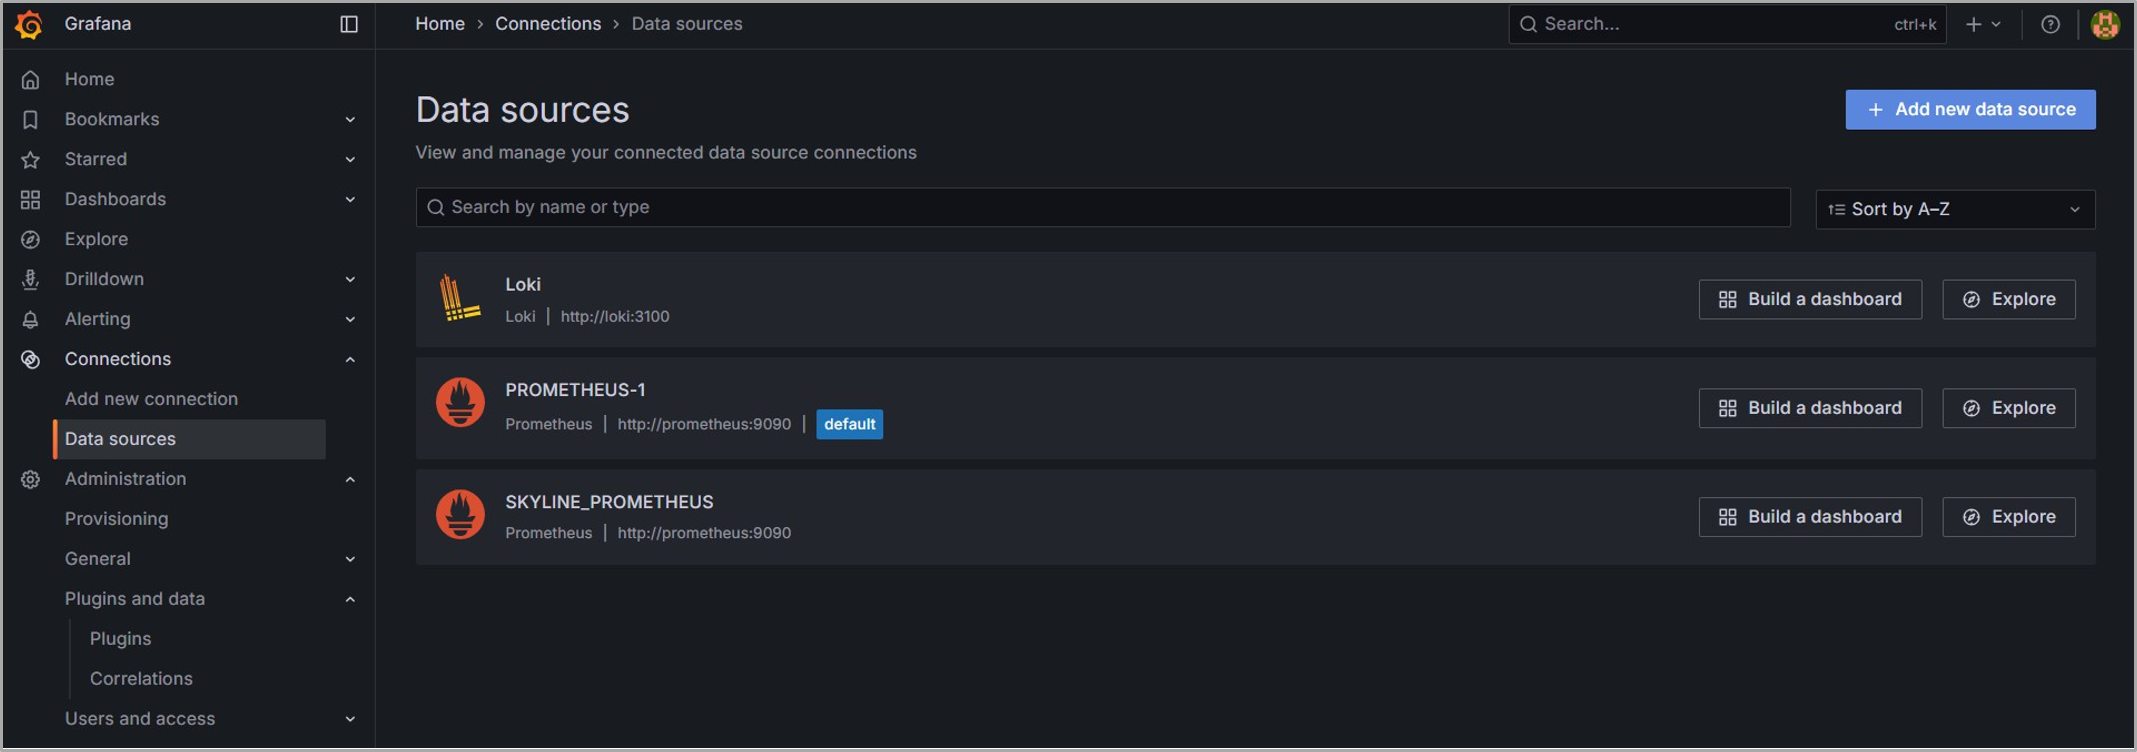
In the Grafana Web UI, navigate to Connections> Data sources.
-
Click Add new data source.
Example:
-
Search for: Loki / Prometheus.
-
Click the plugin's logo.
Example:

-
Configure your data source name.
-
Configure the data source URL (port 9090 for Prometheus and 3100 for Loki).
For example:
http://10.20.30.40:3100 -
Click Save & test.
Filters and search in "Mapgl"
The important filters in the overlay map are Edge which remove and adding the tunnels lines from the map and circles who removes the sites themselves.
The search in the map will zoom on the site that was searched but the map will be refreshed based on the refresh time configured (default is 1m) of the panel and location will be back to default. If temporary investigation is done change the refresh time from 1m to off. To change that permanently edit the map widget and change the view from fit to data to tour preferred location.