Viewing Operational Overview, Security Overview and Reports
The Overview page shows a graphical summary of important information about the Endpoint clients in your organization.
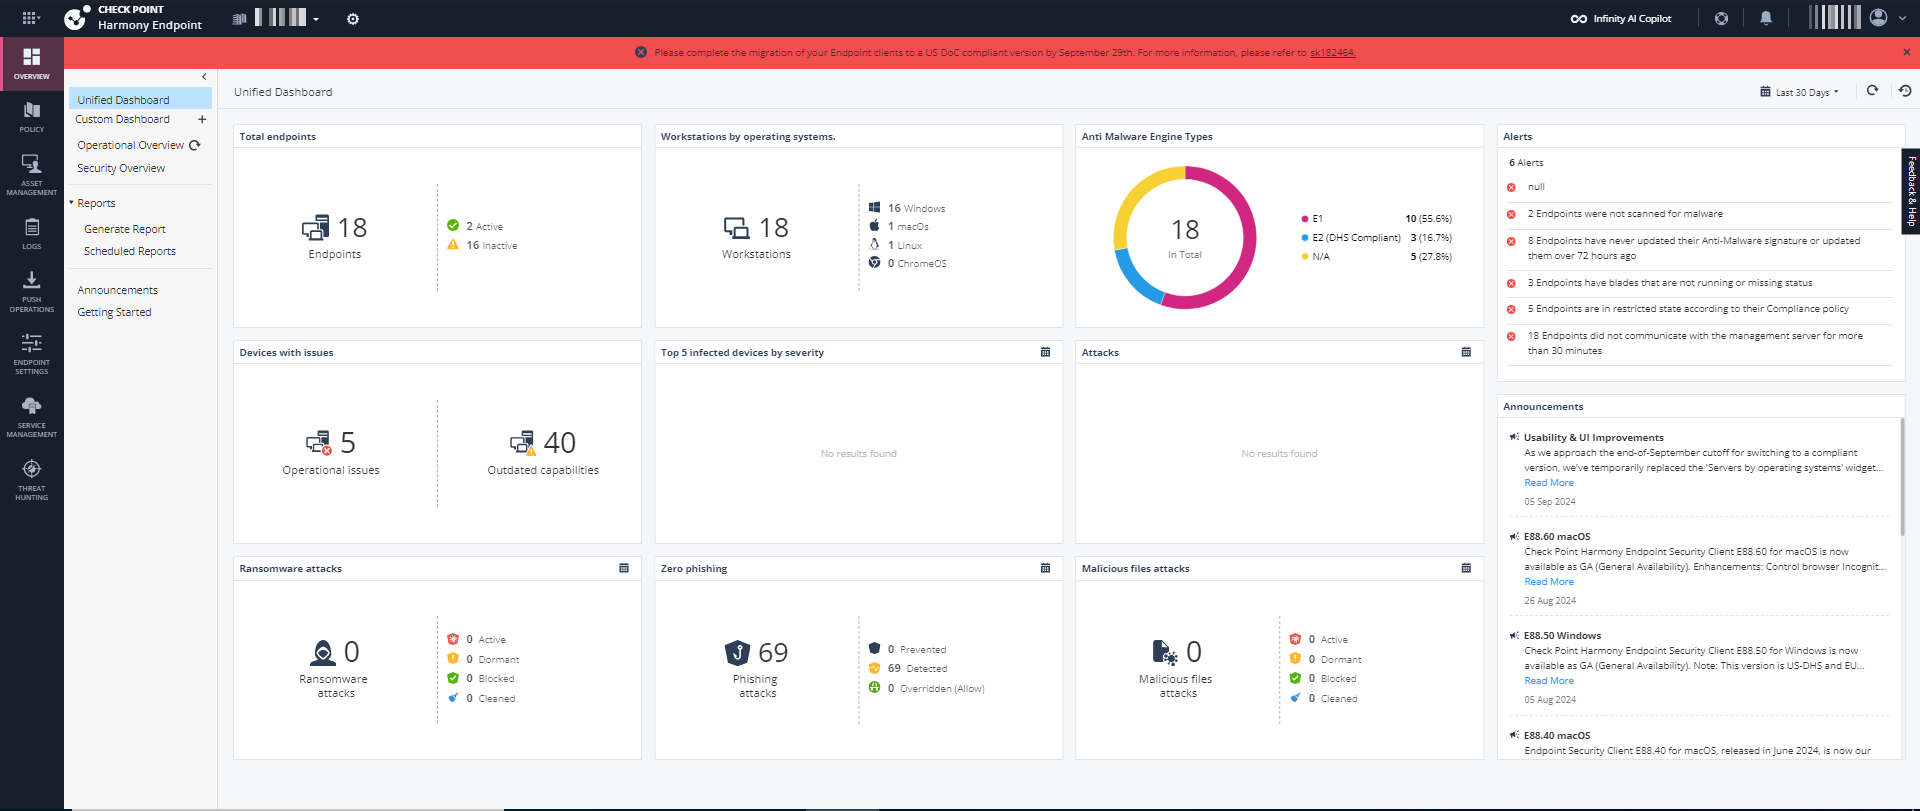
Unified Dashboard
The Unified Dashboard shows a consolidated view of the preselected widgets from the Operational Overview and Security Overview, in addition to Announcement widget. The Announcement widget shows the latest news in the cyber security industry.
Custom Dashboard
The Custom Dashboard allows you to create personalized dashboards with widgets of your preference and specify whether the dashboard should be private or public. Private dashboards are available only for you to view whereas, Public dashboards are available for all the users with access to the Overview page. However, only the owner of the dashboard can edit it.
Blank dashboard allows you to create a new dashboard with available widgets. Unified template allows you to customize the Unified Dashboard.
Creating a Custom Dashboard
-
Go to Overview and click
 next to Custom Dashboard.
-
To create a new custom dashboard from scratch:
-
Hover over the Blank dashboard widget and click Add.
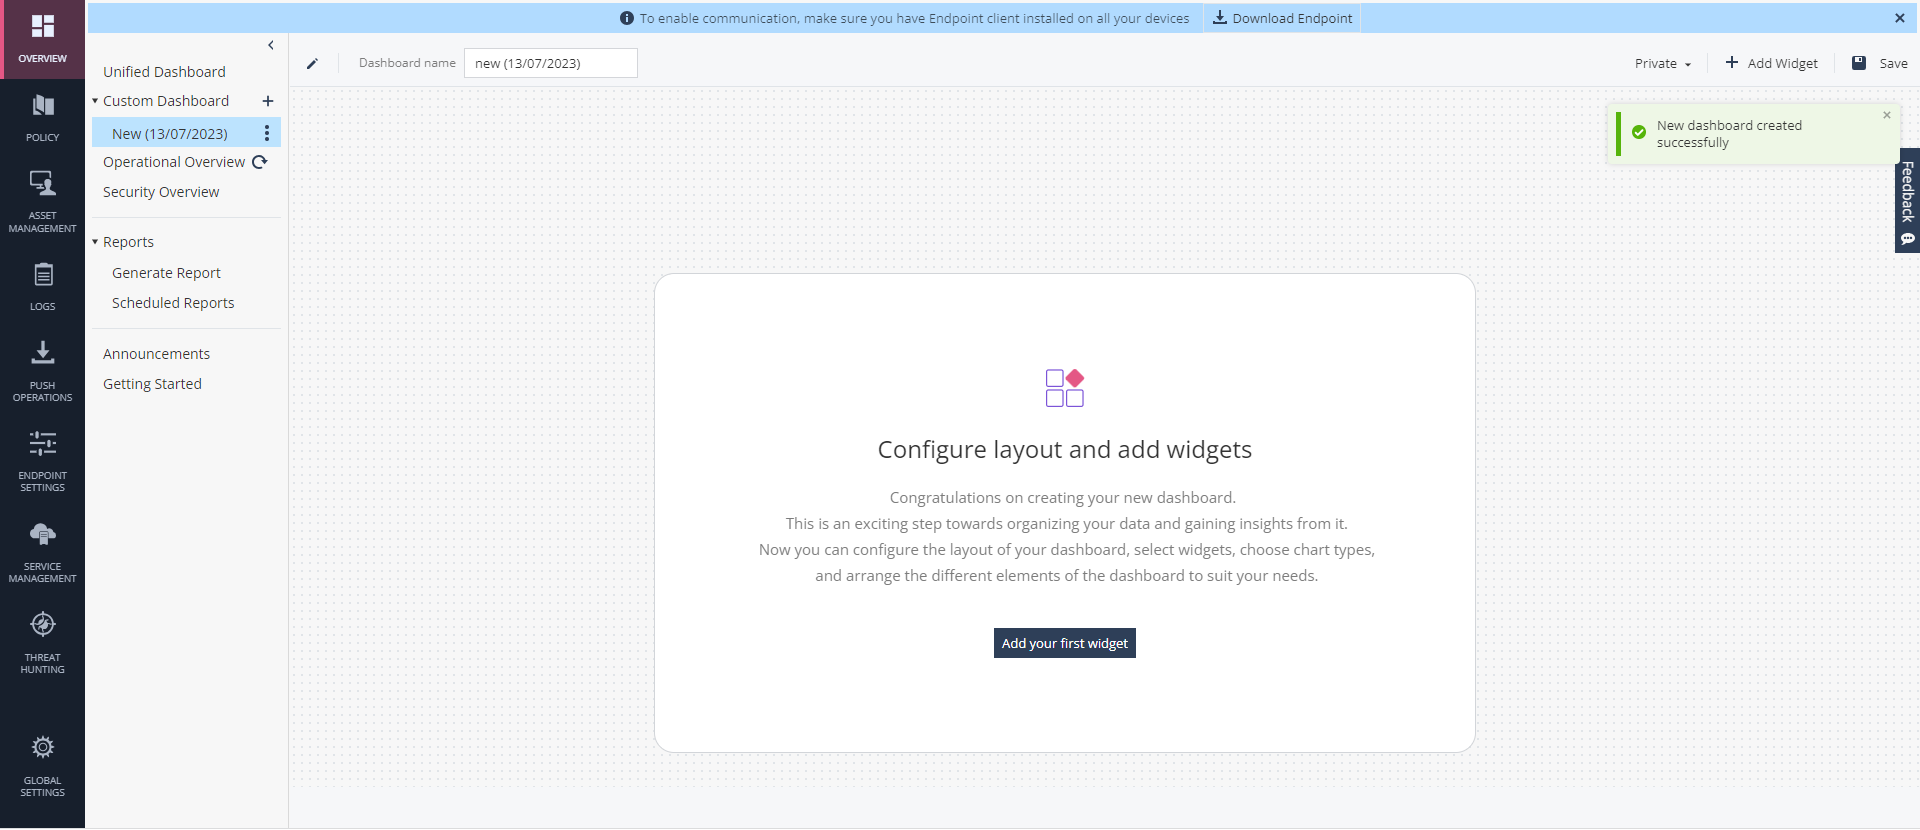
-
In the Dashboard name field, enter a name.
-
Click Add Your First Widget.
The Add Widget window appears.
-
-
To create a custom Unified Dashboard:
-
Hover over the Unified template widget and click Duplicate.
-
In the Dashboard name field, enter a name.
-
Click Add Widget.
The Add Widget window appears.
-
-
From the left pane, select the widget and click Add.
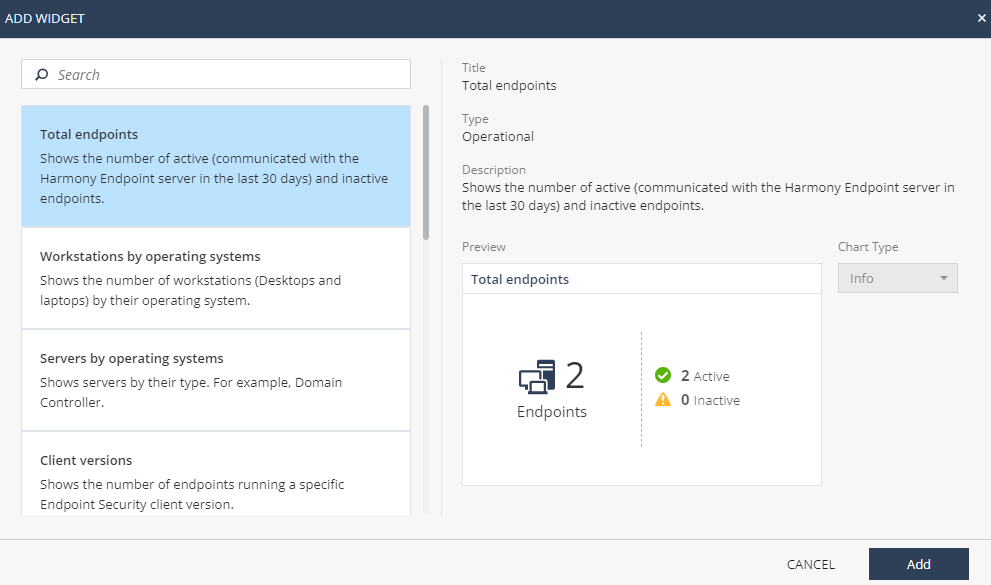

Note - The Add button is disabled if the widget is already added to the dashboard.
-
To add more widgets, click Add Widget and repeat step 4.
-
To delete a widget, on the widget, click
 and click Delete.
 -
By default, all custom dashboards you create are set as Private. To make the custom dashboard available to all users with access to the Overview page, from the Private list on the upper-right corner, click Public. The system adds the dashboard under Public dashboards for other users.
-
Click Save.
The dashboard appears under Custom Dashboard on the left navigation pane, and it is also listed under My dashboards in the Custom Dashboard page.
Managing a Custom Dashboard
-
Click Overview.

-
To edit a dashboard:
-
Expand Custom Dashboard.
-
Click
for the dashboard you want to edit and click Edit. -
Make the necessary changes and click Save.
Note - You cannot edit dashboards created by other users.
-
-
To delete a dashboard, expand Custom Dashboard, click
for the dashboard you want to delete and click Delete.
Note - You cannot delete dashboards created by other users.
-
To hide a dashboard, expand Custom Dashboard, click
for the dashboard you want to hide and click Hide. The dashboard is removed from the list under Custom Dashboard on the left navigation pane. -
To unhide a dashboard, click
, hover over the dashboard you want to unhide and click Add. The dashboard is added to the list under Custom Dashboard on the left navigation pane. -
To duplicate a dashboard, click
, hover over the dashboard and click Duplicate.
Operational Overview
The Operational Overview page shows the deployment status of Endpoint clients in your organization, their health status, client versions and operating systems on the clients.
To view the Operational Overview page, click Overview > Operational Overview.
To export the Operation Overview data to a pdf, click Export PDF.
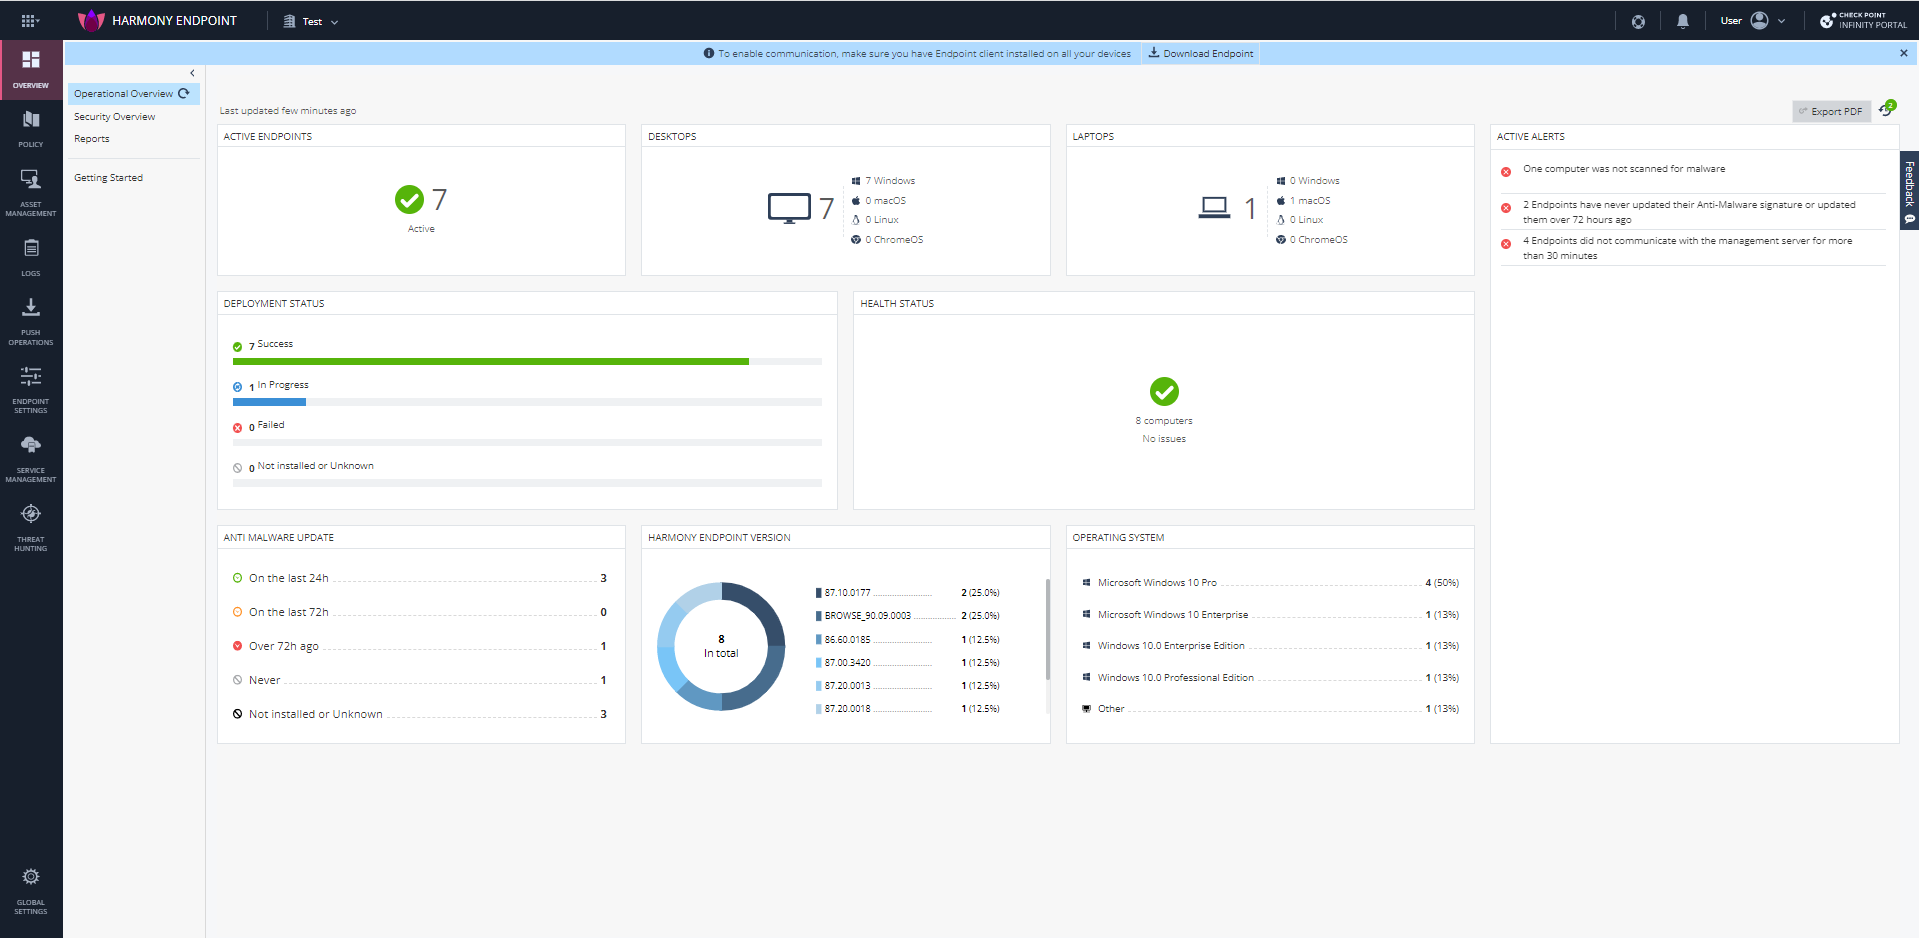
Active Endpoints
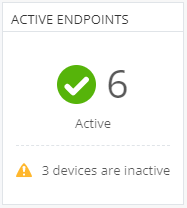
The Active Endpoints widget shows the number of active and inactive endpoints.
Click the numbers in the widget to view the endpoints in the Asset Management View tab.
Desktops
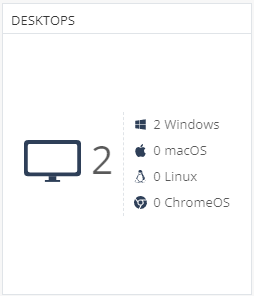
The Desktops widget shows the number of desktops by Operating System (Windows, macOS, Linux, and ChromeOS) that have the Endpoint Security client installed.
Laptops
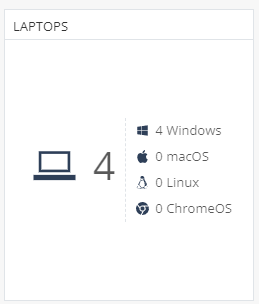
The Laptops widget shows the number of laptops by Operating System (Windows, macOS, Linux, and ChromeOS) that have the Endpoint Security client installed.
Deployment Status

The Deployment Status widget shows the number of endpoints by deployment status.
Pre-boot Status
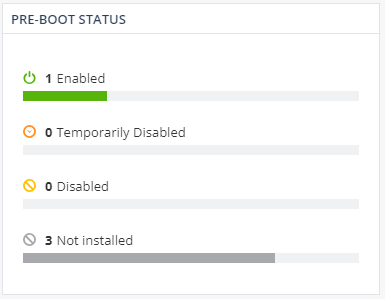
The Pre-boot Status widget shows the number of endpoints by pre-boot![]() Authentication before the Operating System loads. status.
Authentication before the Operating System loads. status.
Encryption Status

The Encryption Status widget shows the number of endpoints by encryption status.
Anti-Malware Update

The Anti-Malware Update widget shows the number of endpoints that had the Anti-Malware![]() A component on Endpoint Security Windows clients. This component protects clients from known and unknown viruses, worms, Trojan horses, adware, and keystroke loggers. blade updated over different time periods.
A component on Endpoint Security Windows clients. This component protects clients from known and unknown viruses, worms, Trojan horses, adware, and keystroke loggers. blade updated over different time periods.
Endpoint Security Version
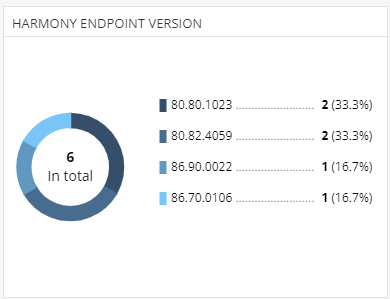
The Endpoint Security Version widget shows the number of endpoints running a particular Endpoint Security client version.
Operating System
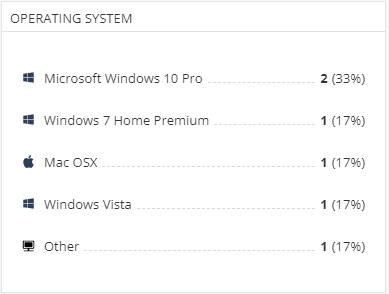
The Operating System widget shows the number of endpoints running a particular Operating System.
Alerts
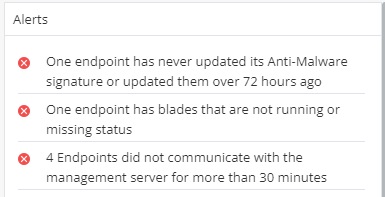
The Alerts widget shows the active alerts on all the endpoints in the account.
Security Overview
Shows the attack statistics of the Endpoint Security clients.
The information is presented in these widgets:
-
Hosts Under Attack
-
Active/Dormant Attacks
-
Active Attacks - Malicious process was executed and the system was infected. Termination and quarantine of the process or other elements of the attack is disabled in the policy.
-
Dormant Attack - No malicious process was executed but the system was infected. Quarantine of one of the detected files failed.
-
-
Cleaned/Blocked Attacks
-
Cleaned Attack - Malicious process was executed and the system was infected. Termination and quarantine of all attack elements succeeded.
-
Blocked Attack - No malicious process was executed. Quarantine of all detected files succeeded.
-
-
Infected Hosts
-
Attacks Timeline
|
|
Note - The Active, Dormant and Cleaned attacks are based on Forensics and Remediation capability:
|
Reports
On the Reports page, you can download the reports in the pdf format:
-
Threat Analysis Report - Shows the latest security events.
-
Threat Analysis Report Anonymized - Shows the latest security events without specific user names.
-
High Risks Cyber Attack Report - Shows the analysis of all the Endpoint Security events by statuses of the attack pillars.
-
Web Activity Checkup - Shows the web activity in the organization.
-
Threat Emulation Report - Shows a report about scanned and malicious files.
-
Threat Extraction Report - Shows the insights on the downloaded files.
-
Software Deployment Report - Shows the deployment status in the organization.
-
Policies Report - Shows policies status.
-
Vulnerability Management -Shows the detected vulnerabilities.
Note - Available only to customer subscribed to this feature and with server version R81.10.x and higher.
-
Posture Management - Shows Vulnerability Management and patches information.
Note - Available only to customer subscribed to this feature and with server version R81.10.x and higher.
-
Operational Report - Shows the operational status of the endpoints.
-
Compliance Report - Shows the compliance status in the organization.
-
Check Point Cyber Security Report - Shows the latest security trends as per Check Point.
Generate Report
To generate a report:
-
Go to Overview > Reports > Generate Report.
-
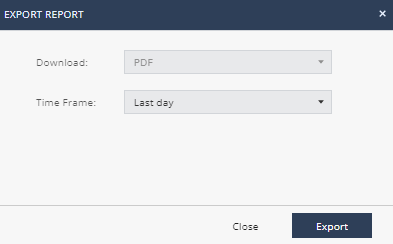
Select a report, click
 and select Export Report.
The Export Report window appears.
-
In the Time Frame list, select Last day, Last 7 days, or Last 30 days.
-
Click Export.
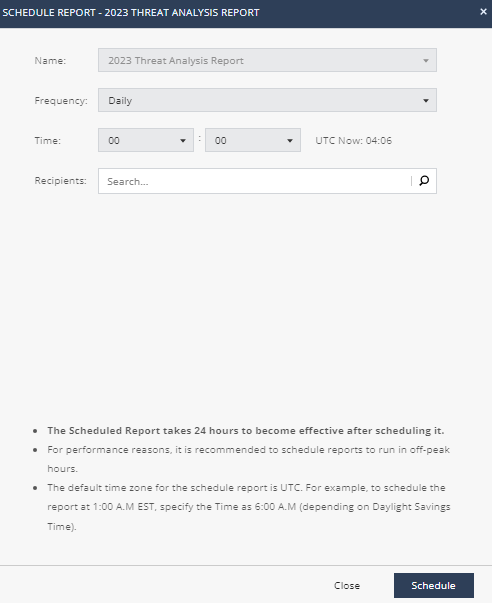
Scheduled Reports
Scheduled Reports allows you to automatically generate reports at the specified date and time, and email it to the specified recipients.
|
|
Notes:
|
To schedule a report:
-
Navigate to Overview> Reports and do one of these:
-
From the Scheduled Reports page, click Add and from the Name list, select the report.
-
From the Generate Report page, select the report, click
and select Schedule Report.
-
-
From the Name list, select the report.
-
From the Time Frame list, select the period for the report:
-
Last day
-
Last 7 days
-
Last 30 days
-
-
From the Frequency list, select the frequency to generate the report:
-
To generate the report everyday, select the day of the week.
-
To generate the report weekly, select the day of the week.
-
To generate the report every month, select the date.
-
-
In the Time field, specify the time for the system to generate the report and send it to the recipients. By default, the time is in UTC. For example, if you want to generate the report at 01.00 AM Eastern Standard Time (EST), you must specify the time as 06.00 AM UTC.
-
In the Recipients field, enter the recipients for the report.
-
Click Schedule.
The schedule is added to the table. The report becomes effective 24 hours after you schedule it.
-
To edit a scheduled report, select the report in the table and click Edit.
-
To delete a scheduled report, select the report in the table and click Delete.
Announcements
The Announcements page shows the latest news and enhancements in Endpoint Security.