
Health of Gateways and Servers
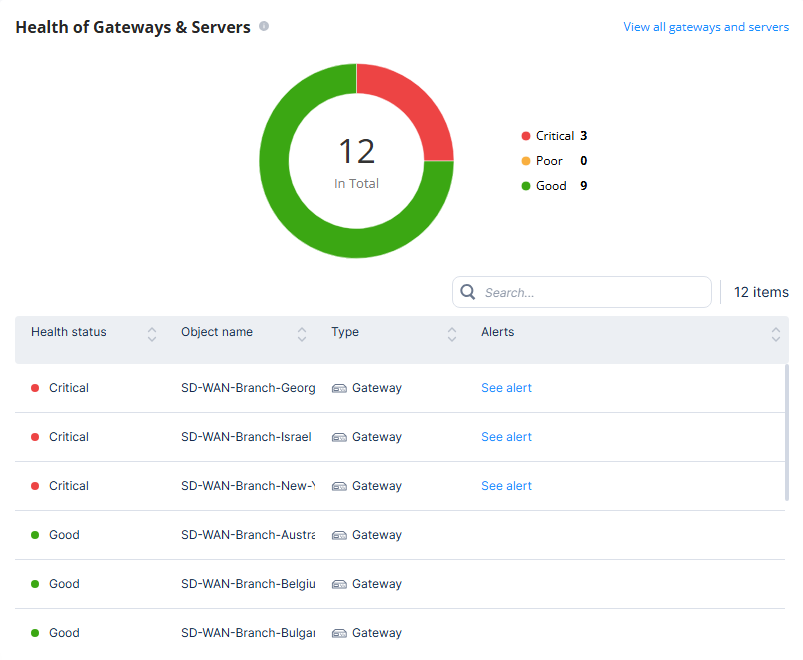
The Health of Gateways & Servers widget displays:
-
A pie chart that shows the total number of physical and virtual assets connected and their health status according to the severity of alerts:
-
Good
-
Poor
-
Critical
-
Unavailable
Note:The pie chart shows the health status over the past five seconds.
-
-
A table with the health status of specific Gateways & Servers and links to their associated alerts.