Asset Dashboard
The Asset Dashboard page displays asset details in these categories:
-
System - System resource utilization of assets. See System.
-
Network - Network traffic data of assets. See Network.
-
Interfaces - Network interface data of assets. See Interfaces.
-
VPN - VPN information of assets. See VPN.
-
Hardware - Hardware information of assets. See Hardware.
-
CloudGuard - CloudGuard information of assets. See CloudGuard.

|
|
Note - The tabs and widgets displayed depend on the supported asset types. For supported asset types, see the Prerequisites section in sk182647. |
To view the Asset Dashboard for a Check Point asset:
-
Access the Events & AIOps Administrator Portal.
-
Go to AIOps > Asset Dashboard.
-
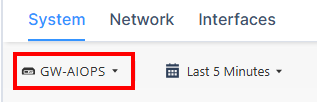
Select the asset from the list at the top.
-
Click the
 icon and select the period for which you want to view the data. The default is Last 7 DaysLast 5 Minutes.
Note - The widgets show data only for a maximum of 30 days.
-
Select the required tab.
System
|
|
Note - The widgets displayed depend on the asset type and version. |

Asset Information

The Asset Information widget shows:
-
Asset type
-
Release version
-
IP Address
-
Hardware type
-
Uptime
-
Name of the last installed policy and its installation time
-
CPU usage
-
System memory usage
Memory Utilization

The Memory Utilization widget shows the RAM used for processes, swap, and the total RAM available.
CPU Utilization

The CPU Utilization widget shows:
-
Overall - The overall CPU used as a percentage of the total utilization.
-
By Core - The CPU used as a percentage of the total utilization split by CPU cores.
Disk Utilization

The Disk Utilization widget shows the disk space usage of all the mounted file systems as a percentage of the total utilization.
|
|
Note - The partition may differ depending on the monitored asset type. |
Top 5 Processes
|
|
Note - This widget is supported only in R82 version and higher. |

The Top 5 Processes widget shows:
-
CPU - The top five processes with the highest CPU usage.
-
RAM - The top five processes with the highest memory (RAM) usage.
Cluster Member Status
|
|
Note - This widget is supported only in R82 version and higher. |
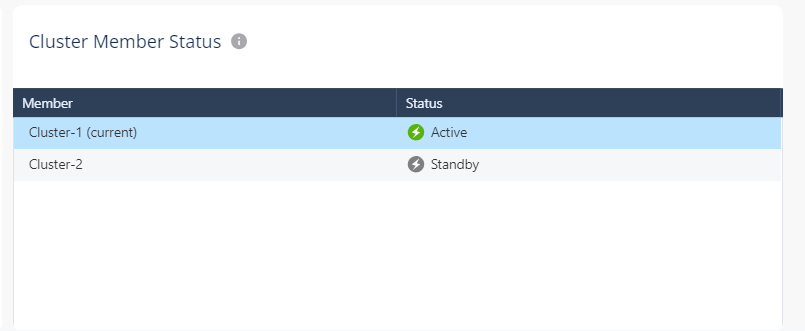
The Cluster Member Status shows the status of the cluster members:
-
Active
-
Standby
-
Lost
-
Down
-
Initializing
-
Ready
-
Backup
-
None
Network
|
|
Note - The widgets displayed depend on the asset type and version. |

Concurrent Connections

The Concurrent Connections widget shows the total number of concurrent connections.
Throughput (bits/sec)

The Throughput (bits/sec) widget shows:
-
Overall - The overall rate of successfully received and transmitted data over the communication channels.
-
By interface - The rate of successfully received and transmitted data split by individual interfaces.
Connection Drops

The Connection Drops widget shows the total number of connections dropped by Security Gateway Software Blades.
Network Drops

The Network Drops widget shows the total number of dropped packets received and transmitted since boot.
Connection Rate

The Connection Rate widget shows the number of connections per second.
Throughput (packets/sec)

The Throughput (packets/sec) widget shows:
-
Overall - The overall rate of successfully received and transmitted packets over the communication channels.
-
By interface - The rate of successfully received and transmitted packets split by individual interfaces.
Interfaces
|
|
Note - The widgets displayed depend on the asset type and version. |

Network Interfaces
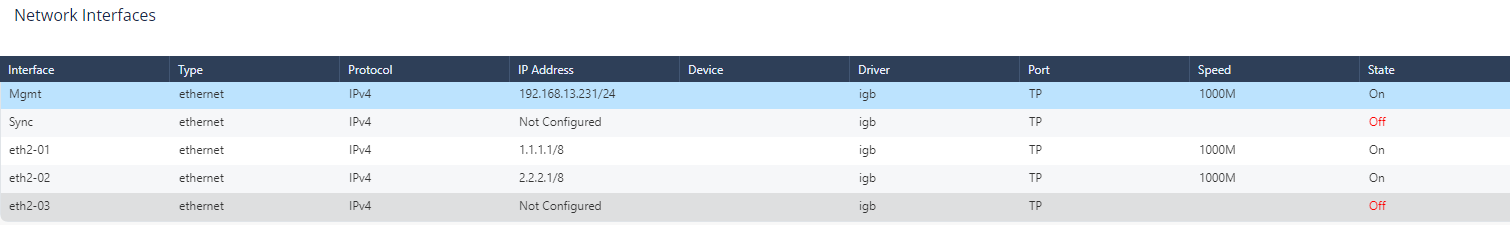
The Network Interfaces table shows the IP address and state of the network interfaces.
The different parameters in the table are described below:
|
Column Name |
Description |
|---|---|
|
Interface |
Name of the interface. |
|
Type |
Type of the network interface (ethernet / loopback). |
|
Protocol |
Network protocol used in the network. |
|
IP Address |
Asset IP address. |
|
Device |
Asset name provided by the Operating System. |
|
Driver |
Version of the network driver. |
|
Port |
Asset port number. |
|
Speed |
Network speed. |
|
State |
Asset network state (On/Off). |
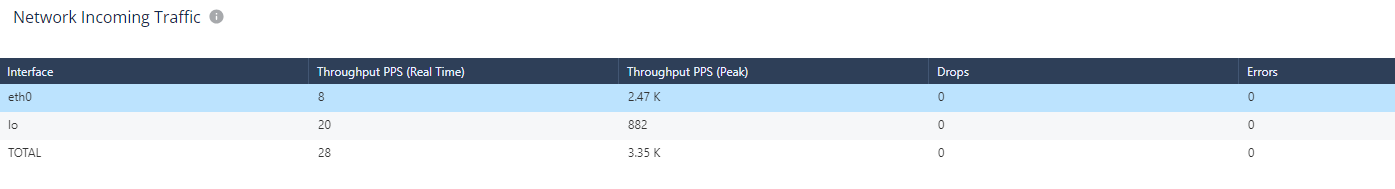
Network Incoming Traffic
The Network Incoming Traffic table shows:
|
Column Name |
Description |
|---|---|
|
Interface |
Name of the interface. |
|
Throughput PPS (Real Time) |
The rate of packets successfully received over the communication channel (in packets per second). |
|
Throughput PPS (Peak) |
The maximal rate of packets successfully received for the network interface (in packets per second). |
|
Drops |
The total number of the dropped packets received since boot. |
|
Errors |
The total number of corrupted packets received since boot. |
Network Outgoing Traffic
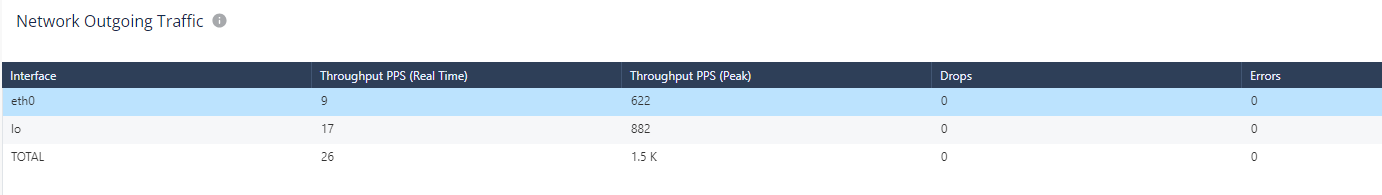
The Network Outgoing Traffic table shows:
|
Column Name |
Description |
|---|---|
|
Interface |
Name of the interface. |
|
Throughput PPS (Real Time) |
The rate of packets successfully received over the communication channel (in packets per second). |
|
Throughput PPS (Peak) |
The maximal rate of packets successfully received for the network interface (in packets per second). |
|
Drops |
The total number of the dropped packets received since boot. |
|
Errors |
The total number of corrupted packets received since boot. |
VPN
|
|
Note - The VPN tab and the widgets appear only for the supported asset types. |

VPN Throughput Timeline

The VPN Throughput Timeline widget shows the rate of data transfer through the VPN.
Probe Status Timeline

The Probe Status Timeline widget shows the status of the VPN tunnel over time. For more information about Network Probes, see R82 Site to Site VPN Administration Guide
Status of Network Probes
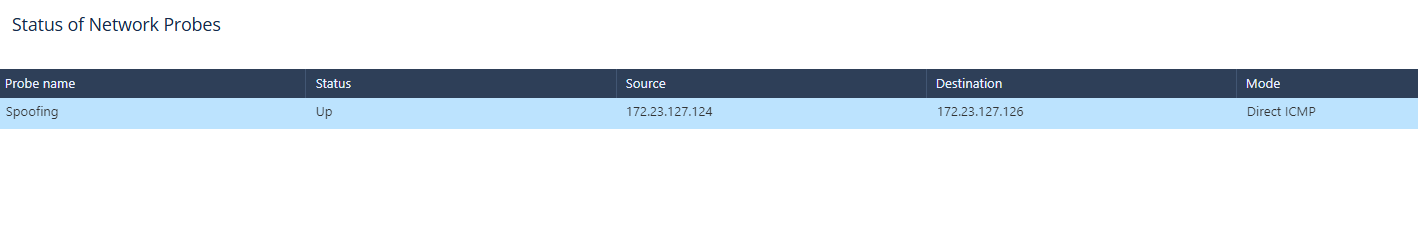
The Status of Network Probes widget shows the current status of VPN tunnel.
Status of VPN Tunnels

The Status of VPN Tunnels widget shows the status of current Site to Site VPN tunnels based on the configured Network Probes. For more information about Network Probes, see R82 Site to Site VPN Administration Guide
Hardware
|
|
Note - The Hardware tab and the widgets appear only for hardware assets (not for virtual machines). |

Temperature Timeline

The Temperature Timeline widget shows the current temperature of the sensor.
-
CPU cores (CPU0 and CPU1)
-
Incoming air (Intake)
-
Outgoing air (Outlet)
Voltage Timeline

The Voltage Timeline widget shows the current voltage of the sensor.
Fan Timeline

The Fan Timeline widget shows the CPU fan speed over time.
Status of Temperature Sensors
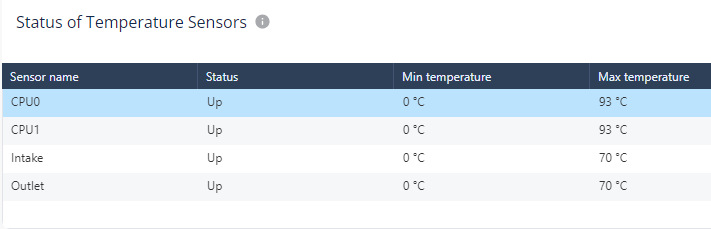
The Status of Temperature Sensors widget shows the status of the temperature sensors.
Status of Voltage Sensors

The Status of Voltage Sensors widget shows the status of the voltage sensors.
Status of Fan Sensors

The Status of Fan Sensors widget shows the status of the fan sensors.
|
|
Note - You can get data from the hardware sensors on Check Point appliances, in one of these ways: |
CloudGuard
In the CloudGuard tab, you can view the CloudGuard information for the asset.

|
|
Notes:
|
CME

The CME widget displays:
-
Status - Status of the Cloud Management Extension (CME).
-
Take Version - CME Take version
-
Auto Upgrade Mode - Specifies whether Auto Upgrade Mode is enabled for CME.
CME Accounts Status

The CME Accounts status widget displays:
-
A pie chart that displays the total number of CME accounts and their health status.
-
A table with health status of each CME account and the cloud provider (platform) associated with it.
Controller

The Controller widget displays:
-
Status - Status of the CloudGuard Controller.
-
Take Version - CloudGuard Controller Take version
-
Auto Upgrade Mode - Specifies whether Auto Upgrade Mode is enabled for CloudGuard Controller.
Scale Events

The Scale Events widget displays the scale-in and scale-out events over time:
-
When the graph goes up, it indicates a scale‑out event, where gateways are added to the Autoscaling Group.
-
When the graph goes down, it indicates a scale‑in event, where gateways are removed from the Autoscaling Group.
You can filter the widget to view:
-
All scale events
-
Top auto-scale events
License Utilization

The License Utilization widget displays the number of allocated license cores over time compared to the total cores available in the license pool. You can select the license pool from the list at the top-right corner.