Analytics Dashboard
Email Security's Analytics examines the scanned data and presents it in the form of useful information for your analysis and necessary remedial actions.
Email Security supports Analytics for these SaaS applications:
-
Office 365 SharePoint
-
Citrix ShareFile
-
Microsoft Teams
-
Slack
-
Box
To view analytics for a SaaS application:
-
Access the Email Security Administrator Portal.
-
From the left navigation panel, click Analytics > Dashboard.
-
Select the required SaaS application.
-
Select the period to view the analytics (Last 24 hours, 7 days, 30 days, 60 days, and 90 days).
Customizing the Analytics Dashboard using AI Copilot
In the Analytics page, the Infinity AI Copilot feature allows you to generate customized reports, charts, and dashboards using GenAI prompts.
If Infinity AI Copilot is unavailable in the Analytics dashboard, contact Check Point Support.
To customize the Analytics dashboard using AI Copilot:
-
Access the Email Security Administrator Portal.
-
From the left navigation panel, click Analytics > Dashboard.
-
Click Infinity AI Copilot next to the time frame from the top of the page.
-
Enter your prompt and click
 .
.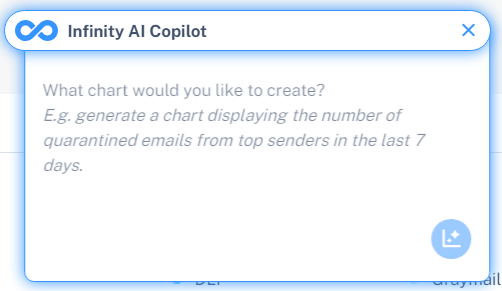
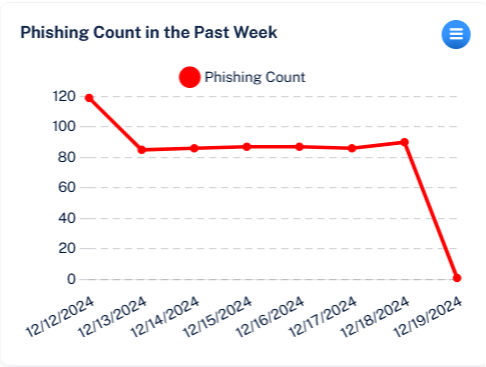
The system generates actionable data insights and analytics such as charts, tables, and other visualizations, in response to the provided GenAI prompt.
-
To make changes to the analytics generated using GenAI prompts, click the
 icon from the top left corner of the chart.
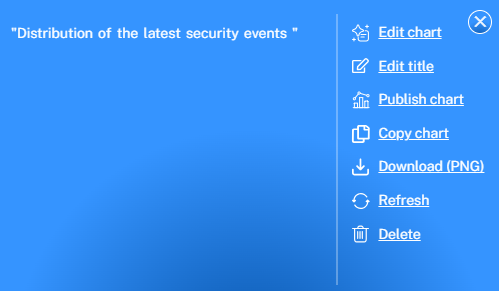
-
To change the title of the chart, click Edit title, make the necessary changes, and click Save.
-
To modify the prompt for the chart, click Edit chart, make the necessary changes, and then click
at the bottom of the chart.
Note - Until the chart is published, it remains visible only to you. To make the chart visible for all users, click Publish chart.
After publishing the chart, all users of the Email Security Administrator Portal in your organization can see them.
-
To move the chart to the desired location in the dashboard:
-
Click Drag chart.
-
Move the chart to the desired location.
-
Click Stop Drag Mode from the top left corner of the chart.
Notes:
-
This option is available only when there are multiple analytics created using Infinity AI Copilot.
-
You cannot change the position of the default analytics widgets.
-
-
To copy the chart, click Copy chart.
-
To download the chart as a PNG file, click Download (PNG).
-
To reload the chart, click Refresh.
-
To delete the chart, click Delete.
-
To return to the options and generated chart, click
 .
.
-