Email Security Flow Charts
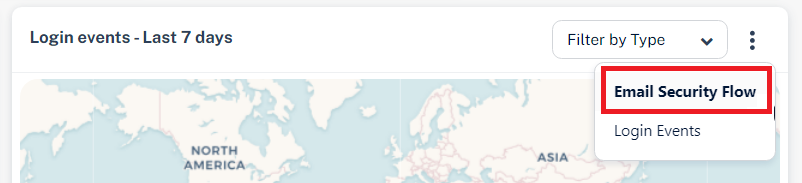
By default, the Overview page shows the Login Events map. To view Email Security Flow Charts, click the ![]() icon for Login Events widget and select Email Security Flow.
icon for Login Events widget and select Email Security Flow.
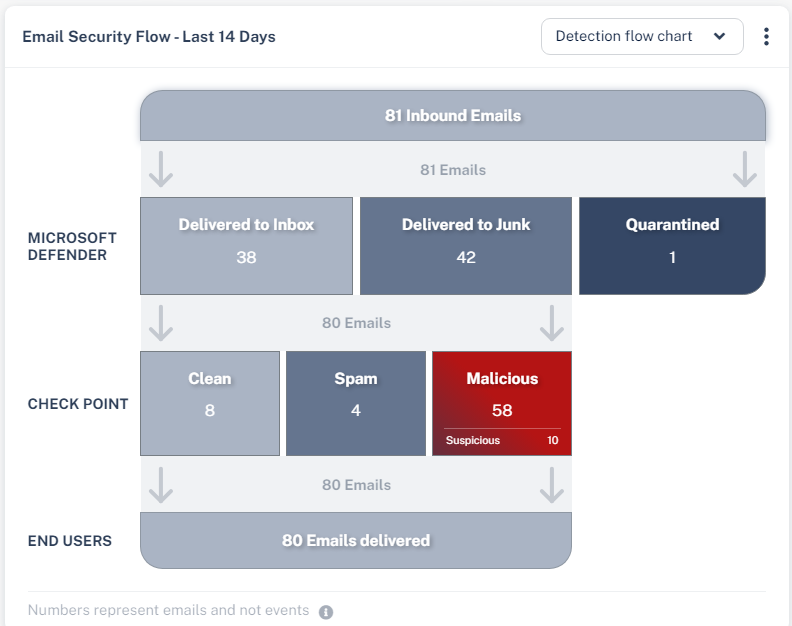
Detection Flow Chart
The Detection flow chart shows an overview of how many emails Microsoft decided to let through to the end users (delivered to Inbox/Junk folder) and how Email Security classified these emails.
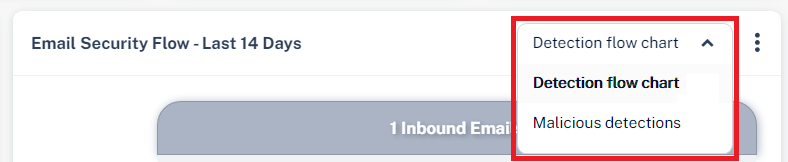
To view the chart, go to Overview page and in the Email Security Flow widget, select Detection flow chart from the drop-down in the top-right corner.
|
|
Notes:
|

|
Row name |
Email classification |
Description |
|---|---|---|
|
Microsoft Defender |
Delivered to Inbox |
Emails Microsoft intended to deliver to the inbox. |
|
Delivered to Junk |
Emails Microsoft intended to deliver to the Junk folder. |
|
|
|
Clean |
Emails detected as Clean by |
|
Spam |
Emails detected as Spam by |
|
|
Malicious |
Emails detected as Phishing and/or Malware by |
|
|
Suspicious |
Emails detected as Suspected Phishing and/or Suspected Malware by |
|
|
End Users |
- |
Number of emails delivered to the end users. |
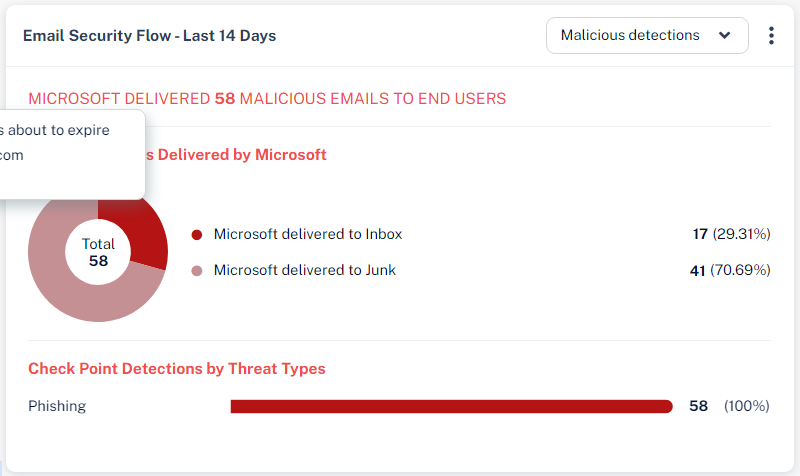
Malicious Detections Chart
The Malicious detections chart provides a deeper analysis of the distribution of the malicious detection by threat type.
To view the chart, go to Overview page and in the Email Security Flow widget, select Malicious detections from the drop-down in the top-right corner.
To view the emails filtered per selection, click on the relevant section. You will be redirected to the Mail Explorer page and shows the relevant emails.