
Security Widgets
Phishing

The Phishing widget shows the total number of phishing events detected in the selected time frame, including pending events.
To view the number of suspected phishing events, spam events, and events specific to a SaaS application, click the  icon.
icon.

To view specific events, click the indicators within the widget, and the system shows the filtered events on the Events page.
Business Email Compromise (BEC)
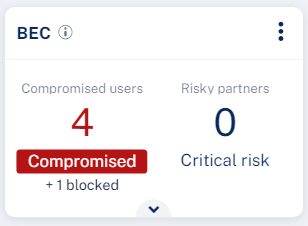
The Business Email Compromise (BEC) widget shows the number of compromised users and risky partners detected in the selected time frame.
To view the number of suspected anomaly events and lower risk partners, click the icon.
To view specific events, click the indicators within the widget, and the system shows the filtered events on the Events page.
Compromised Users
The Compromised Users are the users detected as compromised with high probability. It shows the number of Anomaly events with Critical severity.

For Microsoft SaaS applications, these tags appear at the top of the widget based on the configured anomaly detection workflow:
-
No prevention - Appears if the anomaly detection workflow is configured not to block the user automatically when an account is detected as compromised.
-
Full prevention - Appears if the anomaly detection workflow is configured to block the user automatically when an account is detected as compromised.
For more information, see Configuring Anomaly Detection Workflows.
In rare cases, this widget might be replaced with the Anomalies widget that shows information about the compromised users.
Malware
The Malware widget shows the total number of malware events detected in the selected time frame, including pending events.

To view the number of suspected malware events, and events specific to a SaaS application, click the icon.

To view specific events, click the indicators within the widget, and the system shows the filtered events on the Events page.
DLP
The DLP widget shows the total number of DLP events detected in the selected time frame, including pending events.

To view the number of blocked DLP events, leaked DLP events, and events specific to a SaaS application, click the icon.
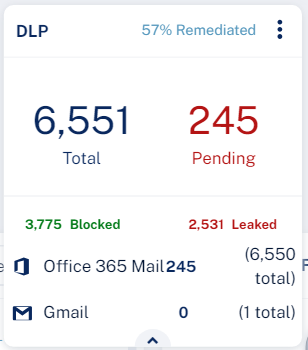
To view specific events, click the indicators within the widget, and the system shows the filtered events on the Events page.
User Interaction

The User Interaction widget shows the number of pending restore requests and phishing reports in the selected time frame.
To view the total number of restore requests, phishing reports and their average SLA in the selected time frame, click the icon.

To view specific requests, click the indicators within the widget, and the system shows the filtered events on the Restore Requests / Phishing Reports page.
In rare cases, this widget might be replaced with the Shadow IT widget.
Shadow IT

The Shadow IT widget shows the total number of Shadow IT events detected in the selected time frame, including pending events.
To view the Shadow IT events, click the icon.
To view specific events, click the indicators within the widget, and the system shows the filtered events on the Events page.