Traffic Explorer
Traffic Explorer helps you visualize events of interest in the network traffic of your environments and Kubernetes![]() Kubernetes, often abbreviated as “K8s”, orchestrates containerized applications to run on a cluster of hosts. clusters. It gathers and presents information from environment logs and workload network logs, enriched with information from more sources such as threat intelligence feeds, IP reputation databases, and geolocation databases.
Kubernetes, often abbreviated as “K8s”, orchestrates containerized applications to run on a cluster of hosts. clusters. It gathers and presents information from environment logs and workload network logs, enriched with information from more sources such as threat intelligence feeds, IP reputation databases, and geolocation databases.
You can find when services, applications, or databases are exposed to the Internet and if there are possible data exfiltration attempts.
Traffic Explorer has three primary views:
-
Graph view
-
Logs view
-
Statistics view
Graph View
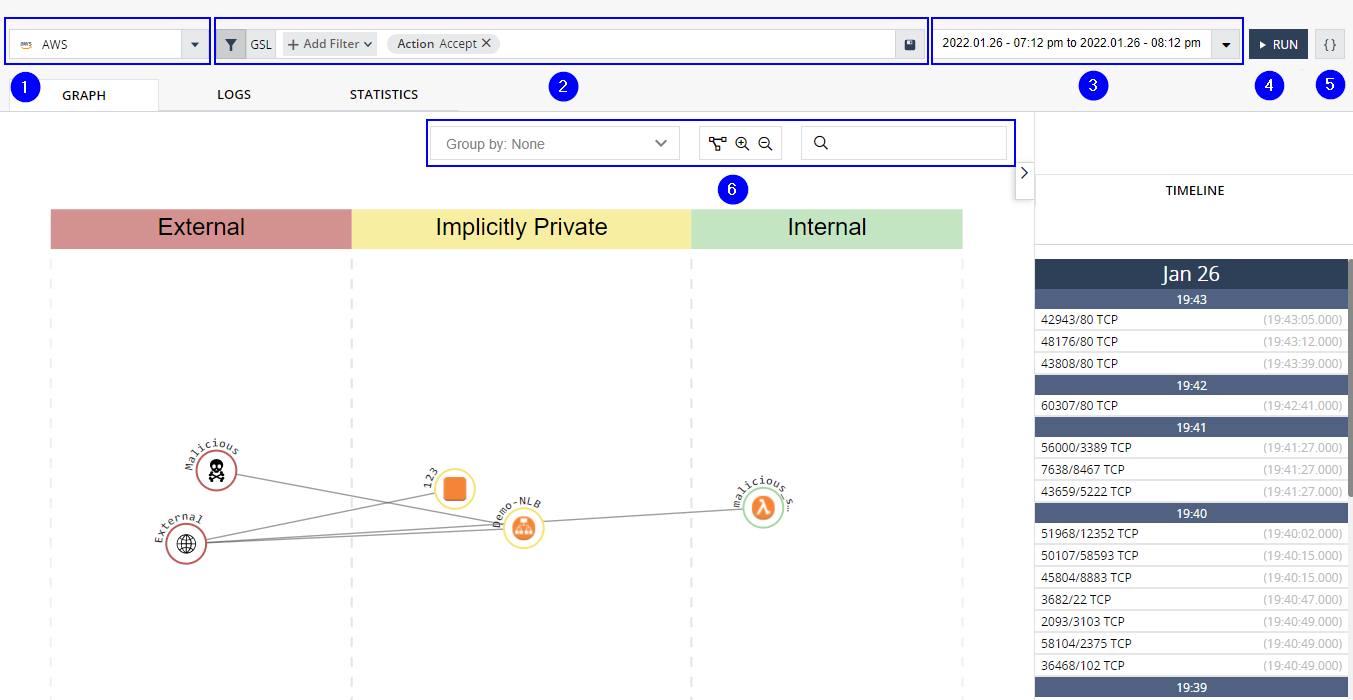
The Graph view shows network traffic in your cloud environment or Kubernetes cluster, based on the collected flow logs.
Graph view elements
|
Item |
Description |
|---|---|
|
1 |
Environment selector |
|
2 |
GSL query |
|
3 |
Time frame menu |
|
4 |
Run button |
|
5 |
Query menu |
|
6 |
Group and Zoom buttons |
Toolbar
The toolbar at the top of the page contains these buttons:
-
The Environments list (1) on the top left contains only environments with Traffic Activity enabled (onboarded to Intelligence with Flow Logs).
-
The GSL query (2) enables you to search for network resources or network flows. You can specify in the query the details of specific packets, bytes, source, or destination to monitor traffic and interconnectivity of the resources that belong to your environment or cluster. Edit the query text directly in the box or open a graphic query editor.

-
The time frame (3) is the period back from the current time (15 min, 1 h, 24 h, 7 d) or start and end dates for a specific time range. To change the time frame for the view, select a new value and click Run (4) to run a new query.

Note - The graph shows only actual traffic between entities. Entities without network activity during the selected time frame are not seen.
-
The Queries icon
 (5) allows you to select a query from an applicable category.
The central part shows a graph of the environment entities and the network traffic between them, based on the query and the time frame. Each graph node represents a cloud asset or a Kubernetes entity (pod![]() The smallest and simplest Kubernetes object. A pod represents a set of running containers on your cluster.
A pod is typically set up to run a single primary container. It can also run optional sidecar containers that add supplementary features like logging. Pods are commonly managed by a Deployment., node, or service). The entities are grouped into zones (for example, External, DMZ, and Internal) according to the exposure of the entity to the Internet. External entities are exposed, so they have Internet addresses, while Internal entities have no exposure to the Internet.
The smallest and simplest Kubernetes object. A pod represents a set of running containers on your cluster.
A pod is typically set up to run a single primary container. It can also run optional sidecar containers that add supplementary features like logging. Pods are commonly managed by a Deployment., node, or service). The entities are grouped into zones (for example, External, DMZ, and Internal) according to the exposure of the entity to the Internet. External entities are exposed, so they have Internet addresses, while Internal entities have no exposure to the Internet.
|
|
Note - Kubernetes pods that run on a host network do not appear as different entities, so their traffic combines with the traffic of the applicable node. |
Groups
Based on the environment platform, you can group the visible assets by common characteristics:
-
Effective Policy (AWS
 Amazon® Web Services. Public cloud platform that offers global compute, storage, database, application and other cloud services., Azure Collection of integrated cloud services that developers and IT professionals use to build, deploy, and manage applications through a global network of data centers managed by Microsoft®.) - Unifies assets with the same policy.
 -
Name (AWS, Azure) - Unifies assets below the same name.
-
VPC (AWS, Azure) - Unifies assets that belong to the same VPC.
-
Services (Kubernetes) - Unifies assets by services or workloads (as Controller groups). For example, if pods are part of a DaemonSet or a Service, they appear as a group with an option to ungroup.
Pods without an owner reference, and cluster nodes, appear below the No Services Group.
-
Namespace (Kubernetes) - Unifies all pods or services in the same namespaces.
Click one of the groups. The pane on the right shows a list of entities in the group. Groups of size 1 appear as regular graph nodes.
Zoom Controls
You can control the view with these tools:
-
Zoom: Select a point in the center section of the view and use your mouse scroll wheel to zoom the display in or out. Alternatively, use the zoom controls at the top of the view (
 )
) -
Select an entity in the view to show its details in the right pane. Many details are links to more information.
Click in the central area of the view (not on an entity) to go back to the previous view, of all entities.
Logs View
You can examine the actual log information for a selected entity. The information is based on the flow logs and enriched by Intelligence with more contextual information.
To open the Logs view, do one of these:
-
Navigate to the Traffic Explorer page in the Network Security menu and click the Logs tab.
-
Navigate to the Network Traffic page in the Events menu.
Click an entity in the table to see its details.
Click entities in the details pane to add them to the query and narrow the query to specific items of interest.
Statistics View
You can see the statistics for the environment network traffic. Some traffic statistics are based on the network logs that match the GSL query in the specified time frame.
You can add more filter options to the query from the statistics elements to focus on specific results. Click an element and select the logic with which to add it to the query (AND, OR, NOT). You can add multiple filter additions.
Actions
This view shows network logs filtered by a query.
-
Navigate to the Traffic Explorer page in the Network Security menu. The Graph view opens with the default query applied to the flow logs of an environment.
-
From the Select Environment list on the top left, select the name of your environment.
-
Click
on the toolbar to open the Query menu. -
Select a query from the list.
-
The page updates to apply the selected query to the log data for the environment.
-
You can change the query for this view at any time. Open the query menu and select a new query. You can also enter a new query directly in the query box or build one interactively with the editor.
You can filter the Traffic Explorer views to focus on events of interest.
Graph filter
Select filter options in the filter bar. You can select more than one option; all are applied to the view.
-
Classifications - A swimlane zone in the view (for example, External, DMZ, or Private)
-
Action - A specific traffic action (ACCEPT, REJECT)
-
Malicious - select malicious or non-malicious sources of traffic
-
Region (AWS, Azure) - A specific cloud region
-
VPC (AWS, Azure) - A specific cloud VPC in the environment
-
Source Asset Type - Select specific asset types for traffic source
-
Destination Asset Type - select specific asset types for a traffic destination
After you make changes to the filter, click Run to re-run the query and update the graph.
Statistics filter
You can add more terms to the query based on statistics results in the Statistics view.
-
Click a detail on a statistics widget.
-
Select the logic to add this to the query (AND, OR, NOT). The selected property adds to the query string.
More Links