Skyline Configuration on Spark Firewall Appliances
Video Tutorial
|
|
Note - This video was created for Check Point Servers that run Gaia OS. Ignore these video parts:
|
Watch a brief video tutorial on how to install and configure Skyline:
Step 1 - Install the Prometheus Server
|
|
Note - Skip this step if you have already installed the Prometheus Server |
Installing a Prometheus Server
To install a Prometheus Server on the external server, refer to the Prometheus installation instructions for the various platforms.
Prometheus Server Default URL
|
|
Configuring a Prometheus Server
-
Mandatory: On the Prometheus Server, enable the flag "
--web.enable-remote-write-receiver" to get metrics data from the Check Point Servers. Refer to these Prometheus instructions. Note - The "
--web.enable-remote-write-receiver" is a command-line flag used when starting a Prometheus server. It enables the Prometheus instance to act as a receiver for remote write requests. -
Optional: Use TLS Encryption and Basic authentication to secure the connection between the Prometheus Server and the OpenTelemetry Collector.
 Instructions
The Prometheus Server and OpenTelemetry Collector support Transport Layer Security (TLS) encryption for their connection. Refer to these Prometheus instructions.
Check Point also requires you to enable basic authentication to make the security bi-directional, refer to these Prometheus instructions.
TLS configuration has two main components:
-
A pair of a Key and a Certificate, used to encrypt your communication.
-
(Optional) Certificate Authority (CA) that you trust, used to verify and trust the certificate of the other endpoint with which you communicate. If the certificate of the other endpoint is unknown to the CA, the communication is rejected.
You can create these certificates:
-
CA-signed certificates: You create a key and a certificate request, which is then signed by the CA.
-
Self-signed certificates: You create a key and a certificate that is signed by the user.
The steps below describe a self-signed certificate.
To configure TLS, you must create two pairs of a key and a certificate on the Prometheus Server:
-
Create a self-signed certificate and a private key on the Prometheus Server:
-
Create the file called
openssl.confwith the template below.Enter the applicable information in the "
[ dn ]" and "[ alt_names ]" sections.
Important - The Prometheus Server and the OpenTelemetry Collector must have different hostnames and IP addresses.
Template:
[ req ]
default_bits       = 4096
default_md         = sha256
req_extensions     = v3_req
distinguished_name = dn
prompt = no

[ v3_req ]
subjectAltName = @alt_names

[ dn ]
C = <Country Name>
ST = <State Or Province Name>
L = <Locality>
O = <Organization>
OU = <Organization Unit>
CN = <Common Name>

[ alt_names ]
DNS = <HOSTNAME>
IP = <IP ADDRESS>
-
Generate the key and certificate pair on any Gaia OS server (in the Expert mode):
cpopenssl req -x509 -newkey rsa:4096 -nodes -config openssl.conf -keyout mykey.key -out mycert.crt -extensions v3_reqThis command creates two files in the current working directory:
-
mykey.key -
mycert.crt
Move these two files from the Gaia OS server to the Prometheus Server.
-
-
-
Use the newly generated key and certificate file to configure TLS on the Prometheus Server in the
web-config.yamlconfiguration file (you may need to create this file).Example of a
web-config.yamlfile:tls_server_config: key_file: /home/admin/mykey.key cert_file: /home/admin/mycert.crt
-
Step 2 - Install the Grafana Server
|
|
Note - Skip this step if you have already installed the Grafana Server. |
Installing a Grafana Server
To install a Grafana Server on the external server, refer to the Grafana installation instructions.
|
|
Note - You can install the Grafana Server on the same server that contains your Prometheus Server instance. |
Grafana Server Default URL
|
|
Configuring a Grafana Server (connecting Data-source and Dashboards)
-
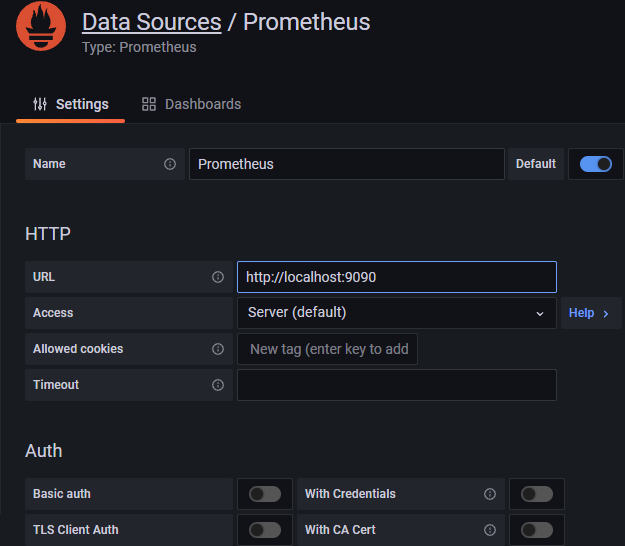
Log in to Grafana and add a new Prometheus Data Source with the Prometheus Server you created.
On the side panel, click Home > Connections > click the Add data source button > select the Prometheus data source.
Make sure to mark the Prometheus data source as Default.
Example:
-
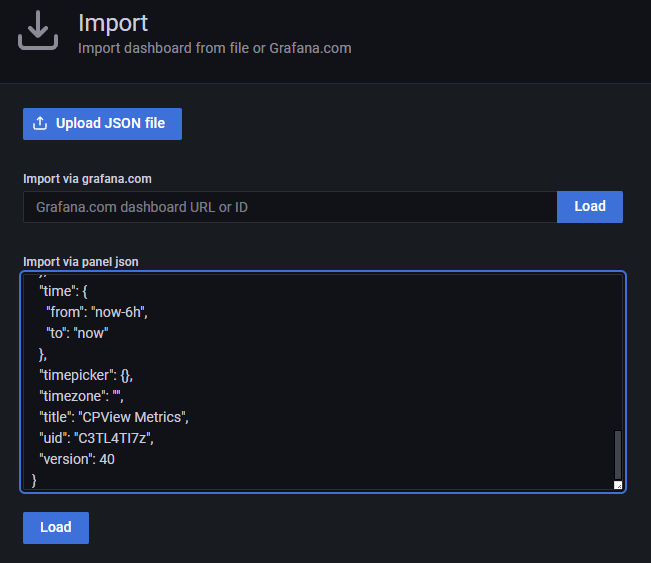
Import the Check Point Grafana dashboard to start monitoring your environment.
On the side panel, click Create > Import > upload the applicable JSON file for a dashboard.
Example:
-
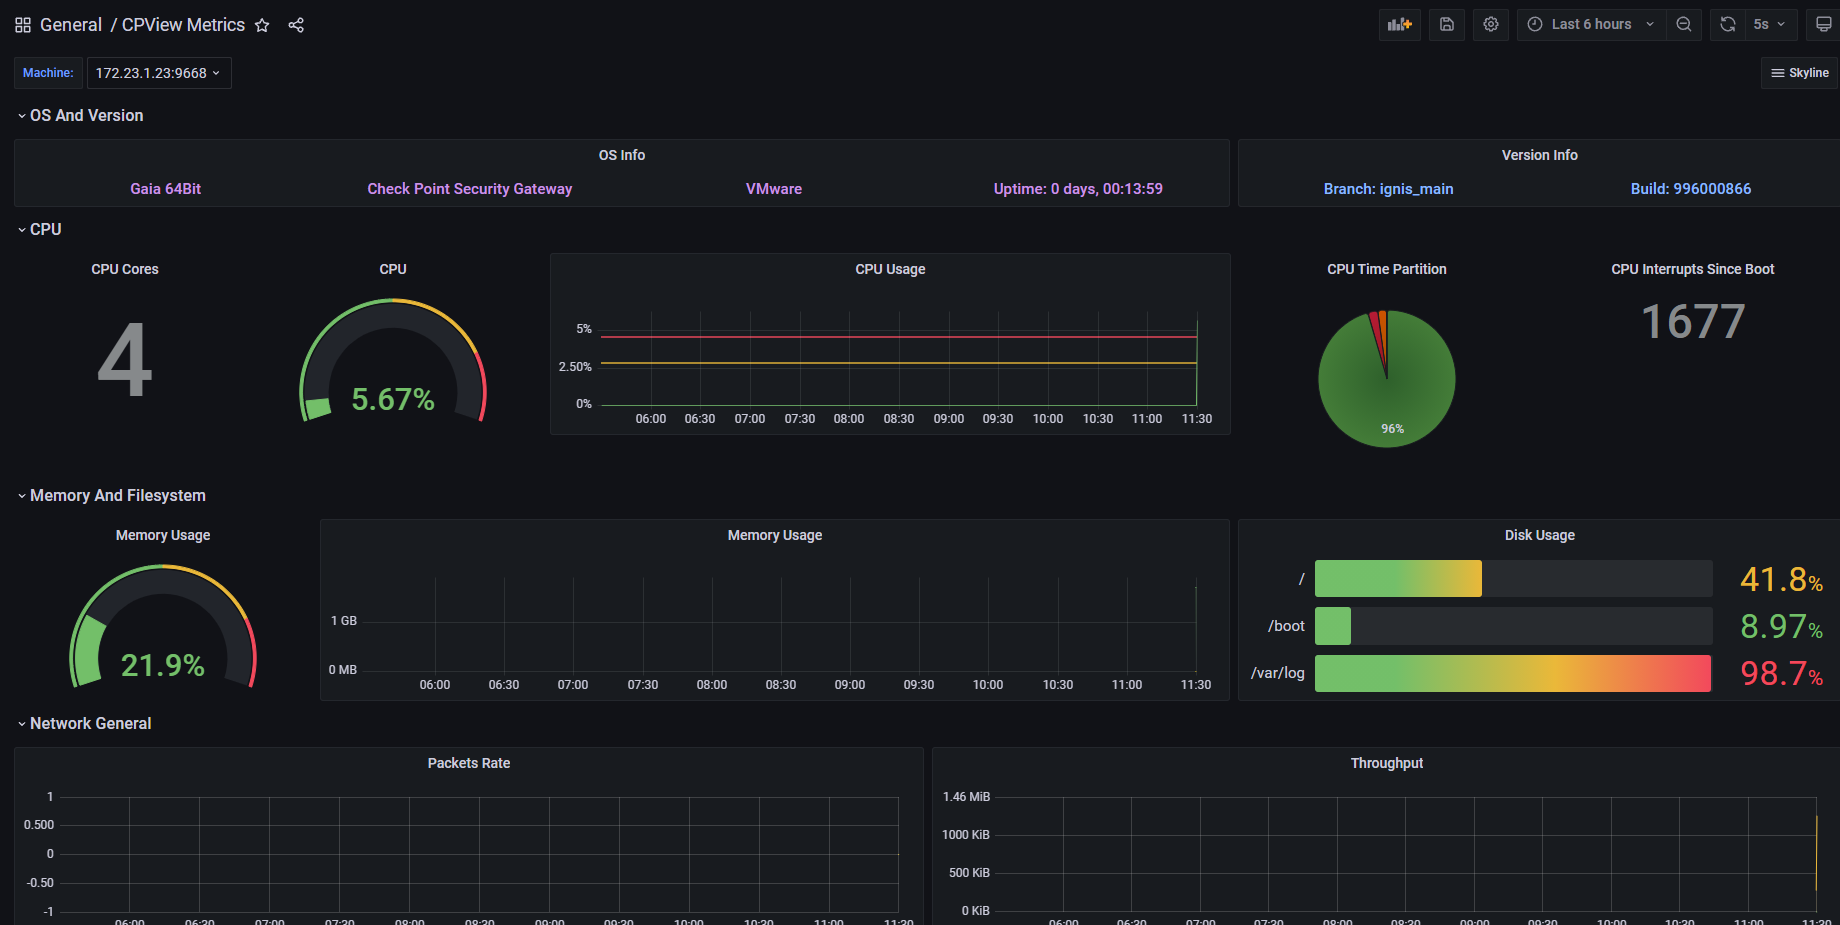
You can modify the existing dashboards or create new dashboards according to your needs.
To see a full description of all the data exposed by Skyline, see Skyline Metrics Repository.
Example:
Step 3 - Install the OpenTelemetry Agent and OpenTelemetry Collector on the Spark Firewall Appliance
The Spark Firewall Appliance must be connected to the Internet.
If the Spark Firewall Appliance is connected to the Internet and you enable the Skyline feature, then:
-
The appliance automatically downloads the OpenTelemetry Agent (
OtlpAgent) and the OpenTelemetry Collector (CPotelcol) packages. -
The appliance automatically downloads the latest version of the OpenTelemetry Agent package each night.
Step 4 - Configure OpenTelemetry Collector on the Spark Firewall Appliance to work with the Prometheus Server
You can configure the required settings in WebUI or in Gaia Clish.
-
From the left navigation panel, click Logs & Monitoring.
-
In the Diagnostics section, click the OpenTelemetry page.
-
Select Monitor this appliance using OpenTelemetry.
-
In the URL field, enter the full path of the receiver endpoint on your monitoring server.
Example:
https://192.168.33.44:9090/api/v1/write -
Optional: In the Client Authentication section, enter the username and password to connect to your monitoring server.
-
Optional: In the Server Authentication section, upload the CA certificate of your monitoring server:
-
Click Upload.
-
Click Browse.
-
Select the certificate file and click Open.
-
Click Preview CA details to examine the certificate and click Close.
-
Click Save.
-
-
Optional: Click Test Connection to make sure the correct server and credentials were entered.
-
In the bottom right corner of this page, click Save.
Syntax:
set open-telemetry
      cert-base64-encoding "<Base64-Certificate-String>"
      is-active {on | off}
      password <Password>
      url <Full URL>
      username <Username>
|
show open-telemetry |
Syntax Parameters:
|
Parameter |
Description |
|
|---|---|---|
|
|
The Base64-encoded Certificate String for the CA certificate of your monitoring server. This is the string that appears in a certificate file between the line " Example:
|
|
|
|
Enables ( |
|
|
|
Specifies the password on your monitoring server. |
|
|
|
Specifies the full path of the receiver endpoint on your monitoring server. Example: |
|
|
|
Specifies the username on your monitoring server. |
Instructions:
-
Configure the required settings:
set open-telemetry url "https://192.168.33.44:9090/api/v1/write" username myuser1 password mypassword1 cert-base64-encoding "MIICRzCCAbCgAwIB...(truncated)...H2IZALydA87zbag=" is-active on -
Examine the configuration:
show open-telemetry
Step 5 - Configure Access Policy
You must make sure your Access Policy allows the connection from the Spark Firewall Appliance to the Prometheus Server to send the exported metrics.
On a Locally Managed Spark Firewall Appliance:
You must configure the required settings in WebUI or in Gaia Clish.
See the:
On a Centrally Managed Spark Firewall Appliance:
You must configure the required rule on the Management Server (in SmartConsole or with Management API) and install the policy.
See the:
-
Security Management Administration Guide for your version.
-
Check Point Management API Reference (at the top, select the correct version) .