Real-time Monitoring : Skyline
Solution for real-time monitoring of the Quantum Family devices.
Skyline quickly and efficiently monitors your Check Point servers with industry-standard software and protocols (OpenTelemetry, Prometheus, and Grafana).
Skyline provides an OpenTelemetry CPView Agent service. The OpenTelemetry CPView Agent runs on a Check Point server to collect and export health metrics from the Check Point CPView tool to an external location.
The Skyline architecture includes three primary components:
|
Component |
Description |
|---|---|
|
OpenTelemetry CPView Agent |
Runs on Check Point servers. A service that queries CPView at defined intervals, collects the metrics, and exports them to an OpenTelemetry Collector. |
|
OpenTelemetry Collector |
Runs on Check Point servers. An open-source service that receives metrics from multiple Agents and exports them to an external endpoint (a different OpenTelemetry Collector or a Prometheus Remote-Write). |
|
Prometheus and Grafana Servers |
Third-party software that runs on an external server. The Prometheus Server receives data from the OpenTelemetry Collector, saves it in a Timeseries Database, and visualizes the data with visualization tools like Grafana. |
Additional info can be found in sk178566
Demo Configuration
-
Check Point R81.20 Gateway with Jumbo Hotfix Accumulator - Take 10
-
External Servers : Prometheus & Grafana
Instructions
|
Step |
Instructions |
|---|---|
|
1 |
Open Chrome on Jump-Server VM and Click on the Bookmark Machines Overview - Dashboards - Grafana :
Grafana User Name : admin Password : Cpwins1! |
|
2 |
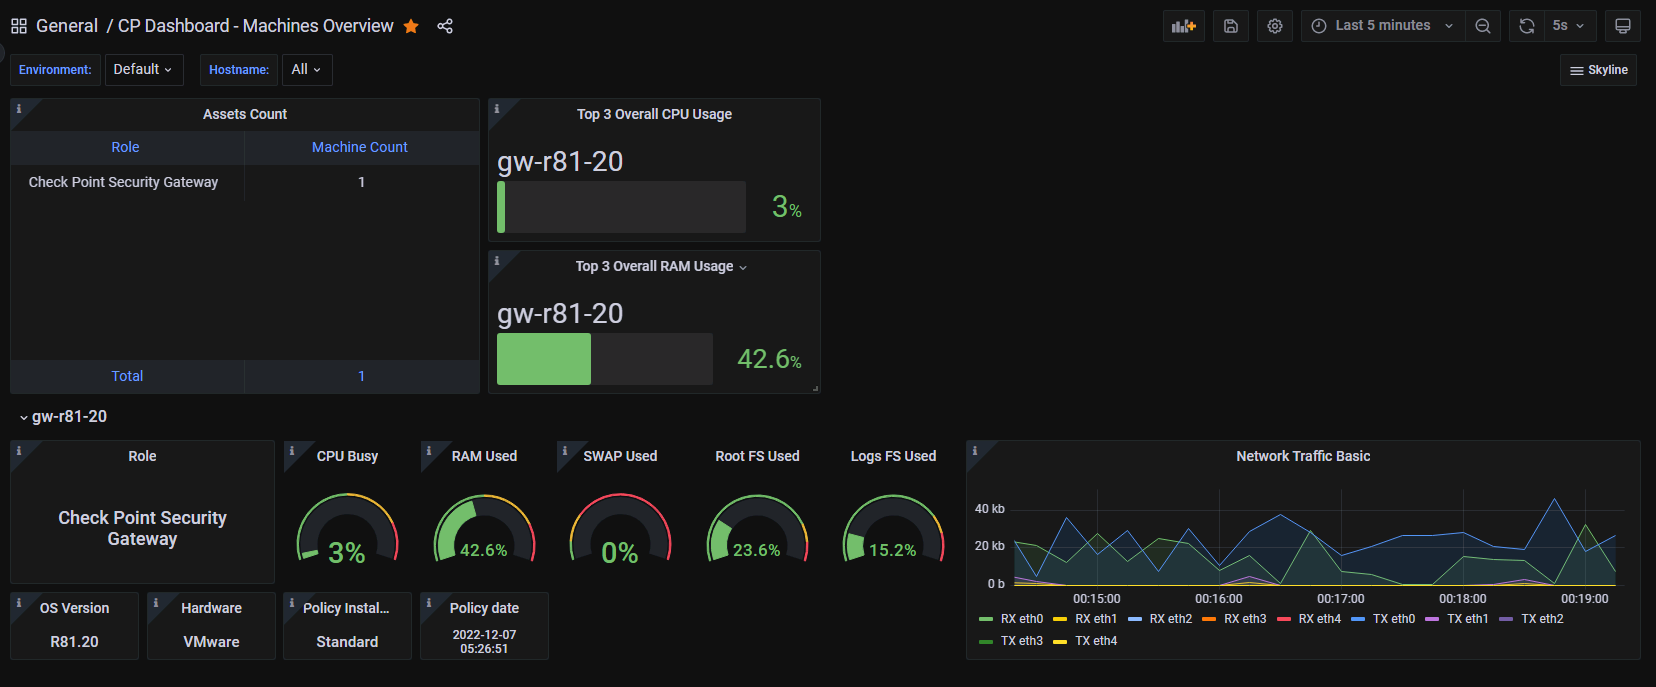
On the Machines Overview Dashboard - You will have the following panels :
|
|
3 |
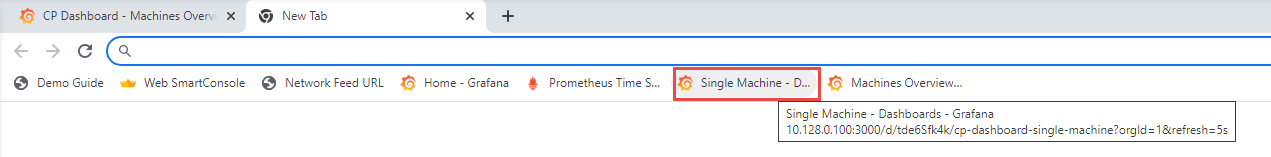
Open new tab on Chrome browser and Click on the Bookmark : Single Machine - Dashboards - Grafana to open detail & visual views for the R81.20 Gateway :
|
|
4 |
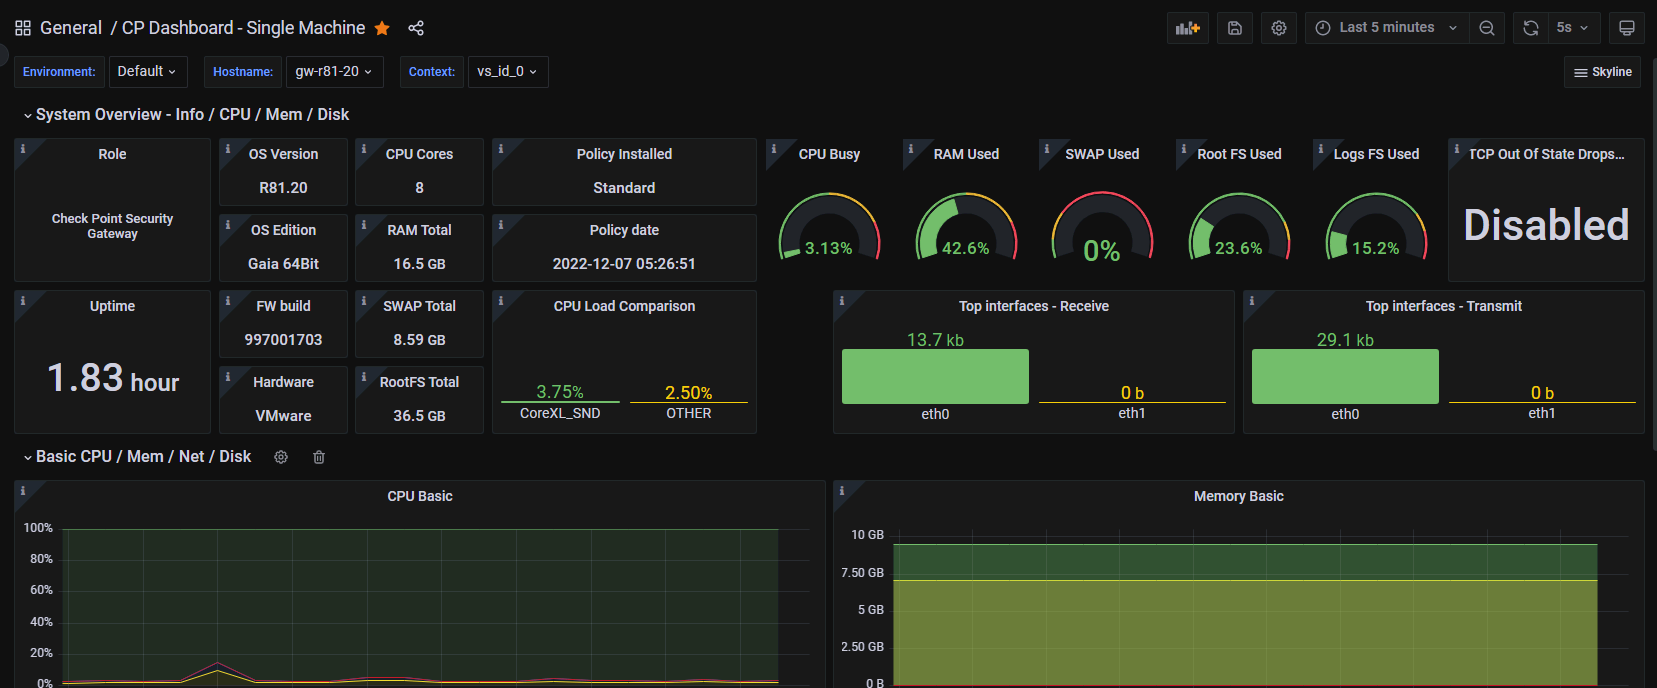
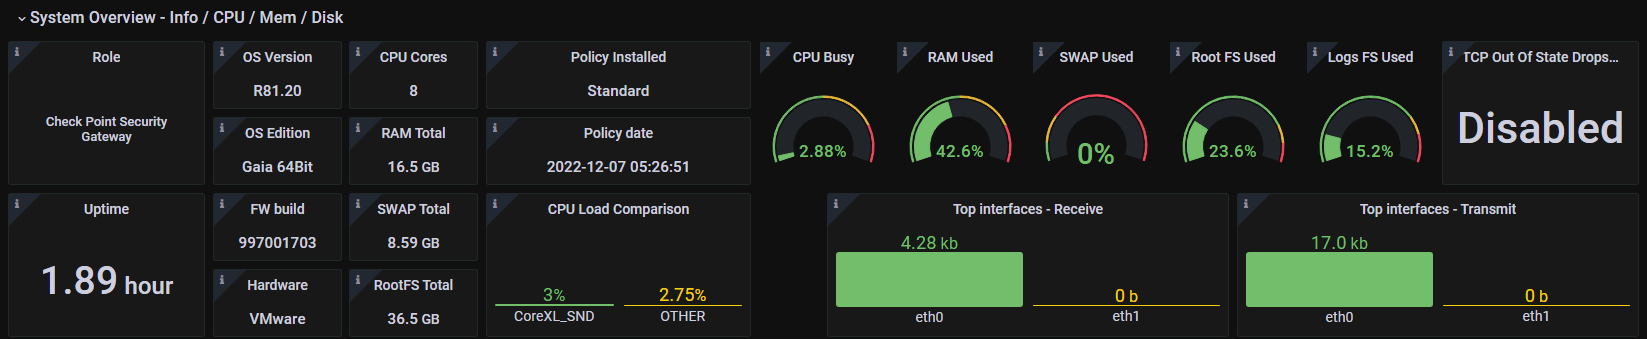
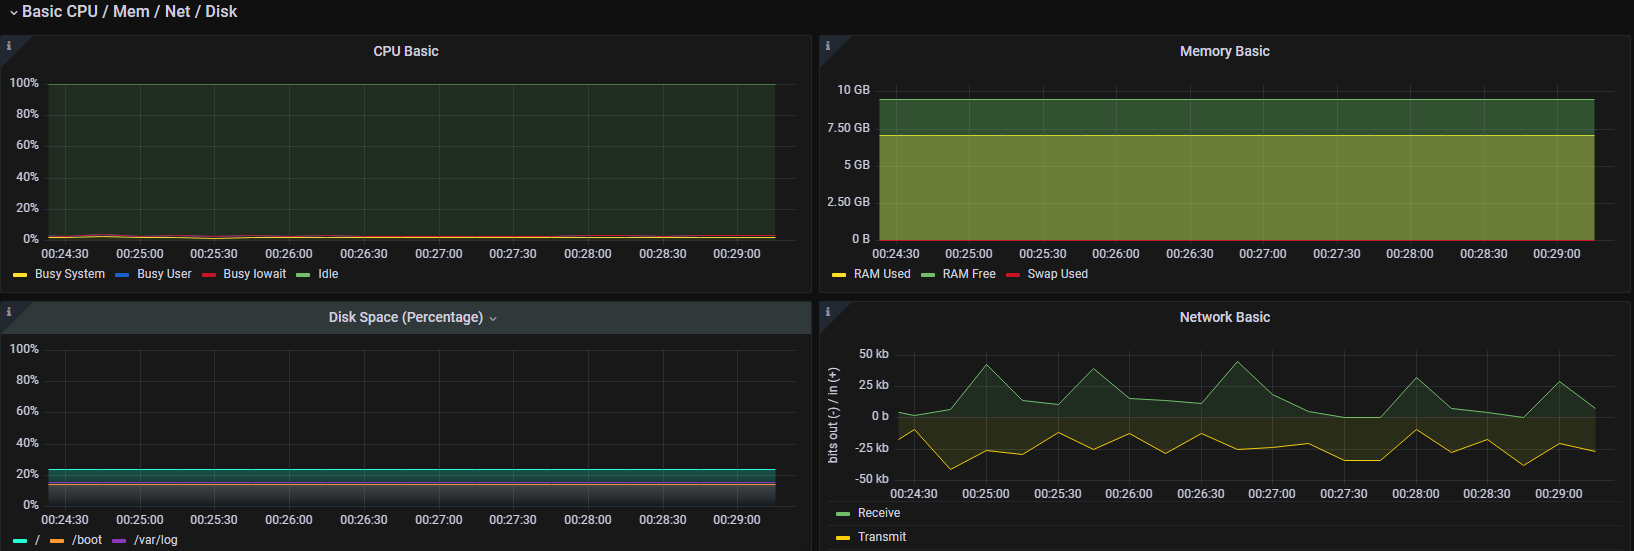
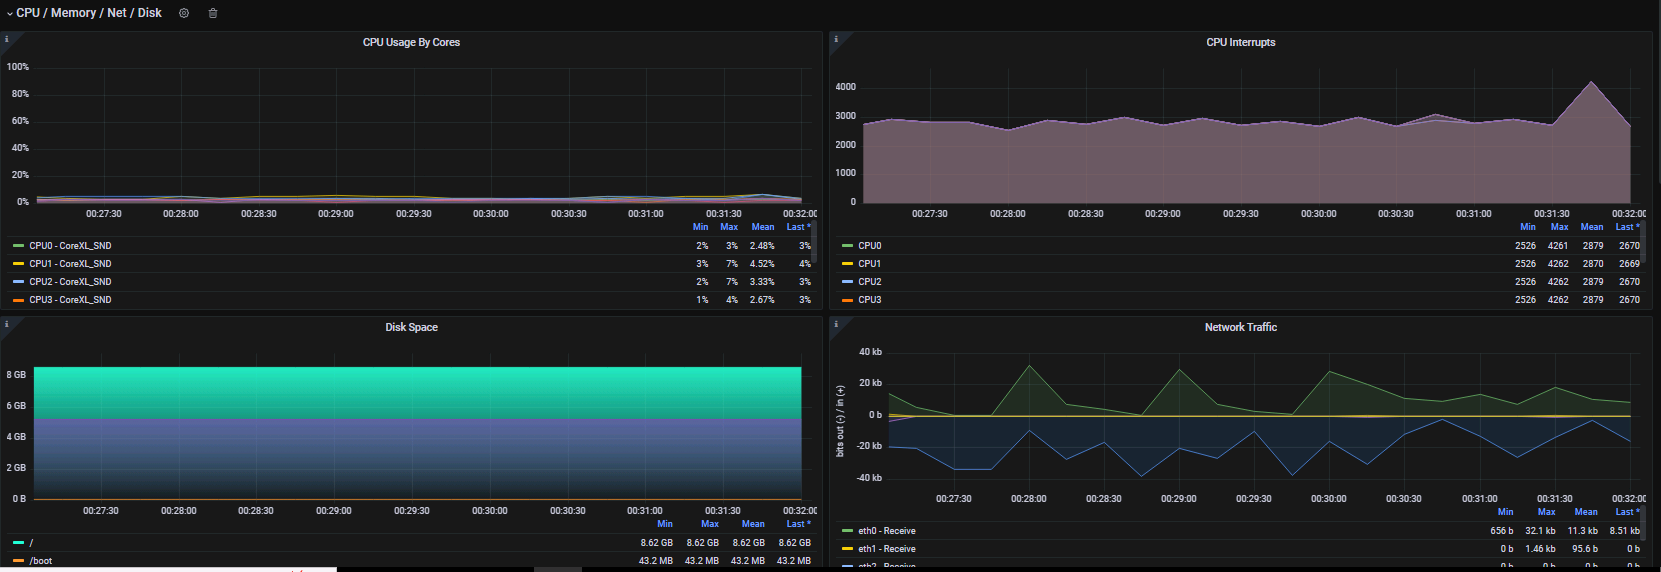
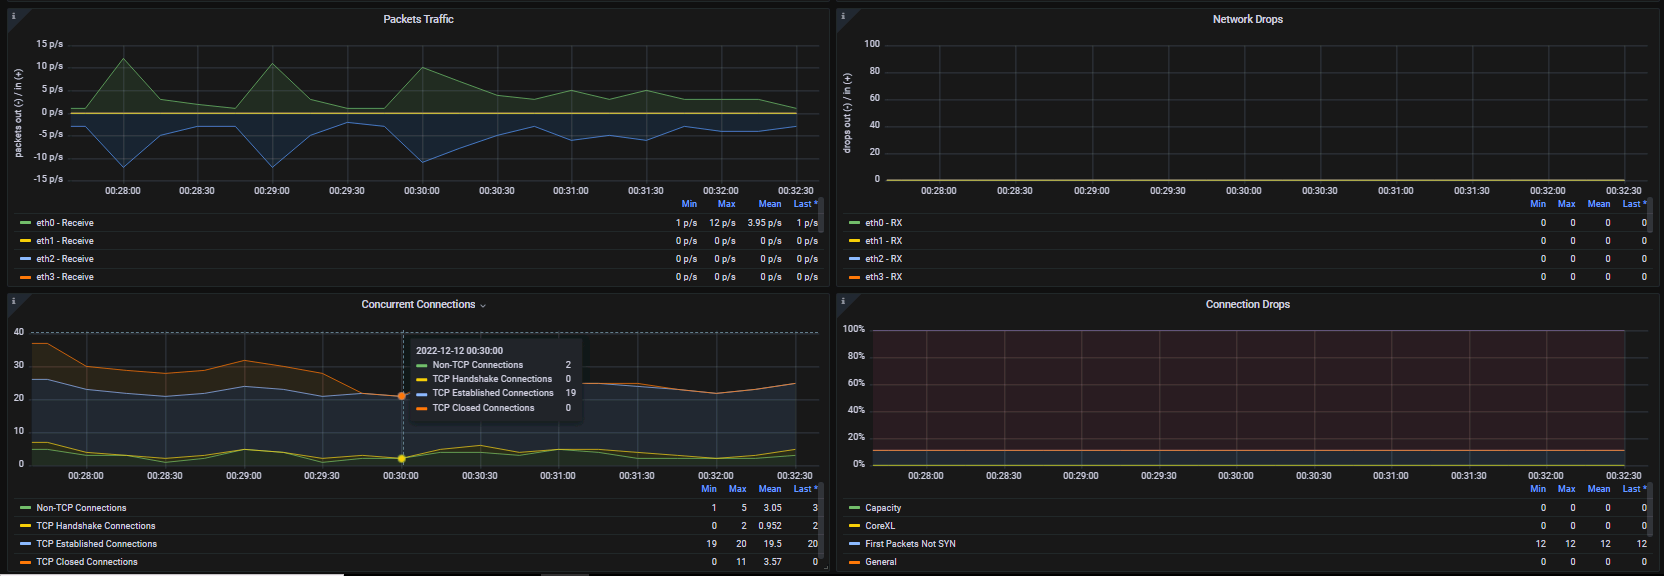
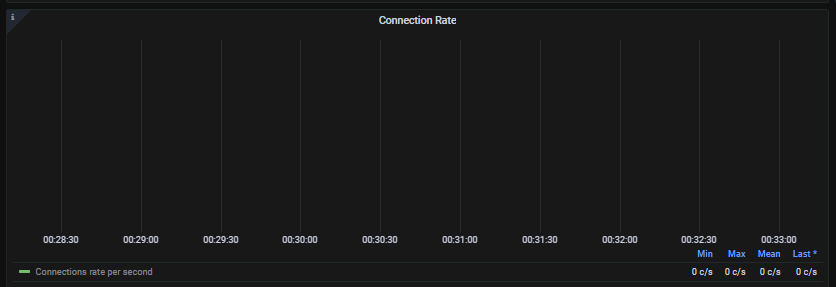
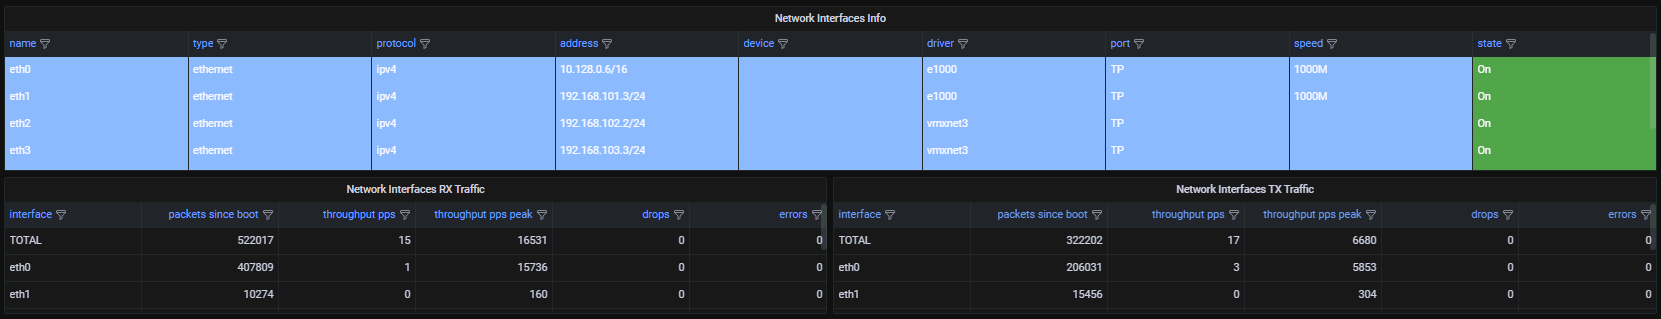
On the Single Machine Dashboard you will have the following visual panels for the R81.20 Gateway :
|