Demo Steps
|
Step |
Instructions |
||||||||||||
|---|---|---|---|---|---|---|---|---|---|---|---|---|---|
|
1 |
Sign in to CloudGuard CNAPP Pipeline Security (Spectral) Demo :
|
||||||||||||
|
2 |
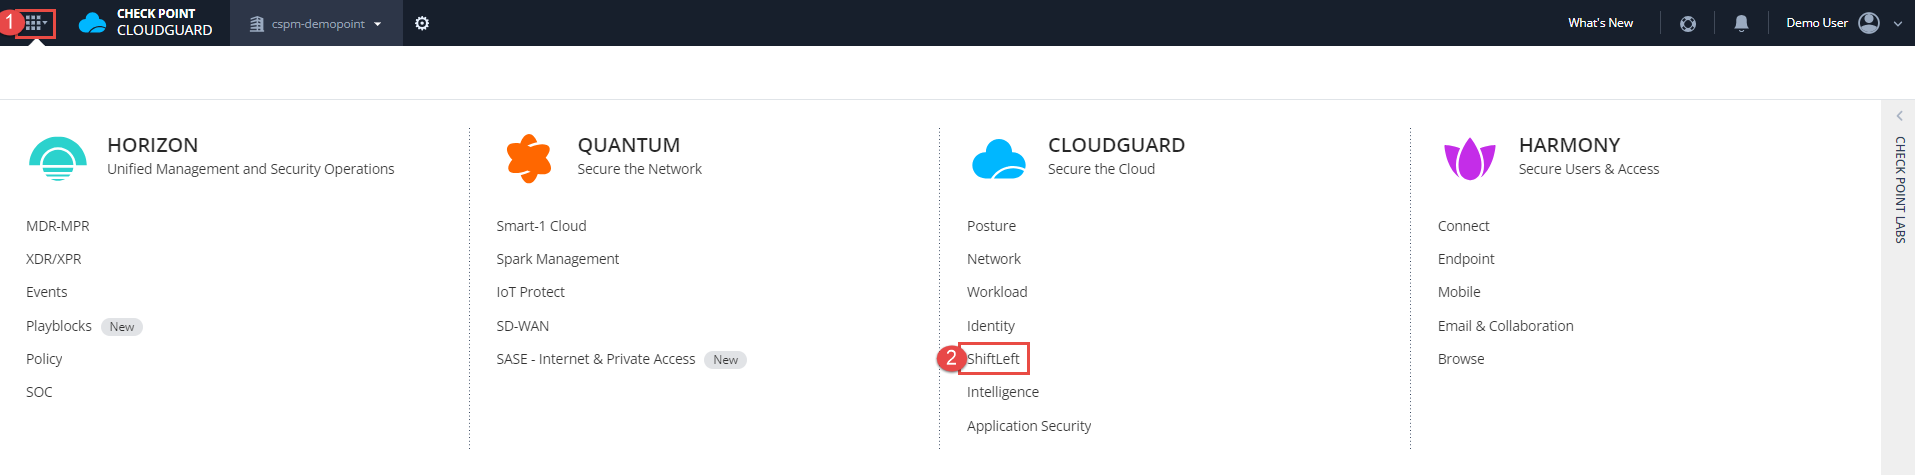
Navigate to the CloudGuard > Shiftleft.
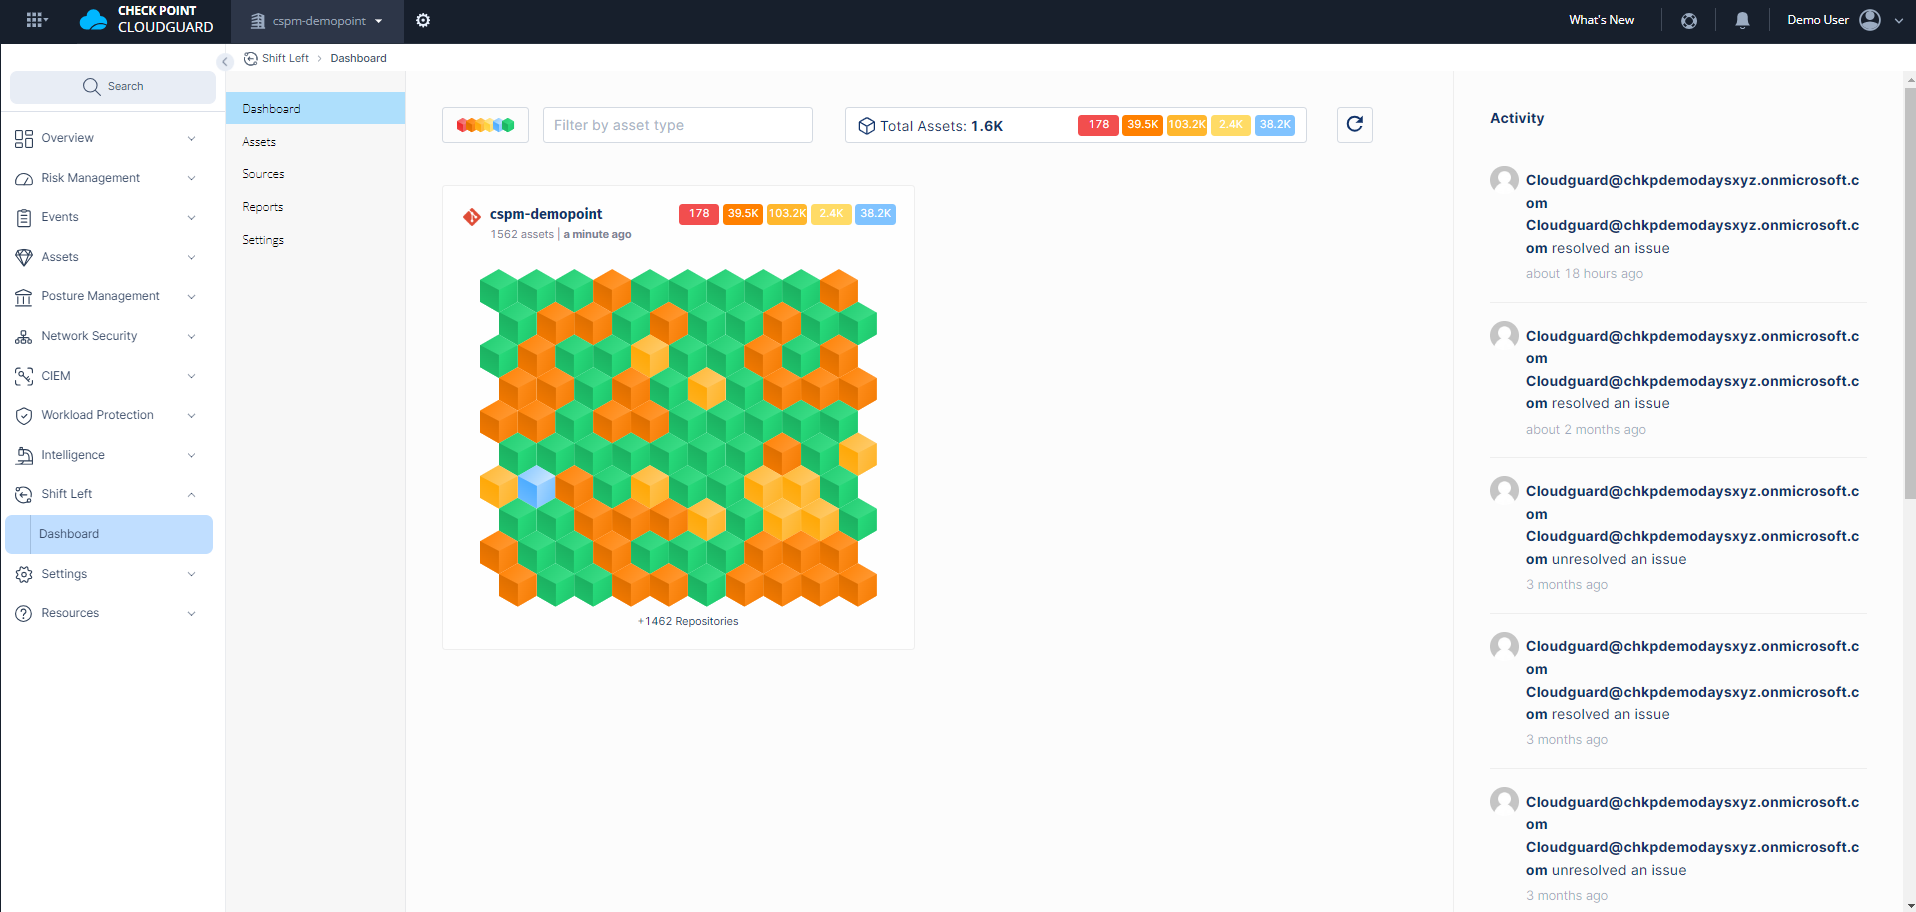
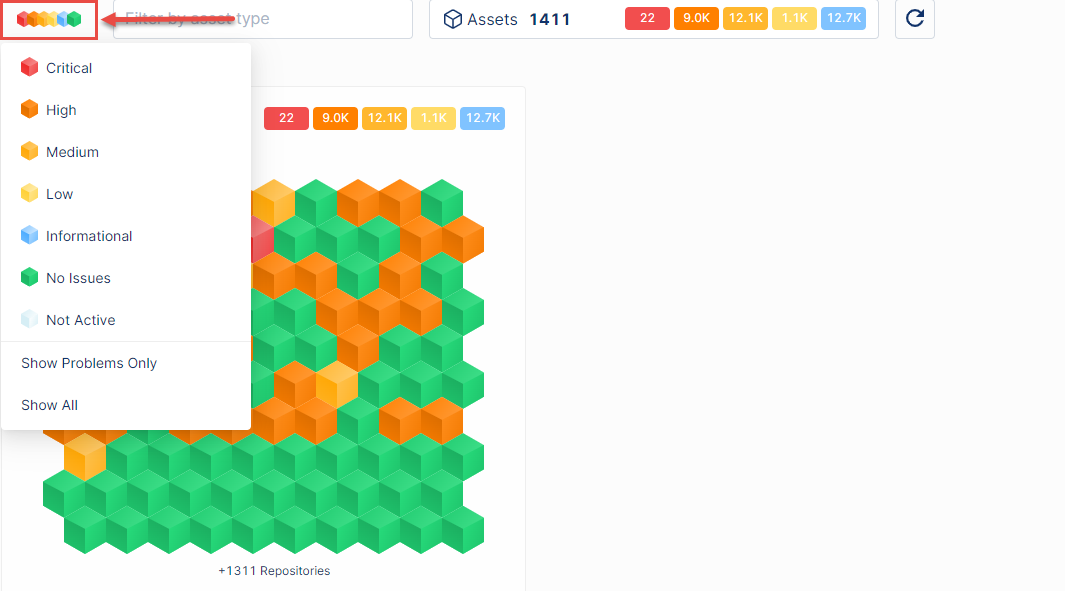
The Dashboard provides an overview of all your organization's assets. Each cube inside the cards represents an asset, like a repository or a container.
ShiftLeft provides the following statuses for your assets : Critical , High , Medium , Low , Informational , No Issues and No Active. The status filter in the upper-left corner can help you focus on assets of a specific status.
|
||||||||||||
|
3 |
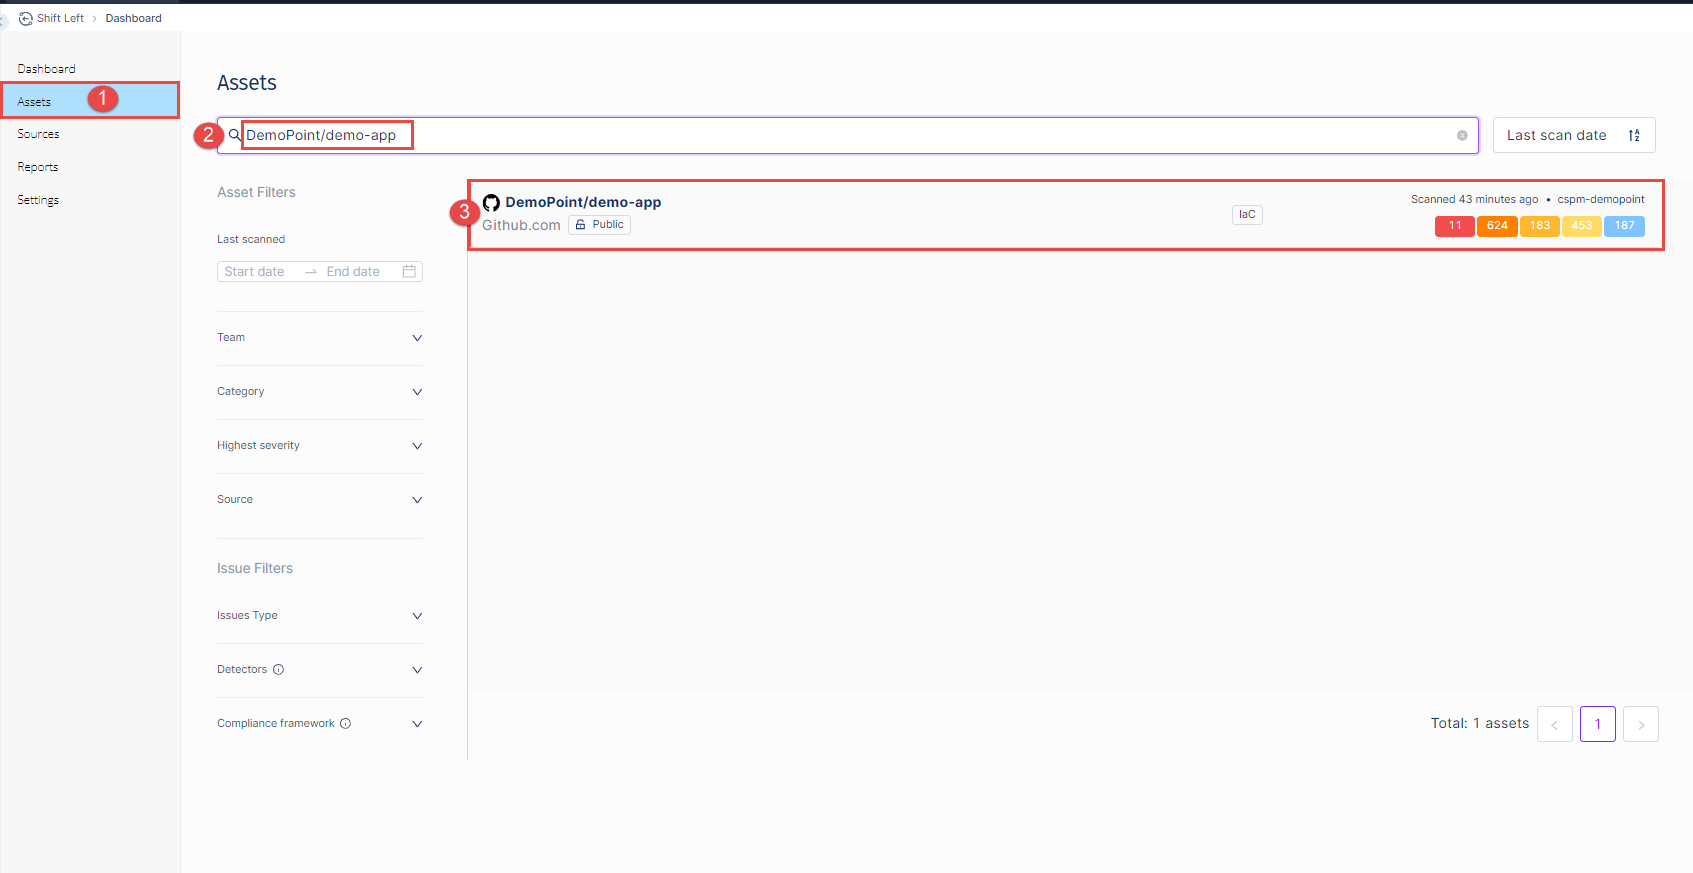
We will review issues on the cspm-demopoint card , Navigate to Assets and Search for : DemoPoint/demo-app.
|
||||||||||||
|
4 |
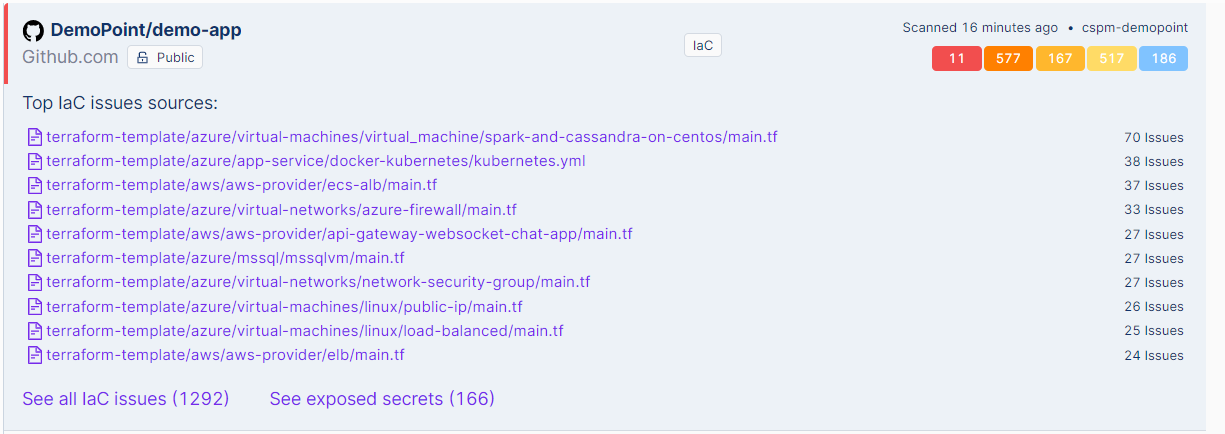
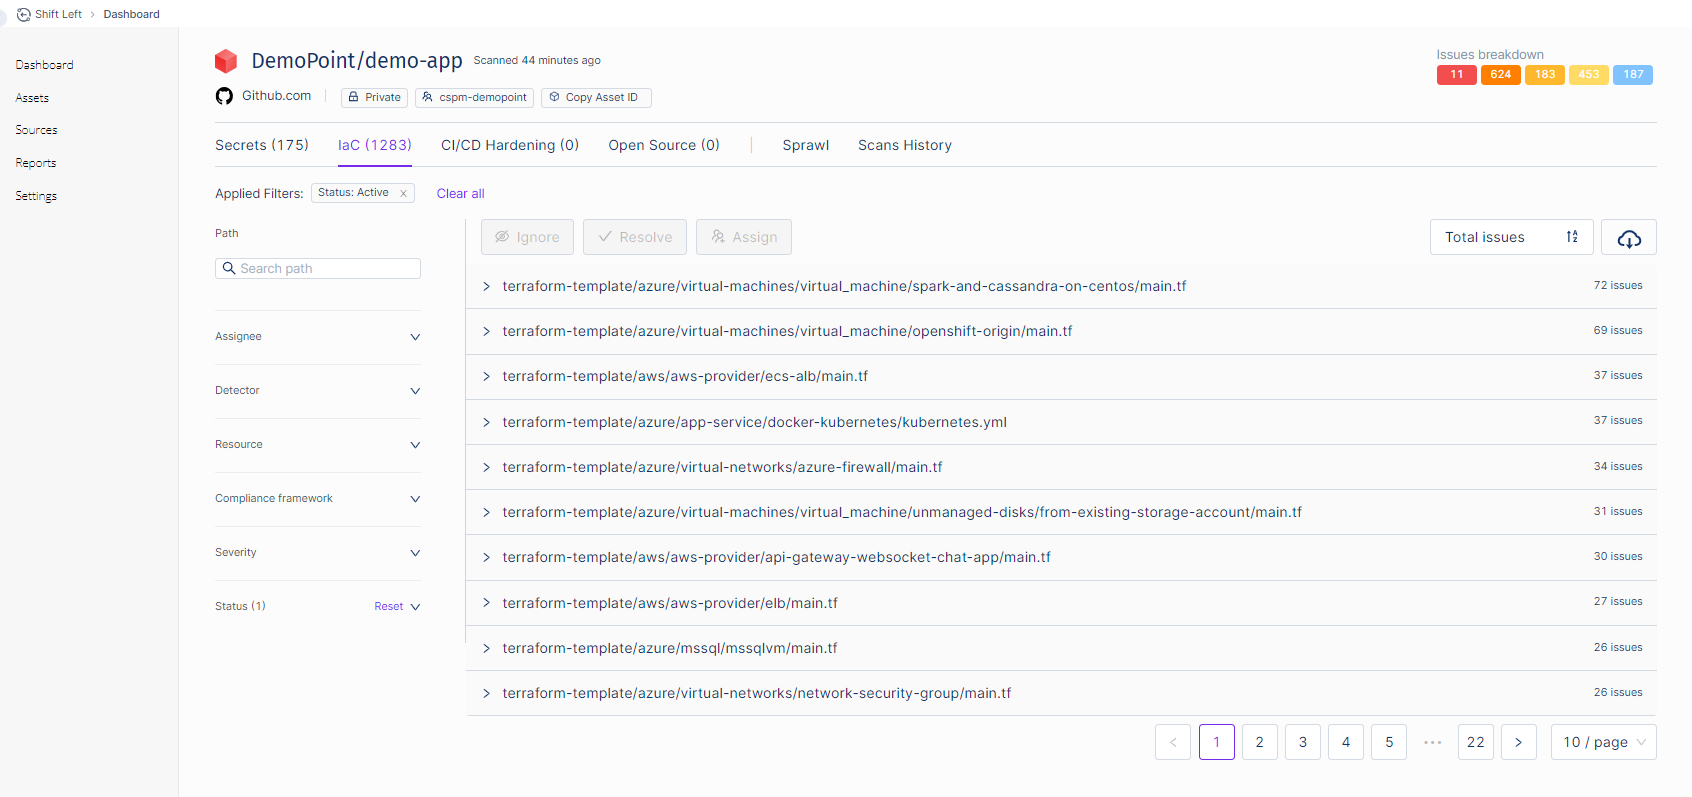
Click on the DemoPoint/demo-app asset :
|
||||||||||||
|
5 |
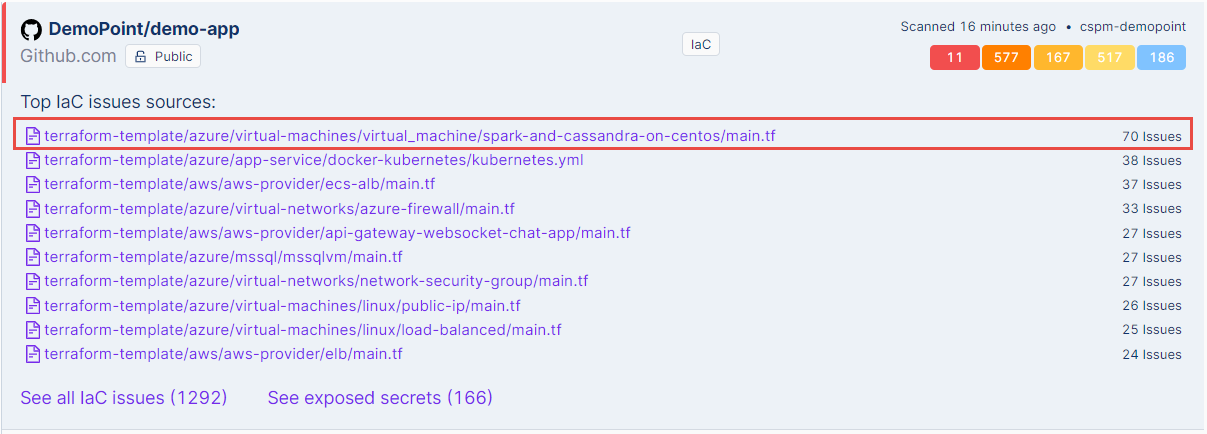
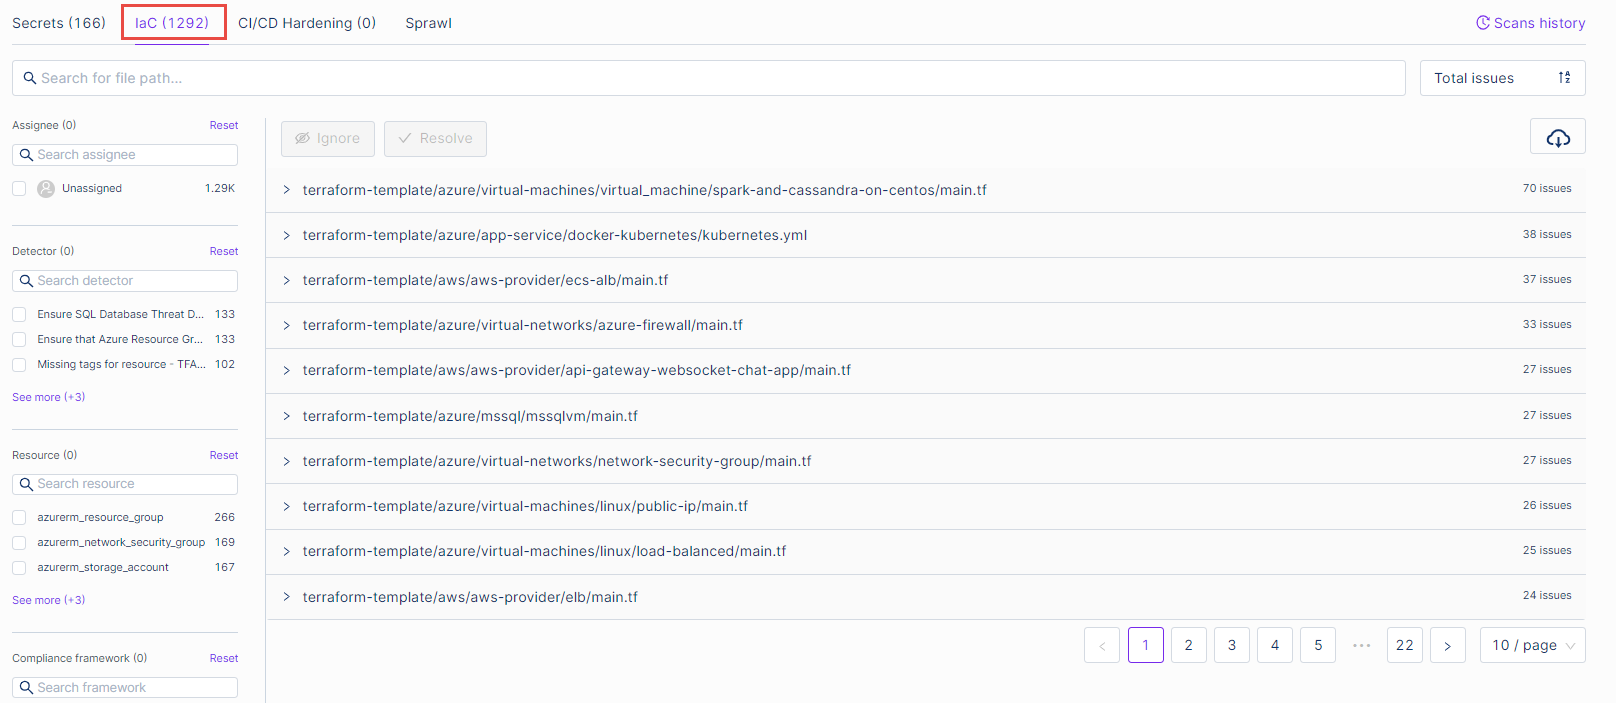
Click on one of Top IaC issues sources on DemoPoint/demo-app :
|
||||||||||||
|
6 |
You will move to the following view :
|
||||||||||||
|
7 |
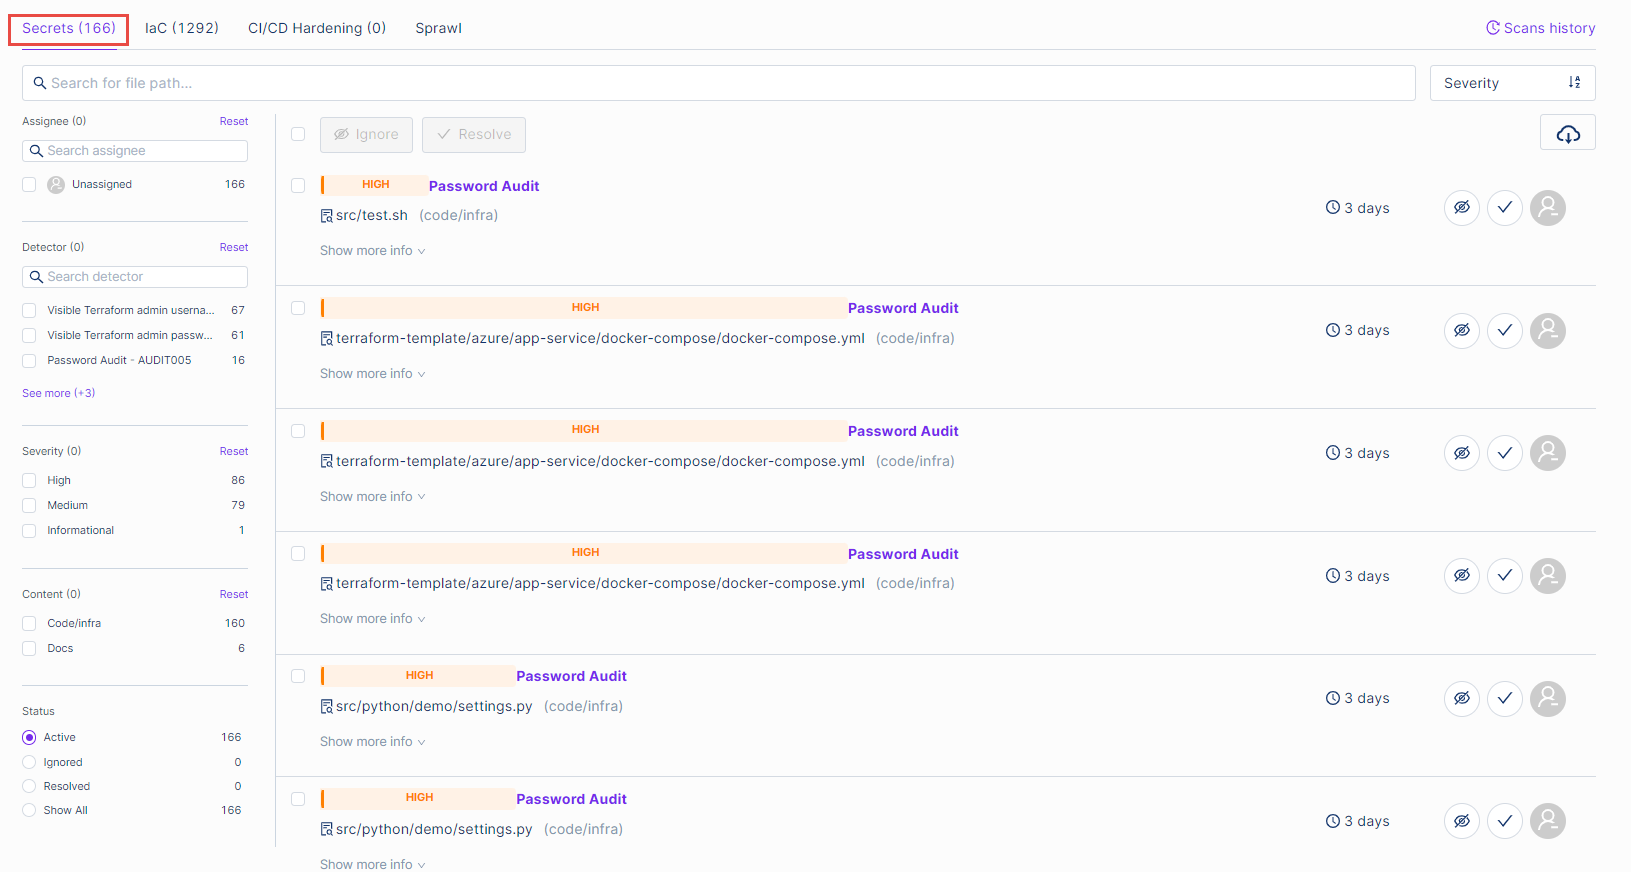
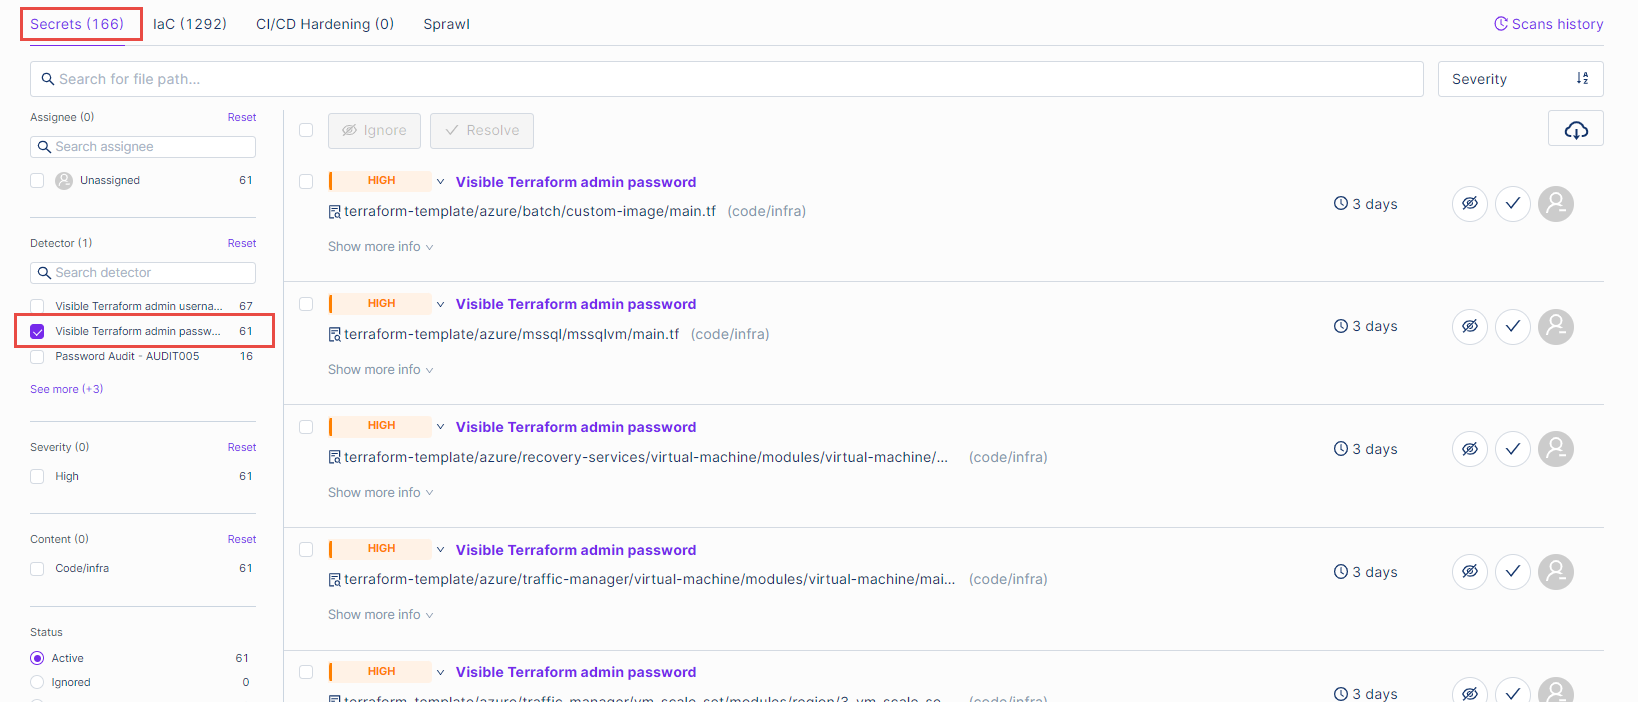
Click on the Secrets tab , Filter for the Visible Terraform admin password - TF-020 issue on the Detector filter :
|
||||||||||||
|
8 |
We will focus on the issue : Visible Terraform admin password
|
||||||||||||
|
9 |
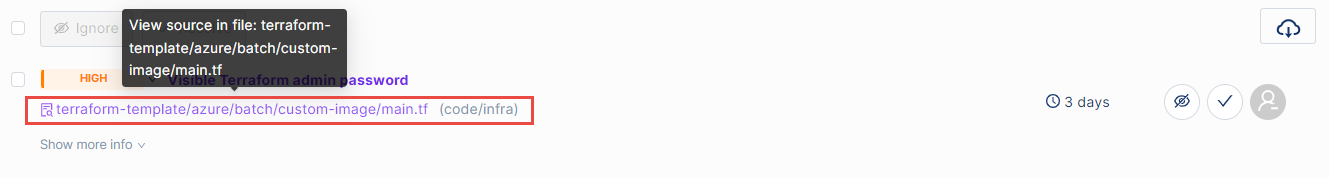
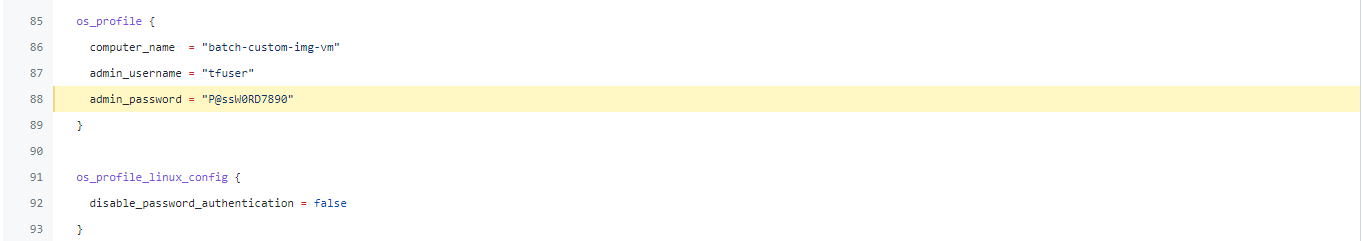
Click on the source link to review the issue on the github repository :
You will be direct to the main.tf file and the relevant issue will be marked [admin_password]:
|
||||||||||||
|
10 |
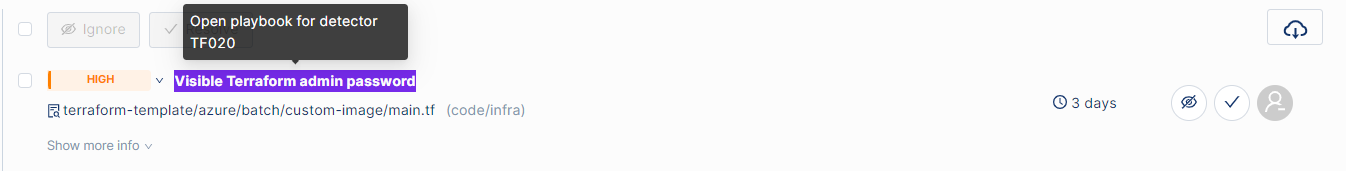
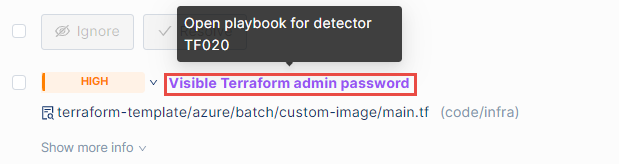
Go back to the Secrets tab on the Dashboard and hover over on Visible Terraform admin password:
|
||||||||||||
|
11 |
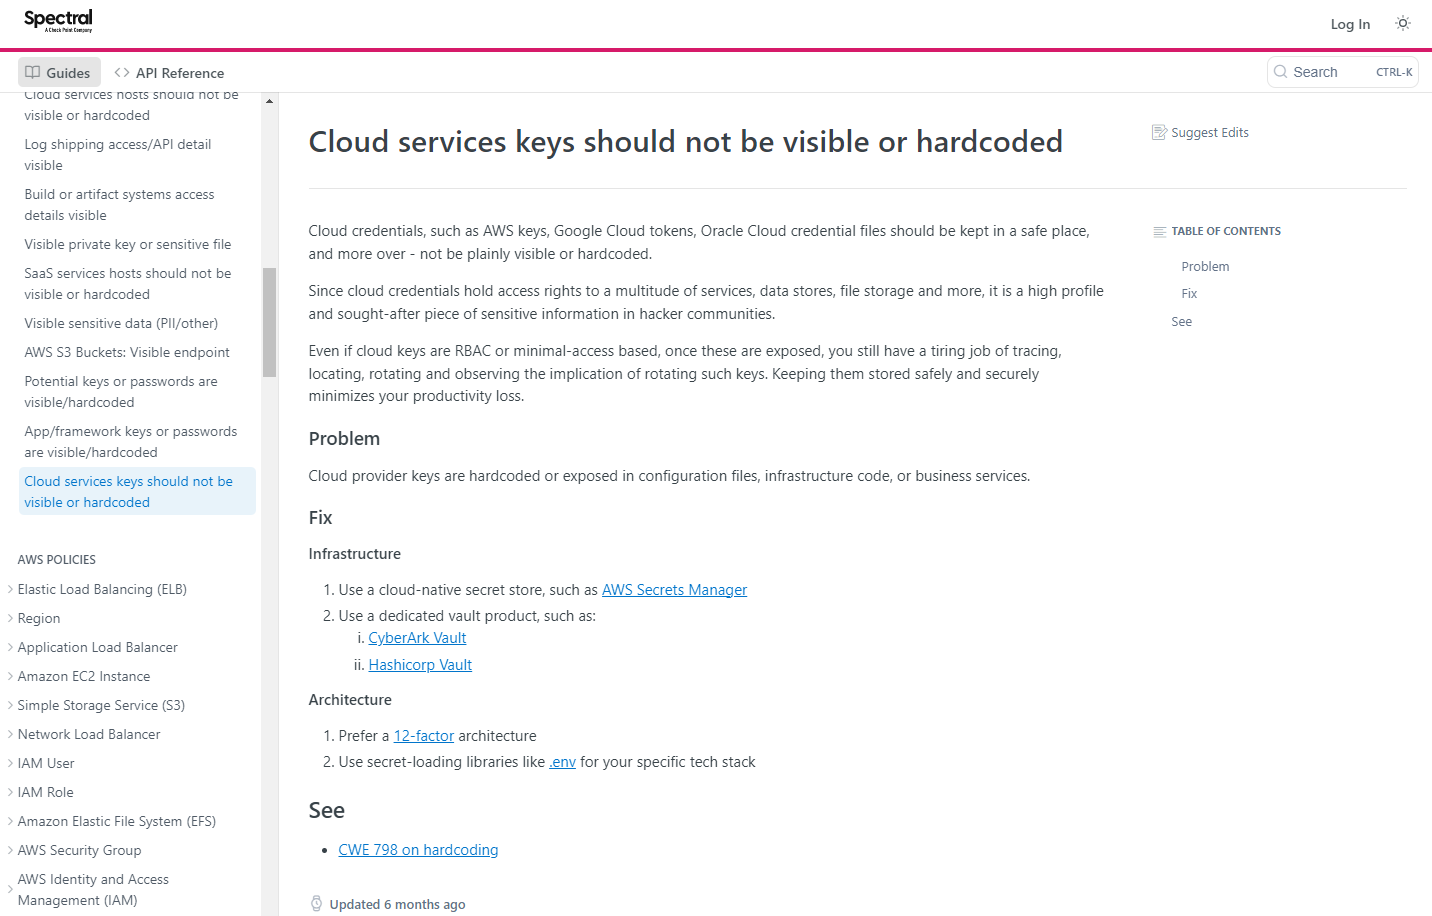
Click on the Secret issue link to open relevant playbook:
Review the description and the instructions how to solve it :
|
||||||||||||
|
12 |
Go Back to the Issues DemoPoint/demo-app and present additional examples [investigate & Detector playbooks]. |
||||||||||||
|
13 |
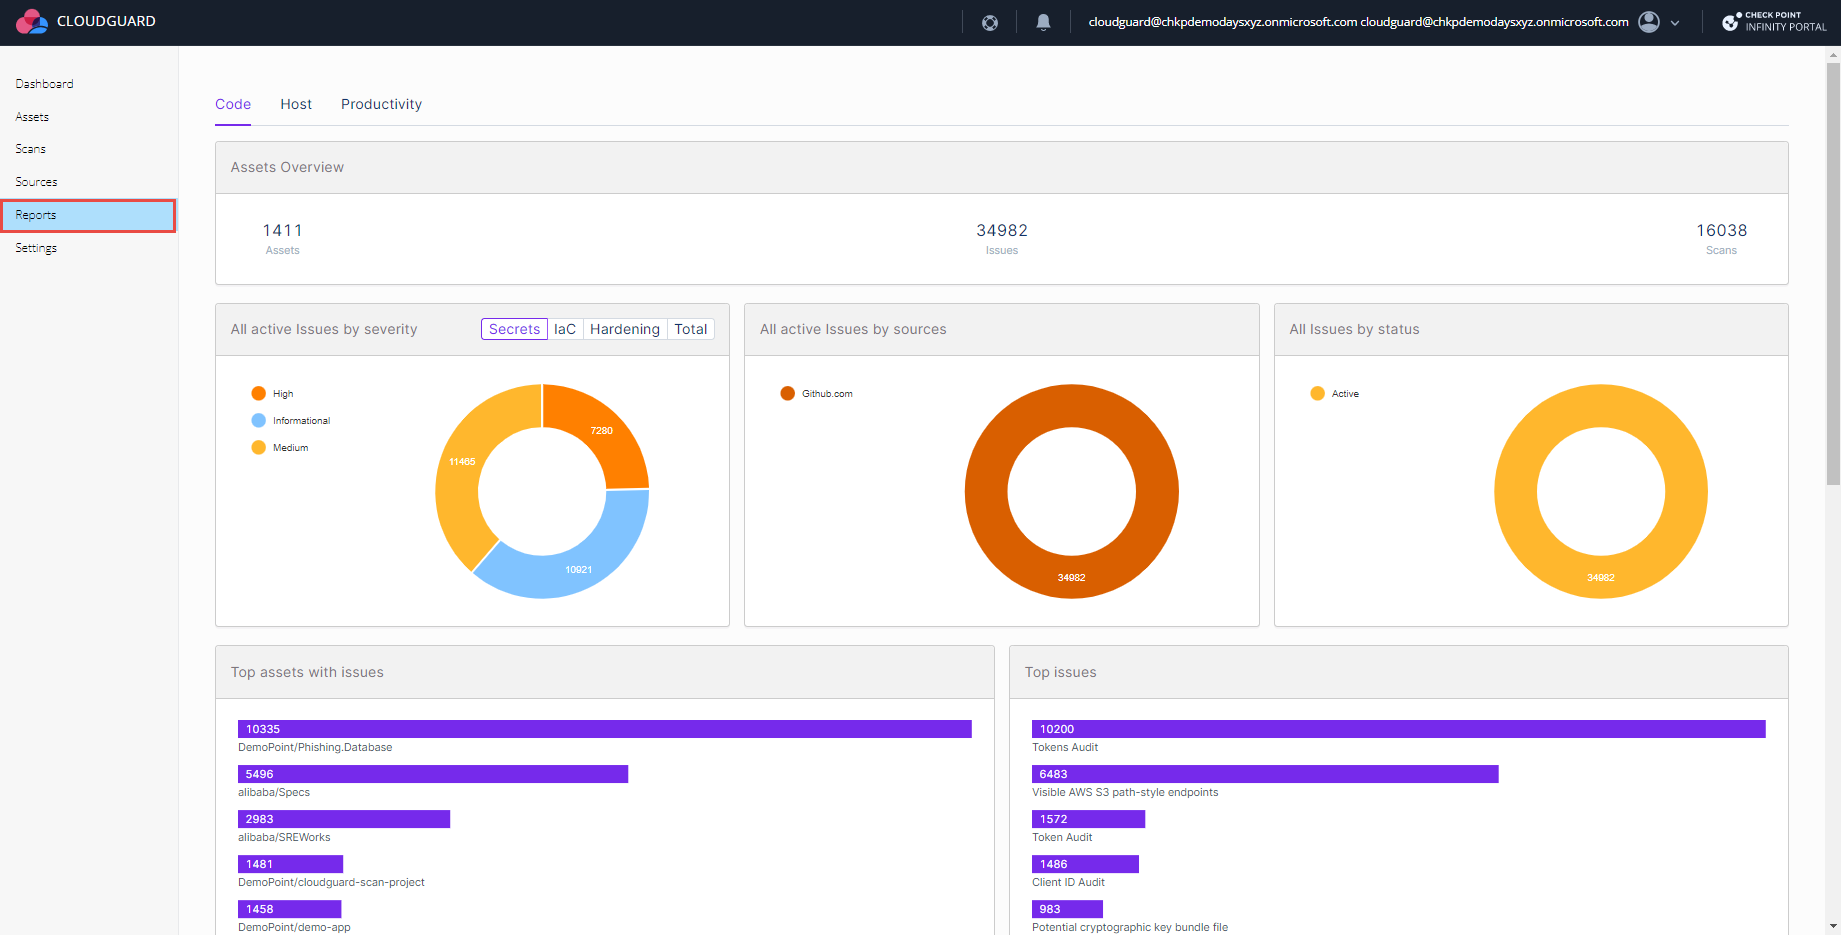
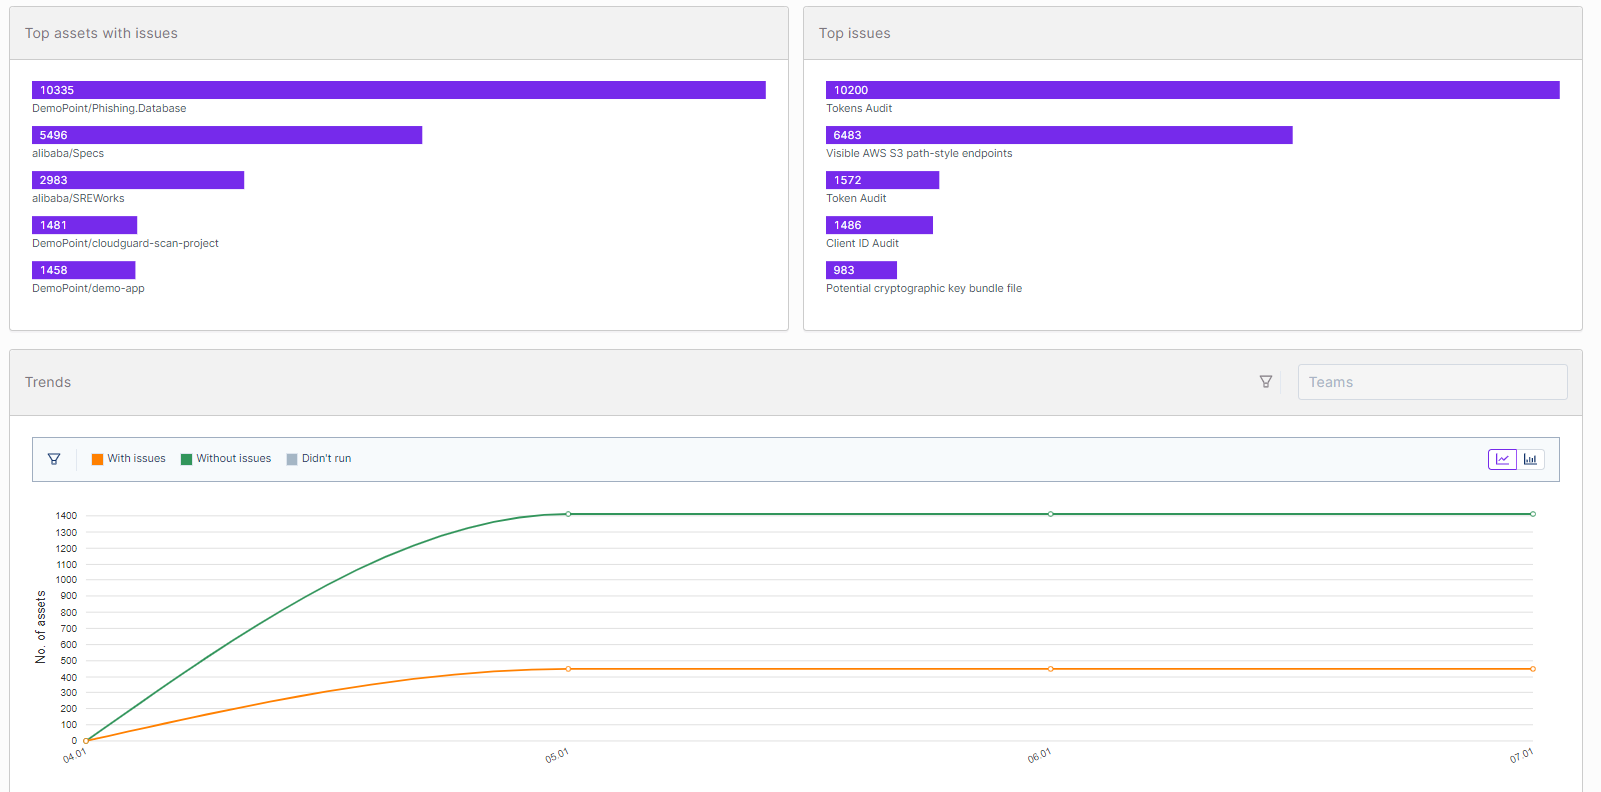
Click on Reports :
The reports on this page relate to three categories:
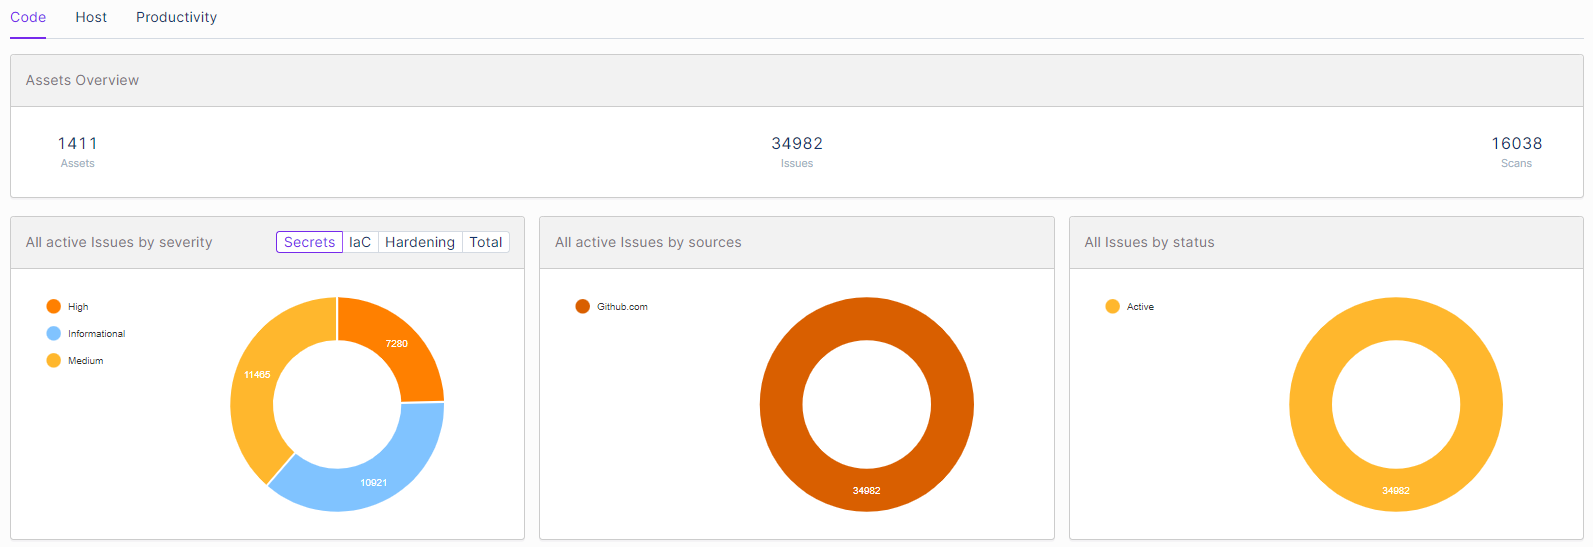
The Code reports provide general statistics for your organization:
The hotspot charts show:
You can drill down from the chart to the Asset page and view the raw data. |