and Reports
The Overview page shows a graphical summary of important information about the clients in your organization.
Operational Overview
The information in the Operational Overview appears in widgets described below. Each widget is clickable, and takes you to the relevant view based on the
The information is presented in these widgets:
|
Widget |
Description |
|---|---|
| All Endpoints |
Shows the number of protected endpoints and the number of endpoints which report issues. This widget is based on the Health view. |
| Desktops |
Shows a division of the desktops by operating systems: Windows, macOS, and Linux. This widget is based on the Health view. This widget only includes protected entities. |
|
Laptops |
Shows a division of the laptops by operating systems: Windows, macOS, and Linux. This widget is based on the Health view. This widget only includes protected entities. |
|
Deployment Status |
Shows the deployment status of the devices according to these values:
|
|
Health Status |
Shows which computers have installed components that are not running. |
|
Anti-Malware Update |
Shows the time when updates were installed on the endpoint clients:
This widget is based on the Anti-Malware update ON data in the Deployment Status. |
|
Endpoint Security Version |
Shows the client versions installed on the endpoint clients. This widget is based on the Deployment view. |
|
Operating System |
Shows the type of operating system installed on the endpoint clients:
|
In addition, in the top right section Active Alerts you can see alerts for the thresholds you created in the Endpoint Settings view > Alerts (see Monitoring Endpoint Security Deployment and Policy).
Reports
On the Reports page, you can download the reports in the pdf format:
-
Threat Extraction Report - Shows the insights on the downloaded files.
-
Check Point Cyber Security Report - Shows the latest security trends as per Check Point.
Generate Report
To generate a report:
-
Go to Overview > Reports > Generate Report.
-
Select a report, click
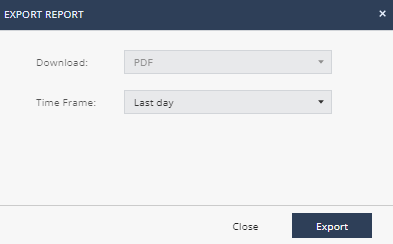
 and select Export Report.
The Export Report window appears.
-
In the Time Frame list, select Last day, Last 7 days, or Last 30 days.
-
Click Export.
Scheduled Reports
Scheduled Reports allows you to automatically generate reports at the specified date and time, and email it to the specified recipients.
|
|
Notes:
|

To schedule a report:
-
Navigate to Overview> Reports and do one of these:
-
From the Scheduled Reports page, click Add and from the Name list, select the report.
-
From the Generate Report page, select the report, click
and select Schedule Report.
-
-
From the Name list, select the report.
-
From the Time Frame list, select the period for the report:
-
Last day
-
Last 7 days
-
Last 30 days
-
-
From the Frequency list, select the frequency to generate the report:
-
To generate the report everyday, select the day of the week.
-
To generate the report weekly, select the day of the week.
-
To generate the report every month, select the date.
-
-
In the Time field, specify the time for the system to generate the report and send it to the recipients. By default, the time is in UTC. For example, if you want to generate the report at 01.00 AM Eastern Standard Time (EST), you must specify the time as 06.00 AM UTC.
-
In the Recipients field, enter the recipients for the report.
-
Click Schedule.
The schedule is added to the table. The report becomes effective 24 hours after you schedule it.
-
To edit a scheduled report, select the report in the table and click Edit.
-
To delete a scheduled report, select the report in the table and click Delete.
Announcements
The Announcements page shows the latest news and enhancements in .