
CloudGuard Controller Monitoring
Data Center Updates
CloudGuard Controller Provisions SDDC services as Virtual Data Centers that provide virtualized computer networking, storage, and security. requires reliable connectivity to the Security Gateways to continuously update them with changes to the Data Center Virtual centralized repository, or a group of physical networked hosts, Virtual Machines, and datastores. They are collected in a group for secured remote storage, management, and distribution of data. objects.
The updates of Data Center objects include:
-
Adding new IP addresses to the rule base
All rules configured in a given Security Policy. Synonym: Rulebase.. -
Removing redundant IP addresses from the rule
Set of traffic parameters and other conditions in a Rule Base (Security Policy) that cause specified actions to be taken for a communication session. base. -
Extending the expiration time on existing objects in the rule base so they do not expire and automatically erase.
If the Security Gateway stops receiving updates for a Data Center Object, the Gateway has no way to verify that the object is still a valid object on the Data Center.
To create a balance between security and connectivity, each IP address of a Data Center object has a built-in expiration timer (aka Time To Live – TTL).
The CloudGuard Controller updates the IP addresses of the Data Center objects TTL on the Security Gateway to avoid TTL expiration.
However, if the Security Gateway(s) update fails continuously (for example, because of a lack of connectivity between the Management and the Security Gateway), the TTL of the IP address is not updated.
When the full TTL of the IP address is reached, the IP address expires, and security policy Collection of rules that control network traffic and enforce organization guidelines for data protection and access to resources with packet inspection. rules that use this IP of that Data Center object are no longer enforceable.
Due to the critical nature of Data Center Objects, it is highly recommended to monitor CloudGuard Controller status.
You can configure the TTL from 5 minutes to 30 days.
For more information, see the enforcementSessionTimeoutInMinutes parameter in the Configuration Parameters section.
CloudGuard Controller Logs and Events
To monitor the CloudGuard Controller, use any of these options:
-
Filter the logs in SmartConsole
Check Point GUI application used to manage a Check Point environment - configure Security Policies, configure devices, monitor products and events, install updates, and so on. with this query syntax:blade:"CloudGuard IaaS" AND severity:Critical -
Create a User Defined Event based on logs and severity, see Creating a User Defined Event and Sending Alerts.
-
Connect the Event to an Automatic Reaction such as emails or scripts.
See the R82 Logging and Monitoring Administration Guide > Section Automatic Reactions.
-
|
|
Note - As the CloudGuard Controller uses Identity Awareness You can monitor and get a notification for this issue in SmartLog. For details, refer to sk113833. |

CloudGuard Controller Status
Options for checking the CloudGuard Controller status
|
Option |
Description |
|---|---|
|
Follow these steps:
|
|
|
In SmartConsole |
Follow these steps:
|
Output table columns:
-
Imported objects - Shows objects that are updated in the CPM process or in SmartConsole.
-
Controller Updates -Shows the number of updates sent about imported objects since the last CloudGuard Controller restart.
Note: The cpstat vsec tool does not monitor Data Center Query Objects.
SNMP Traps
To configure custom SNMP traps, refer to sk124532.
Creating a User Defined Event and Sending Alerts
The CloudGuard Controller is very critical component for the security of an organization.
If the CloudGuard Controller loses connection with a data center, for some reason, then there are no updates to the Gateways.
This a serious situation for any security administrator.
While administrators can monitor the SmartConsole logs in the office, there is also option to send critical CloudGuard Controller Events to an administrator's smartphone or email.
To create a User Defined Event
-
Enable the SmartEvent Software Blade
Specific security solution (module): (1) On a Check Point Firewall, each Software Blade inspects specific characteristics of the traffic (2) On a Management Server, each Software Blade enables different management capabilities. on the Management Server.See the R82 Logging and Monitoring Administration Guide > Section Deploying SmartEvent.
-
Open the Legacy SmartEvent GUI client:
-
From the left navigation panel, click Logs & Events.
-
At the top, click the + tab.
-
At the bottom, in the section External Apps, click SmartEvent Settings & Policy.
-
-
In the SmartEvent Policy tree, right-click Event policy.
The Event Definition wizard opens.
-
Step 1/6: In the Event Definition wizard window, below Create an event, select that is completely new > click Next.
-
Step 2/6: In the Name field, enter a name for the Event.
From the Severity list, select a severity for the event > click Next.
-
Step 3/6: Select a single log > click Next.
-
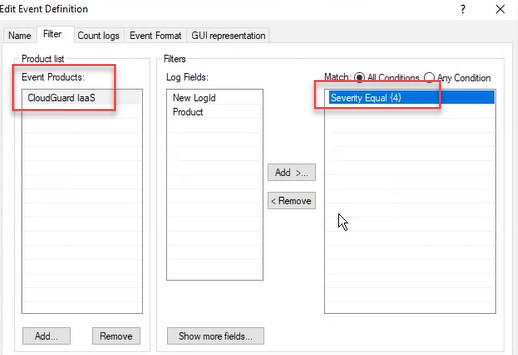
Step 4/6: Click Add product > select the checkbox for Cloud Firewall IaaS > click Next.
-
Step 5/6: Below the Define the condition that specifies which {your event name} logs are appropriate for this event:
-
Select Show more fields > Existing field.
The Select Log Fields window opens.
-
Below Log Fields, select Severity > click OK.
-
Below Available Log Fields, select Severity, click Add.
The Severity Filter window opens.
-
Click Add, in the Value field enter the number '4' for the value (four is the highest, referred to as "critical") > click OK.
-
Make sure that In the Event Definition wizard window, the right-side box now shows Severity Equal {x} > click Next.
-
Click Finish.
-
To install the policy, click Yes.
Note - In the SmartEvent window that opens, click Yes to install the policy.
There is now a User Defined Event, in this example "CloudGuard IaaS Critical", that you can connect to Automatic Reaction which you create.
-
-
(Optional) To create an Automatic Reaction Alert
Use SmartEvent to send push notifications to your mobile device or email account.
This allows you to get notification even when your not in front of SmartConsole, and even when your are not in the office.
In SmartEvent, this is called "Automatic Reaction."
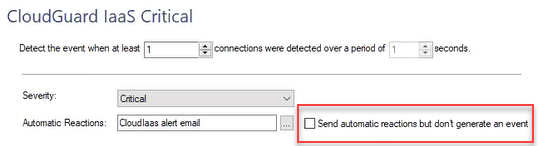
For more information about how to edit an event, see the R82 Logging and Monitoring Administration Guide
-
In the SmartEvent tree, right-click User Defined Events select the event.
-
In the top field, enter the parameters for detecting an Event.
Example, "Detect the event when at least 2 connections where detected over a period of 120 seconds".
-
Select the button to the right of the Automatic Reactions tab.
-
Select Add new > select Mail or External Script.
The Add Automatic Reaction window opens.
For more information about External scripts, see the R82 Logging and Monitoring Administration Guide > Section Creating an External Script Automatic Reaction.
-
In the Name field, delete the default name and enter a different name. For example, "Cloud Firewall IaaS alert email".
-
In the Command line field, enter the path and the name of the script. For example, "
/var/log/myscript.sh". -
Click Save.
-
In the Automatic Reactions window, click OK.
-
From the SmartEvent toolbar, click the save icon > click Yes.
Integration Events & AIOps
Starting from the R82 CloudGuard Controller self-updatable package Take 35, CloudGuard Controller can integrate with Events & AIOps (formerly Infinity AIOps) in the Check Point Portal to provide centralized visibility of operational metrics and alerts for supported Check Point assets, including CloudGuard Controller management components.
Onboarding and Requirements
Before you go on board to Events & AIOps, make sure your environment meets the prerequisites for supported assets and versions. Then connect your Security Management Server Dedicated Check Point server that runs Check Point software to manage the objects and policies in a Check Point environment within a single management Domain. Synonym: Single-Domain Security Management Server. to your Check Point Portal tenant and complete the Events & AIOps onboarding flow.
For prerequisites, supported assets and versions, onboarding steps, and limitations, see the Events & AIOps Administration Guide (refer to the On-boarding AIOps > Automatic Mode section).
Limitation
Multi-Domain Security Management Server Dedicated Check Point server that runs Check Point software to host virtual Security Management Servers called Domain Management Servers. Synonym: Multi-Domain Security Management Server. Acronym: MDS. (MDS) is not supported in AIOps.
To view alerts for monitored assets, go to AIOps > Alerts in Events & AIOps.
CloudGuard Controller Alerts in Events & AIOps
These are the available CloudGuard Controller Alerts in Events & AIOps:
-
CloudGuard Controller service stopped
This alert indicates that the Controller service has stopped. Managing dynamic cloud objects and enforcing policies are affected, which can cause policy mismatch failures.
This alert is based on a default downtime threshold of 30 seconds. To change this value:
-
Edit the $FWDIR/conf/ vsec.conf file on the Security Management Server, and add the line:
downtimeThreshold=<VALUE> -
Restart the CloudGuard Controller with the command:
vsec stop;vsec startFor more information, refer to Configuration Parameters.
-
-
CloudGuard Controller memory limit reached
This alert indicates that CloudGuard Controller ran out of memory.
-
CloudGuard Controller gateway update failed
This alert indicates that the CloudGuard Controller failed to update the Data Center objects on the gateway.
-
CloudGuard Controller scanner mapping failed
This alert indicates that the Data Center mapping failed.
|
|
Note - For more details about alert structure, see the AIOps Alerts section in the Events & AIOps Administration Guide. |
SmartTask
Starting in R81.20, there is a new SmartTask in SmartConsole for monitoring CloudGuard Controller.
SmartTasks let you configure automatic actions according to different triggers in the system. A SmartTask is a combination of trigger and action.
The trigger is a CloudGuard Controller Event that is activated when a new log is generated that matches this query in SmartConsole > Logs & Events view > Logs tab:
|
|
For the action you can select: Run script, Execute a Web request, or Send mail.
For more information on SmartTasks, see the R82 Security Management Administration Guide.
Example:
