Viewing Rule Logs
You can search for the logs that are generated by a specific rule![]() Set of traffic parameters and other conditions in a Rule Base (Security Policy) that cause specified actions to be taken for a communication session., from the Security Policy
Set of traffic parameters and other conditions in a Rule Base (Security Policy) that cause specified actions to be taken for a communication session., from the Security Policy![]() Collection of rules that control network traffic and enforce organization guidelines for data protection and access to resources with packet inspection. or from the Logs & Events > Logs tab.
Collection of rules that control network traffic and enforce organization guidelines for data protection and access to resources with packet inspection. or from the Logs & Events > Logs tab.
To see logs generated by a rule (from the Security Policy):
-
In SmartConsole
 Check Point GUI application used to manage a Check Point environment - configure Security Policies, configure devices, monitor products and events, install updates, and so on., From the left navigation panel, click Security Policies.
 -
In the Access Control Policy or Threat Prevention Policy, select a rule.
-
In the bottom pane, click one of these tabs to see:
-
Logs - By default, shows the logs for the Current Rule. You can filter them by Source, Destination, Blade, Action, Service, Port, Source Port, Rule (Current rule is the default), Origin, User, or Other Fields.
-
History (Access Control Policy only) - List of rule operations (Audit logs) related to the rule in chronological order, with the information about the rule type and the administrator that made the change.
-
To see logs generated by a rule (by Searching the Logs):
-
In SmartConsole, go to the Security Policies view.
-
In the Access ControlPolicy or Threat PreventionPolicy, select a rule.
-
Right-click the rule number and select Copy Rule UID.
-
In the Logs & Events > Logs tab, search for the logs in one of these ways:
-
Paste the Rule UID into the query search bar and click Enter.
-
For faster results, use this syntax in the query search bar:
layer_uuid_rule_uuid:*_<UID>For example, paste this into the query search bar and click Enter:
layer_uuid_rule_uuid:*_46f0ee3b-026d-45b0-b7f0-5d71f6d8eb10
-
To exclude logs generated by rules in a specific a layer from the SmartConsole Logs view:
-
In SmartConsole, From the left navigation panel, click Security Policies.
-
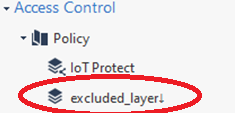
Go to Access Control > Policy, right-click the Policy Layer whose logs you want to exclude and click Edit Policy.
-
In the window that opens, go to the applicable layer, right-click the drop-down menu, and select Edit Layer.
-
Add a downward arrow ↓ to the layer's name. You can add the downward arrow in two ways:
-
Copy it from here: ↓
Or
-
Enter the corresponding ASCII code:
-
Press and hold the Alt key.
-
Enter the digit 2.
-
Enter the digit 5.
-
Release the Alt key.
-
Example:
-
|
|
Notes:
|
