Widgets
You can customize the widgets to optimize the visual display. To customize widgets, switch to edit mode. Click Options > Edit.
-
To save changes, click Done.
-
To cancel changes, click on Discard.
-
To restore the predefined view to the default values, click Options > Restore Defaults.
Note - Restore Defaults option is only available after you modify a predefined view.
Adding and Customizing Widgets
To add a Widget:
-
Double-click a view or report
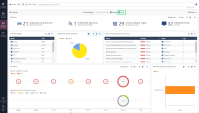
 Summary of network activity and Security Policy enforcement that is generated by Check Point products, such as SmartEvent. to open it.
 -
Click Options > Edit.
-
Click Add Widget and select the widget type.
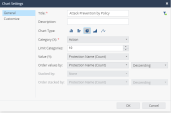
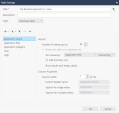
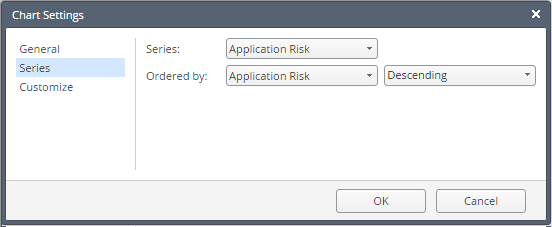
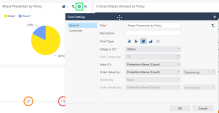
Chart Settings:
-
Enter a title.
-
Select a chart type: vertical bar, horizontal bar, pie, area or line.
-
Select a data category for the X axis.
-
Define how the Top Values are calculated (by number of logs, or by traffic).
-
Set a limit for how many top values to show.
-
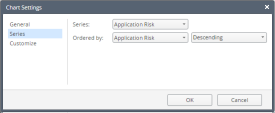
Optional: click Series - Split the results into colored groups with different values for the series.
-
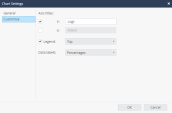
Optional: click Customize and define axis titles and legend position.
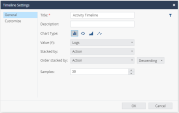
Timeline Settings:
-
Enter a title.
-
Select a timeline graphical presentation: vertical bar, doughnut, area or line.
Notes:
-
In R81 GA, the last field is called Samples and accepts integer values.
-
In R81 with R80.40 Jumbo Hotfix Accumulator, the field is called Resolution and it is a drop-down list with predefined values.
-
-
Select the data to count.
-
Advanced - split the results into colored groups, with different values for the Series.
-
Define the time-granularity. Enter the number of bars or doughnuts to show.
Table Settings:
-
Enter a title.
-
Manage columns: add, edit, remove, and change the order.
-
Select a column on the left and define its settings:
-
Enter the number of top values to show.
-
Select how values are sorted.
-
-
Select this option to group results with the same value in one row.
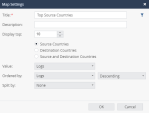
Map Settings:
-
Enter a title.
-
Enter the number of Top Countries to mark.
-
Select to mark Top Source Countries, Top Destination Countries, or both.
-
Define how to find the Top Countries (for example, by number of logs or by traffic).
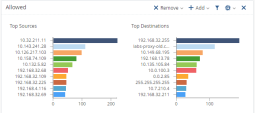
The infographic widget shows large meaningful values. For example:

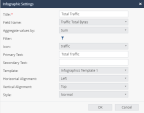
Infographic Settings:
-
Enter a title
-
Select a field to count. Selecting None means all the logs that match the filter criteria are counted.
-
Define filter criteria.
This critieria is in addition to the inherited filters for the report and view layers.
For more, see Filters in Widgets.
-
Optional: Enter an icon name in the field.
Select a name from the list below. Pay attention to upper and lower case letters and the use of hyphens.
Icon
Used for
apps
attacks
hosts
gateway
traffic
usercheck
users
new
Audit Logs
add
Audit Logs
remove
Audit logs
modify
Audit logs
install-policy
publish
ips
anti-bot
anti-virus
threat-emulation
-
Enter primary text that describes the value counted.
-
Optional: For secondary text, enter a more detailed description.
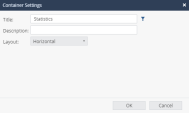
Use a container to unify multiple widgets into one frame. Add a container, then add, edit, or remove the widgets inside it.
Note - The container widget cannot be added to a container.
Container Settings:
-
Enter a title.
-
Optional: filter at the container level. The filter applies to all internal widgets.
-
Select the widget order inside the container: Horizontal, Vertical, Grid or Tabs.
After the container is added to the view, you can configure it further.
-
Remove the widget from the container.
-
Add a new widget.
-
Edit the settings for the container, or edit one of the widgets in the list.
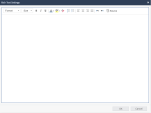
Use this window to add textual explanations to the View text box.
-
-
Click OK.
-
Select filters for the widget in addition to the inherited filters from the report and view layers. See Filters in Widgets.
-
Configure settings for the widget.


To customize a widget:
-
In the view where the widget is located, click Options > Edit.
-
Go to the required widget and click the wheel icon to edit the image properties:.
-
Edit the required properties.
-
Click Done.


Copying Widgets to other Locations
You can copy a widget used in one view or report and paste it in another view or report.
To copy a widget to another location:
-
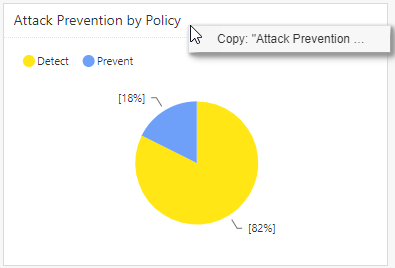
Right-click the required widget.
-
The copy option shows with the name of the widget:
-
Select Copy: [widget name].
-
Go to the view or report in which you want to paste the widget.
-
Go to Options and select Edit:
-
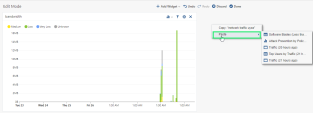
Right-click an empty space in the view or report.
From the Paste drop-down menu, select the widget you want to paste:
-
Click Done.

|
|
Note - When you copy a widget to another view or report, the copied widget does not include the filter of the original view or report, only the filter defined for the copied widget. |

Filters
The search bar is used to apply on-demand filters, but you can also save filters with the view / report definition.

There are different layers of filters:
-
Filters to apply to the full report.
-
Filters to apply to a view (specified page in a report) and all widgets that this page includes.
-
Filters to apply to the selected widget.
To edit the view filter:

-
Click the + (plus) button to add a filter.
To delete a filter, click the X button. -
Select a field.
To enable free text search, select Custom Filter. -
Select a comparison method.
-
Select or enter the value.
You can define multiple values.
Filtering for Active Directory User Groups
You can filter logs, reports, and views for one or more Active Directory groups.
-
In your Access Control Policy, create an Access Role that includes all the Active Directory groups you want to have in the query.
-
Install the Access Control Policy on the Security Gateways.
-
Look at the Identity Awareness
Check Point Software Blade on a Security Gateway that enforces network access and audits data based on network location, the identity of the user, and the identity of the computer. Acronym: IDA. login logs, and copy the names of the relevant groups. They usually have the prefix "ad_". -
Add a filter for the field User Group and type or paste the name of the group that you want to include in the filter. For multiple groups, use a comma-separated list.